Past Exam Questions
← Back9709 P3 - Jun 2004 - Q10
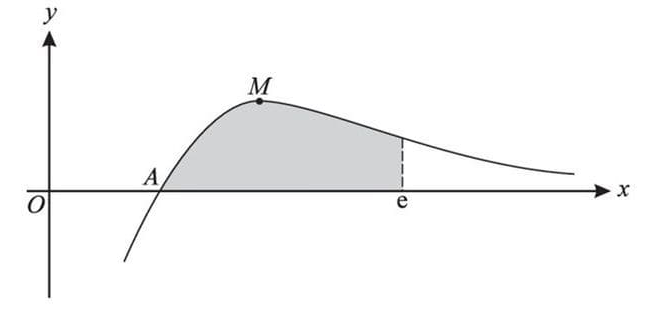
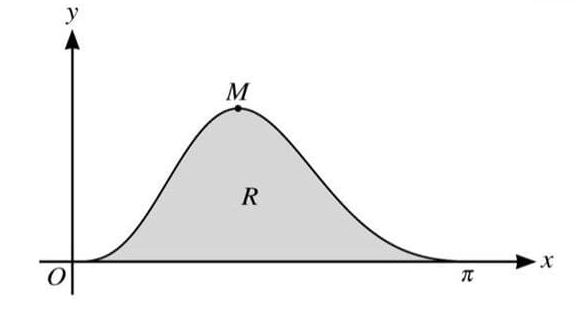
The diagram shows the curve \(y = \frac{\ln x}{x^2}\) and its maximum point \(M\). The curve cuts the \(x\)-axis at \(A\).
(i) Write down the \(x\)-coordinate of \(A\).
(ii) Find the exact coordinates of \(M\).
(iii) Use integration by parts to find the exact area of the shaded region enclosed by the curve, the \(x\)-axis and the line \(x = e\).
9709 P3 - Nov 2003 - Q6
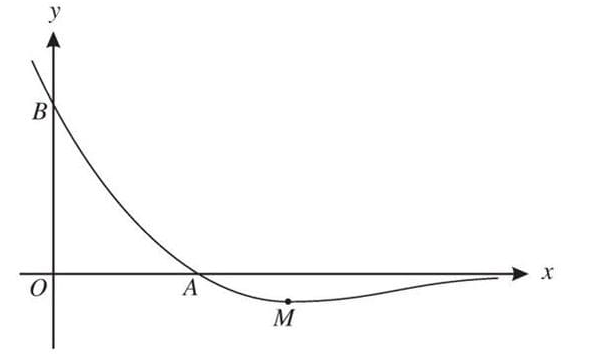
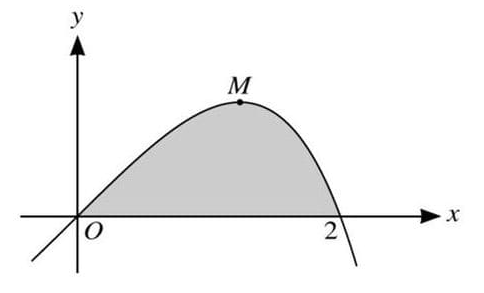
The diagram shows the curve \(y = (3 - x)e^{-2x}\) and its minimum point \(M\). The curve intersects the x-axis at \(A\) and the y-axis at \(B\).
(i) Calculate the x-coordinate of \(M\).
(ii) Find the area of the region bounded by \(OA, OB\) and the curve, giving your answer in terms of \(e\).
9709 P32 - Nov 2023 - Q9
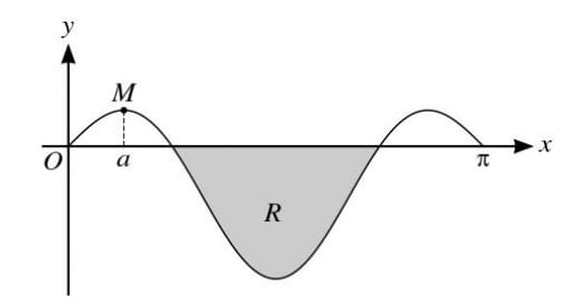
The diagram shows the curve \(y = \\sin x \\cos 2x\), for \(0 \leq x \leq \\pi\), and a maximum point \(M\), where \(x = a\). The shaded region between the curve and the \(x\)-axis is denoted by \(R\).
(a) Find the value of \(a\) correct to 2 decimal places.
(b) Find the exact area of the region \(R\), giving your answer in simplified form.
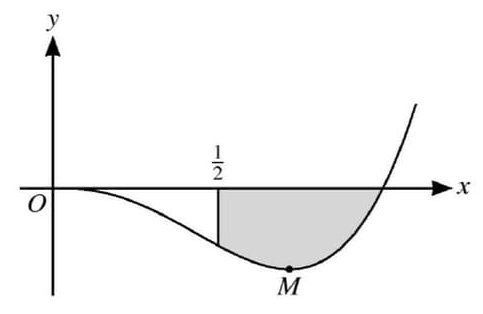
9709 P32 - Mar 2023 - Q8
The diagram shows the curve \(y = x^3 \ln x\), for \(x > 0\), and its minimum point \(M\).
(a) Find the exact coordinates of \(M\).
(b) Find the exact area of the shaded region bounded by the curve, the \(x\)-axis and the line \(x = \frac{1}{2}\).
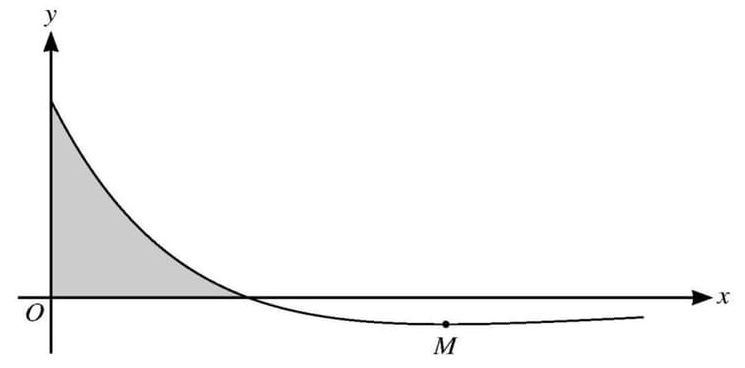
9709 P31 - Nov 2022 - Q9
The diagram shows part of the curve \(y = (3-x)e^{-\frac{1}{3}x}\) for \(x \geq 0\), and its minimum point \(M\).
(a) Find the exact coordinates of \(M\).
(b) Find the area of the shaded region bounded by the curve and the axes, giving your answer in terms of \(e\).
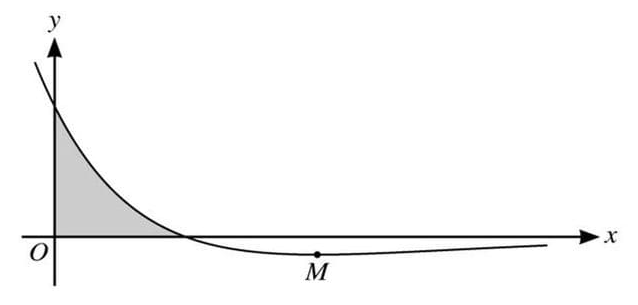
9709 P31 - Nov 2020 - Q10
The diagram shows the curve \(y = (2-x)e^{-\frac{1}{2}x}\), and its minimum point \(M\).
(a) Find the exact coordinates of \(M\).
(b) Find the area of the shaded region bounded by the curve and the axes. Give your answer in terms of \(e\).
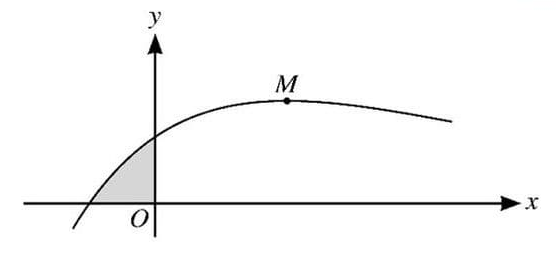
9709 P32 - Jun 2018 - Q8
The diagram shows the curve \(y = (x + 1) e^{-\frac{1}{3}x}\) and its maximum point \(M\).
(i) Find the \(x\)-coordinate of \(M\).
(ii) Find the area of the shaded region enclosed by the curve and the axes, giving your answer in terms of \(e\).
9709 P31 - Nov 2017 - Q9
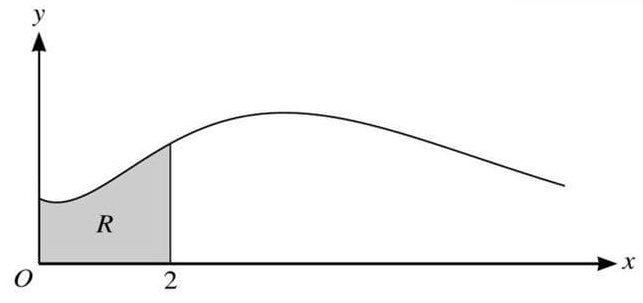
The diagram shows the curve \(y = (1 + x^2) e^{-\frac{1}{2}x}\) for \(x \geq 0\). The shaded region \(R\) is enclosed by the curve, the \(x\)-axis and the lines \(x = 0\) and \(x = 2\).
(i) Find the exact values of the \(x\)-coordinates of the stationary points of the curve.
(ii) Show that the exact value of the area of \(R\) is \(18 - \frac{42}{e}\).
9709 P32 - Mar 2017 - Q10
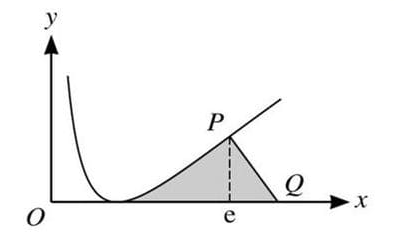
The diagram shows the curve \(y = (\ln x)^2\). The x-coordinate of the point \(P\) is equal to \(e\), and the normal to the curve at \(P\) meets the x-axis at \(Q\).
(i) Find the x-coordinate of \(Q\).
(ii) Show that \(\int \ln x \, dx = x \ln x - x + c\), where \(c\) is a constant.
(iii) Using integration by parts, or otherwise, find the exact value of the area of the shaded region between the curve, the x-axis and the normal \(PQ\).
9709 P31 - Nov 2016 - Q7
The diagram shows part of the curve \(y = (2x - x^2)e^{\frac{1}{2}x}\) and its maximum point \(M\).
(i) Find the exact \(x\)-coordinate of \(M\).
(ii) Find the exact value of the area of the shaded region bounded by the curve and the positive \(x\)-axis.
9709 P33 - Jun 2023 - Q7
(a) Use the substitution \(u = \, \cos x\) to show that \(\int_{0}^{\pi} \sin 2x \, e^{2 \cos x} \, dx = \int_{-1}^{1} 2u e^{2u} \, du\).
(b) Hence find the exact value of \(\int_{0}^{\pi} \sin 2x \, e^{2 \cos x} \, dx\).
Question #1775
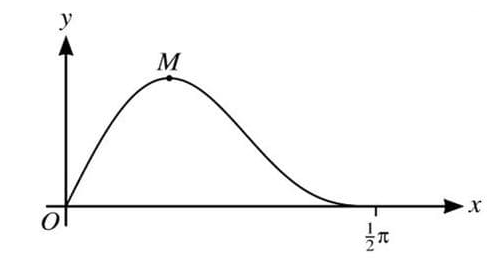
The diagram shows the curve \(y = \\sin 2x \\cos^2 x\) for \(0 \leq x \leq \frac{1}{2}\pi\), and its maximum point \(M\).
(a) Using the substitution \(u = \\sin x\), find the exact area of the region bounded by the curve and the \(x\)-axis.
(b) Find the exact \(x\)-coordinate of \(M\).
9709 P33 - Nov 2019 - Q10
The diagram shows the graph of \(y = e^{\cos x} \sin^3 x\) for \(0 \leq x \leq \pi\), and its maximum point \(M\). The shaded region \(R\) is bounded by the curve and the \(x\)-axis.
- Find the \(x\)-coordinate of \(M\). Show all necessary working and give your answer correct to 2 decimal places.
- By first using the substitution \(u = \cos x\), find the exact value of the area of \(R\).
9709 P31 - Jun 2011 - Q7
The integral \(I\) is defined by \(I = \int_0^2 4t^3 \ln(t^2 + 1) \, dt\).
(i) Use the substitution \(x = t^2 + 1\) to show that \(I = \int_1^5 (2x - 2) \ln x \, dx\).
(ii) Hence find the exact value of \(I\).
9709 P3 - Jun 2002 - Q10
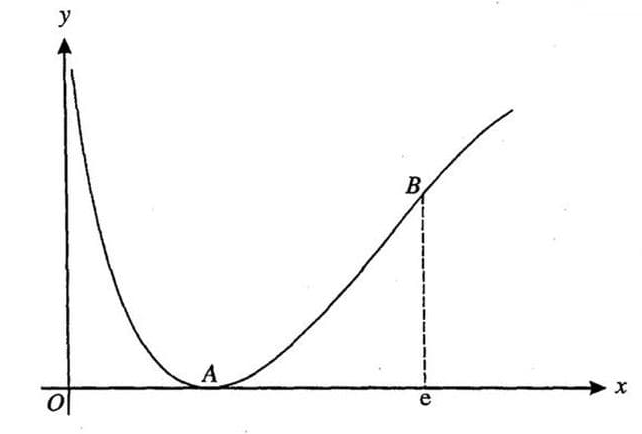
The function \(f\) is defined by \(f(x) = (\ln x)^2\) for \(x > 0\). The diagram shows a sketch of the graph of \(y = f(x)\). The minimum point of the graph is \(A\). The point \(B\) has \(x\)-coordinate \(e\).
(i) State the \(x\)-coordinate of \(A\).
(ii) Show that \(f''(x) = 0\) at \(B\).
(iii) Use the substitution \(x = e^u\) to show that the area of the region bounded by the \(x\)-axis, the line \(x = e\), and the part of the curve between \(A\) and \(B\) is given by \(\int_0^1 u^2 e^u \, du\).
(iv) Hence, or otherwise, find the exact value of this area.
9709 P32 - Jun 2019 - Q10
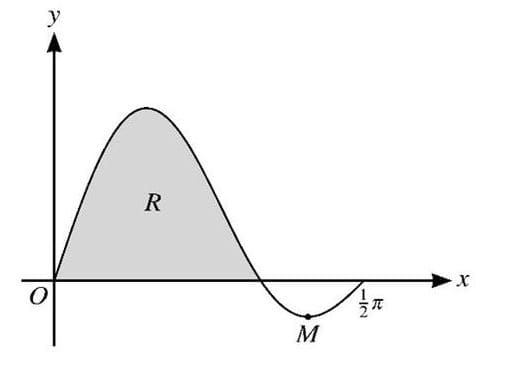
The diagram shows the curve \(y = \sin 3x \cos x\) for \(0 \leq x \leq \frac{1}{2}\pi\) and its minimum point \(M\). The shaded region \(R\) is bounded by the curve and the \(x\)-axis.
(i) By expanding \(\sin(3x + x)\) and \(\sin(3x - x)\) show that \(\sin 3x \cos x = \frac{1}{2}(\sin 4x + \sin 2x)\).
(ii) Using the result of part (i) and showing all necessary working, find the exact area of the region \(R\).
(iii) Using the result of part (i), express \(\frac{dy}{dx}\) in terms of \(\cos 2x\) and hence find the \(x\)-coordinate of \(M\), giving your answer correct to 2 decimal places.
9709 P31 - Nov 2015 - Q10
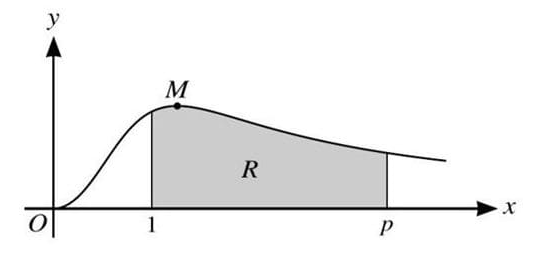
The diagram shows the curve \(y = \frac{x^2}{1 + x^3}\) for \(x \geq 0\), and its maximum point \(M\). The shaded region \(R\) is enclosed by the curve, the \(x\)-axis and the lines \(x = 1\) and \(x = p\).
(i) Find the exact value of the \(x\)-coordinate of \(M\).
(ii) Calculate the value of \(p\) for which the area of \(R\) is equal to 1. Give your answer correct to 3 significant figures.
9709 P31 - Jun 2012 - Q5
The diagram shows the curve
\(y = 8 \sin \frac{1}{2}x - \tan \frac{1}{2}x\)
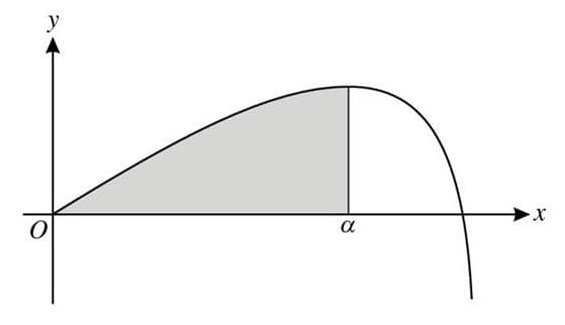
for \(0 \leq x < \pi\). The \(x\)-coordinate of the maximum point is \(\alpha\) and the shaded region is enclosed by the curve and the lines \(x = \alpha\) and \(y = 0\).
(i) Show that \(\alpha = \frac{2}{3}\pi\).
(ii) Find the exact value of the area of the shaded region.
9709 P33 - Jun 2010 - Q5
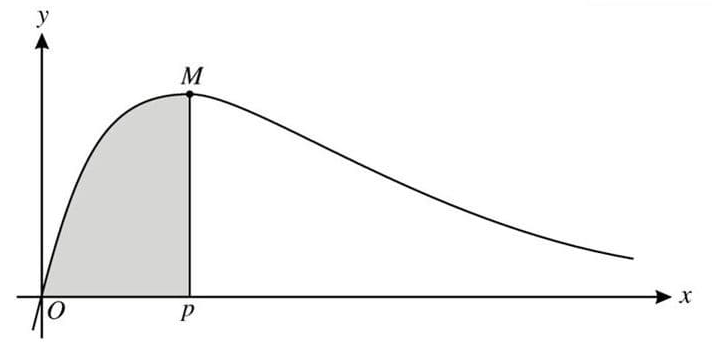
The diagram shows the curve \(y = e^{-x} - e^{-2x}\) and its maximum point \(M\). The \(x\)-coordinate of \(M\) is denoted by \(p\).
(i) Find the exact value of \(p\).
(ii) Show that the area of the shaded region bounded by the curve, the \(x\)-axis and the line \(x = p\) is equal to \(\frac{1}{8}\).
9709 P3 - Jun 2005 - Q9
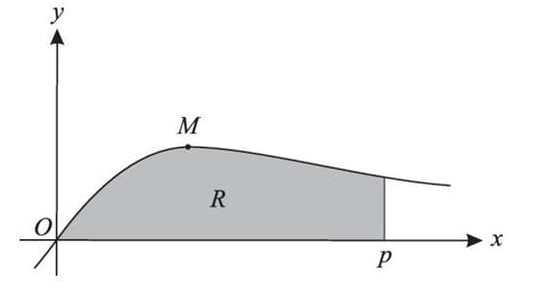
The diagram shows part of the curve \(y = \frac{x}{x^2 + 1}\) and its maximum point \(M\). The shaded region \(R\) is bounded by the curve and by the lines \(y = 0\) and \(x = p\).
- Calculate the \(x\)-coordinate of \(M\).
- Find the area of \(R\) in terms of \(p\).
- Hence calculate the value of \(p\) for which the area of \(R\) is 1, giving your answer correct to 3 significant figures.