Past Exam Questions
← Back0606 P11 - Nov 2023 - Q4 - 9 marks
The table shows values of variables \(x\) and \(y\), which are related by the equation \(y=Ax^b\), where \(A\) and \(b\) are constants.
| \(x\) | 1 | 2 | 3 | 4 | 5 |
|---|---|---|---|---|---|
| \(y\) | 20 | 57 | 104 | 160 | 224 |
(a) Use the data to draw a straight line graph of \(\ln y\) against \(\ln x\).
(b) Use your graph to estimate the values of \(A\) and \(b\). Give your answers correct to 2 significant figures.
(c) Use your graph to estimate the value of \(y\) when \(x=3.5\).
0606 P12 - Nov 2023 - Q3 - 5 marks
When \(\ln(y+2)\) is plotted against \(x^2\), a straight line graph is obtained. The line passes through the points \((2.25,9.37)\) and \((4.75,3.92)\).
Find \(y\) in terms of \(x\).
0606 P12 - Jun 2021 - Q8 - 9 marks
Variables \(x\) and \(y\) are connected by the equation
\(y=Ax^b.\)
The straight line obtained by plotting \(\lg y\) against \(\lg x\) passes through the points \((0.61,0.57)\) and \((5.36,4.37)\).
(a) Find the value of \(A\) and of \(b\).
(b) Find the value of \(y\) when \(x=3\).
(c) Find the value of \(x\) when \(y=3\).
0606 P13 - Jun 2021 - Q5 - 5 marks
When \(e^y\) is plotted against \(x^2\), a straight line graph passing through the points \((2.24,5)\) and \((4.74,10)\) is obtained.
Find \(y\) in terms of \(x\).
0606 P21 - Jun 2021 - Q2 - 4 marks
Variables \(x\) and \(y\) are such that, when \(\ln y\) is plotted against \(\ln x\), a straight line graph passing through the points \((6,5)\) and \((8,9)\) is obtained.
Show that
\(y=e^{-7}x^2.\)
0606 P13 - Nov 2021 - Q9 - 10 marks
When \(e^{2y}\) is plotted against \(x^2\), a straight line graph passing through the points \((4,7.96)\) and \((2,3.76)\) is obtained.
(a) Find \(y\) in terms of \(x\).
(b) Find \(y\) when \(x=1\).
(c) Using your equation from part (a), find the positive values of \(x\) for which the straight line exists.
0606 P22 - Nov 2021 - Q8 - 8 marks
Variables \(x\) and \(y\) are such that when \(\sqrt y\) is plotted against \(\log_2(x+1)\), where \(x\gt -1\), a straight line is obtained which passes through \((2,10.4)\) and \((4,15.4)\).
(a) Find \(\sqrt y\) in terms of \(\log_2(x+1)\).
(b) Find the value of \(y\) when \(x=15\).
(c) Find the value of \(x\) when \(y=25\).
0606 P22 - Mar 2020 - Q2 - 4 marks
When \(\lg y\) is plotted against \(x^3\), a straight line is obtained. The line passes through the points \((6,7)\) and \((10,9)\), where the horizontal coordinate is \(x^3\) and the vertical coordinate is \(\lg y\).
Find \(y\) as a function of \(x\).
0606 P21 - Jun 2020 - Q1 - 4 marks
Variables \(x\) and \(y\) are such that, when \(\sqrt[4]{y}\) is plotted against \(\dfrac1x\), a straight line graph passing through the points \((0.5,9)\) and \((3,34)\) is obtained.
Find \(y\) as a function of \(x\).
0606 P23 - Jun 2020 - Q7 - 8 marks
Variables \(x\) and \(y\) are connected by the relationship
\(y=Ax^n,\)
where \(A\) and \(n\) are constants.
(a) Transform the relationship \(y=Ax^n\) to straight line form.
When \(\ln y\) is plotted against \(\ln x\), a straight line graph passing through the points \((0,0.5)\) and \((3.2,1.7)\) is obtained.
(b) Find the value of \(n\) and of \(A\).
(c) Find the value of \(y\) when \(x=11\).
0606 P22 - Mar 2019 - Q6 - 8 marks
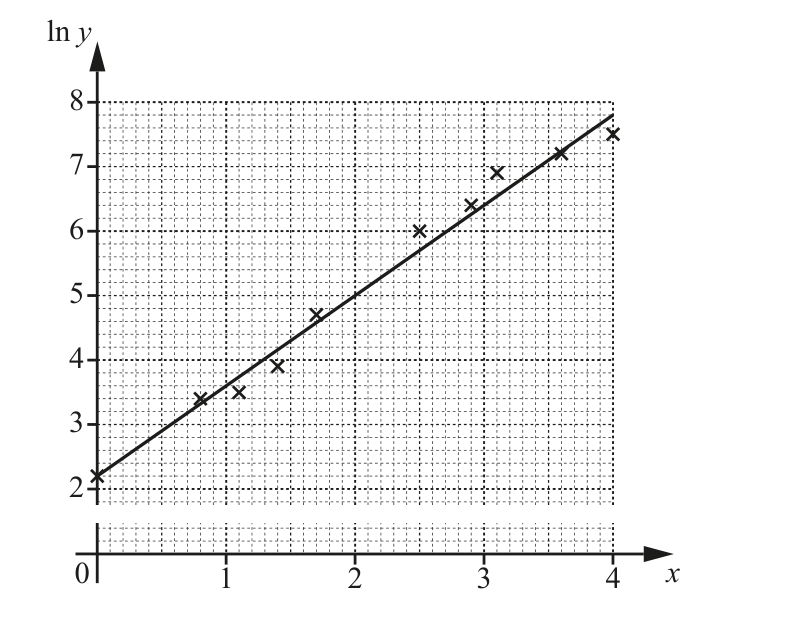
The relationship between experimental values of two variables, \(x\) and \(y\), is given by \(y=Ab^x\), where \(A\) and \(b\) are constants.
(i) Transform the relationship \(y=Ab^x\) into straight line form.
The diagram shows \(\ln y\) plotted against \(x\) for ten different pairs of values of \(x\) and \(y\). The line of best fit has been drawn.
(ii) Find the equation of the line of best fit and the value, correct to 1 significant figure, of \(A\) and of \(b\).
(iii) Find the value, correct to 1 significant figure, of \(y\) when \(x=2.7\).
0606 P11 - Jun 2019 - Q10 - 9 marks
When \(\lg y\) is plotted against \(x^2\), a straight line graph is obtained which passes through the points \((2,4)\) and \((6,16)\).
(i) Show that \(y=10^{A+Bx^2}\), where \(A\) and \(B\) are constants.
(ii) Find \(y\) when \(x=\frac1{\sqrt3}\).
(iii) Find the positive value of \(x\) when \(y=2\).
0606 P12 - Jun 2019 - Q8 - 9 marks
When \(e^y\) is plotted against \(\frac1x\), a straight line graph passing through the points \((2,20)\) and \((4,8)\) is obtained.
(i) Find \(y\) in terms of \(x\).
(ii) Hence find the positive values of \(x\) for which \(y\) is defined.
(iii) Find the exact value of \(y\) when \(x=3\).
(iv) Find the exact value of \(x\) when \(y=2\).
0606 P11 - Nov 2019 - Q7 - 7 marks
When \(\lg y\) is plotted against \(x\), a straight line graph passing through the points \((2.2,3.6)\) and \((3.4,6)\) is obtained.
(i) Given that \(y=Ab^x\), find the value of each of the constants \(A\) and \(b\).
(ii) Find \(x\) when \(y=900\).
0606 P12 - Nov 2019 - Q2 - 5 marks
When \(\lg y^2\) is plotted against \(x\), a straight line is obtained passing through the points \((5,12)\) and \((3,20)\). Find \(y\) in terms of \(x\), giving your answer in the form \(y=10^{ax+b}\), where \(a\) and \(b\) are integers.
0606 P13 - Nov 2019 - Q6 - 10 marks
The table shows values of the variables \(x\) and \(y\) such that \(y=Ab^{x^2}\), where \(A\) and \(b\) are constants.
| \(x\) | 1 | 1.5 | 2 | 2.5 | 3 |
|---|---|---|---|---|---|
| \(y\) | 6 | 14.3 | 48 | 228 | 1536 |
(i) Draw a straight line graph to show that \(y=Ab^{x^2}\).
(ii) Use your graph to find the value of \(A\) and of \(b\).
(iii) Estimate the value of \(x\) when \(y=100\).
0606 P12 - Mar 2018 - Q9 - 11 marks
Variables \(x\) and \(y\) are connected by the equation \(y=Ae^{bx}\), where \(A\) and \(b\) are constants. The table shows corresponding values of \(x\) and \(y\).
| \(x\) | 2 | 4 | 6 | 8 | 10 |
|---|---|---|---|---|---|
| \(y\) | 736 | 271 | 100 | 37 | 13 |
(i) Transform the equation \(y=Ae^{bx}\) into the equation of a straight line.
(ii) Use a suitable graph to show that \(x\) and \(y\) are connected by the equation \(y=Ae^{bx}\).
(iii) Use your graph to estimate the values of \(A\) and \(b\).
(iv) Estimate the value of \(x\) when \(y=500\).
(v) Estimate the value of \(y\) when \(x=5\).
0606 P12 - Jun 2018 - Q3 - 5 marks
The variables \(x\) and \(y\) are such that, when \(e^y\) is plotted against \(x^2\), a straight line graph passing through the points \((5,3)\) and \((3,1)\) is obtained. Find \(y\) in terms of \(x\).
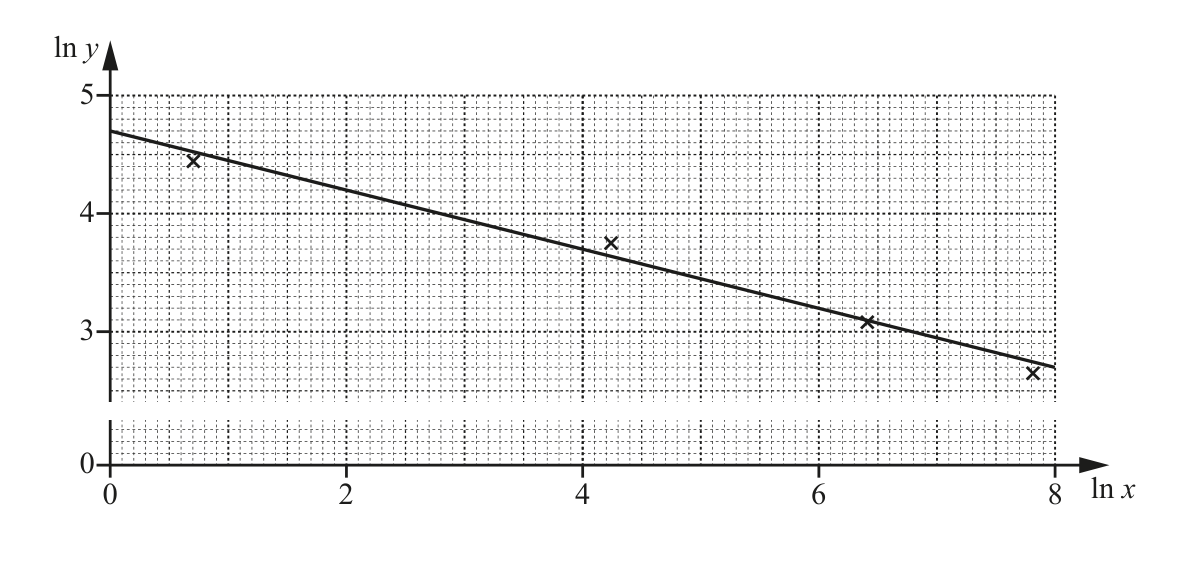
0606 P21 - Jun 2018 - Q8 - 7 marks
An experiment was carried out recording values of \(y\) for certain values of \(x\). The variables \(x\) and \(y\) are thought to be connected by the relationship
\(y=ax^n,\)
where \(a\) and \(n\) are constants.
(i) Transform the relationship \(y=ax^n\) into straight line form.
The values of \(\ln y\) and \(\ln x\) were plotted and a line of best fit drawn.
(ii) Use the graph to find the value of \(a\) and of \(n\), stating the coordinates of the points that you use.
(iii) Find the value of \(x\) when \(y=50\).
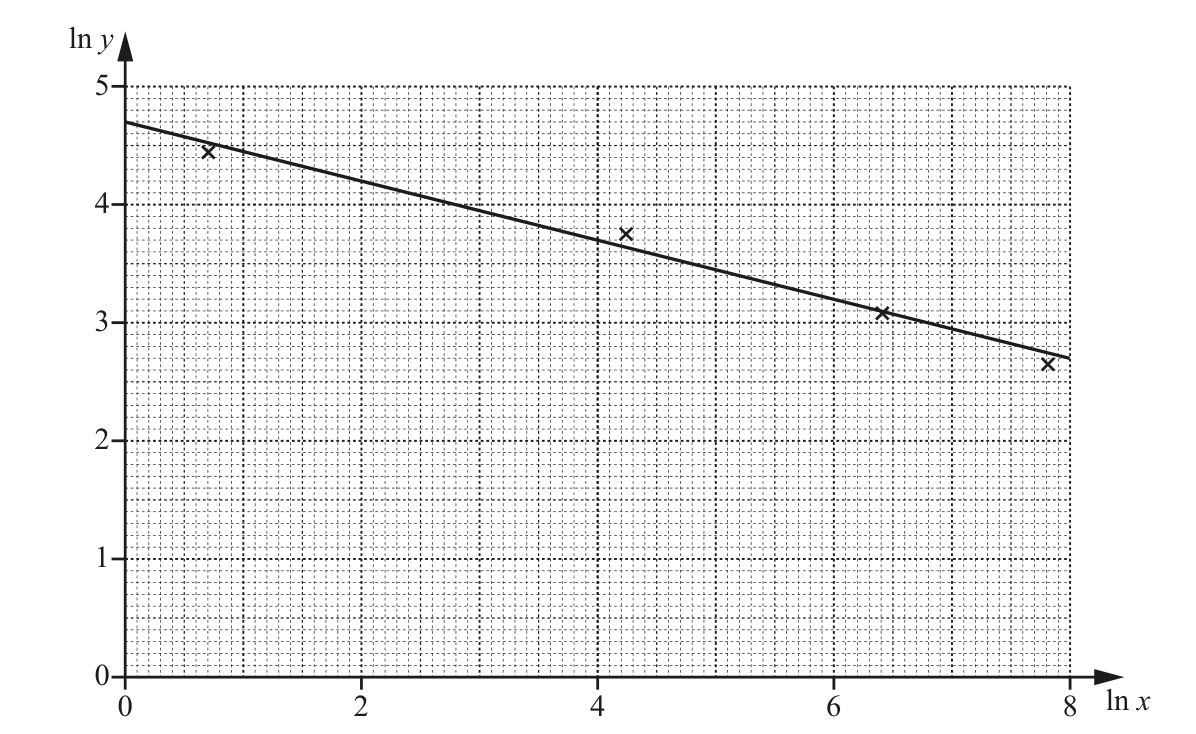
0606 P23 - Jun 2018 - Q8 - 7 marks
An experiment was carried out recording values of \(y\) for certain values of \(x\). The variables \(x\) and \(y\) are thought to be connected by the relationship
\(y=ax^n,\)
where \(a\) and \(n\) are constants.
(i) Transform the relationship \(y=ax^n\) into straight line form.
The values of \(\ln y\) and \(\ln x\) were plotted and a line of best fit drawn.
(ii) Use the graph to find the value of \(a\) and of \(n\), stating the coordinates of the points that you use.
(iii) Find the value of \(x\) when \(y=50\).