0606 P22 - Mar 2019 - Q6 - 8 marks
8246
The relationship between experimental values of two variables, \(x\) and \(y\), is given by \(y=Ab^x\), where \(A\) and \(b\) are constants.
(i) Transform the relationship \(y=Ab^x\) into straight line form.
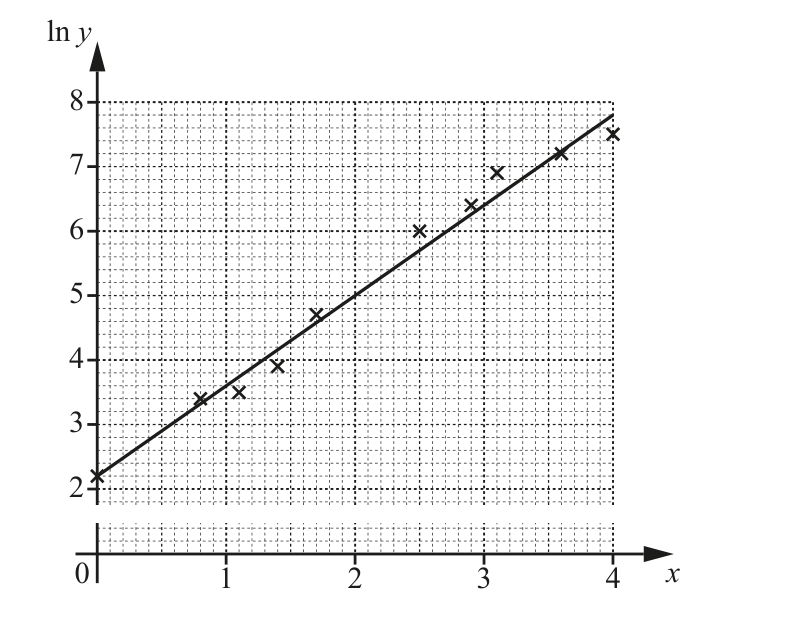
The diagram shows \(\ln y\) plotted against \(x\) for ten different pairs of values of \(x\) and \(y\). The line of best fit has been drawn.
(ii) Find the equation of the line of best fit and the value, correct to 1 significant figure, of \(A\) and of \(b\).
(iii) Find the value, correct to 1 significant figure, of \(y\) when \(x=2.7\).
Solutions locked. Please sign in with access to view them.