Past Exam Questions
← Back9709 P6 - Jun 2005 - Q2
The following table shows the results of a survey to find the average daily time, in minutes, that a group of schoolchildren spent in internet chat rooms.
| Time per day (t minutes) | Frequency |
|---|---|
| \(0 \leq t < 10\) | 2 |
| \(10 \leq t < 20\) | f |
| \(20 \leq t < 40\) | 11 |
| \(40 \leq t < 80\) | 4 |
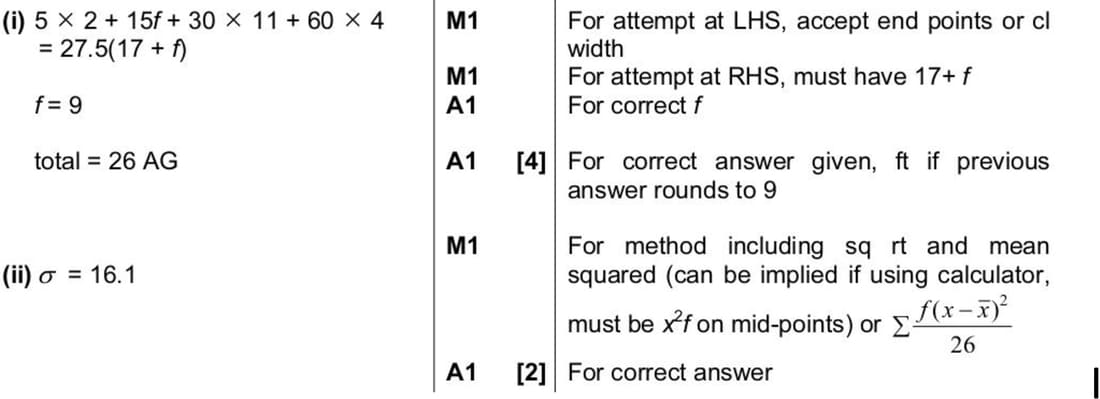
The mean time was calculated to be 27.5 minutes.
- Form an equation involving \(f\) and hence show that the total number of children in the survey was 26. [4]
- Find the standard deviation of these times. [2]
9709 P6 - Nov 2004 - Q4
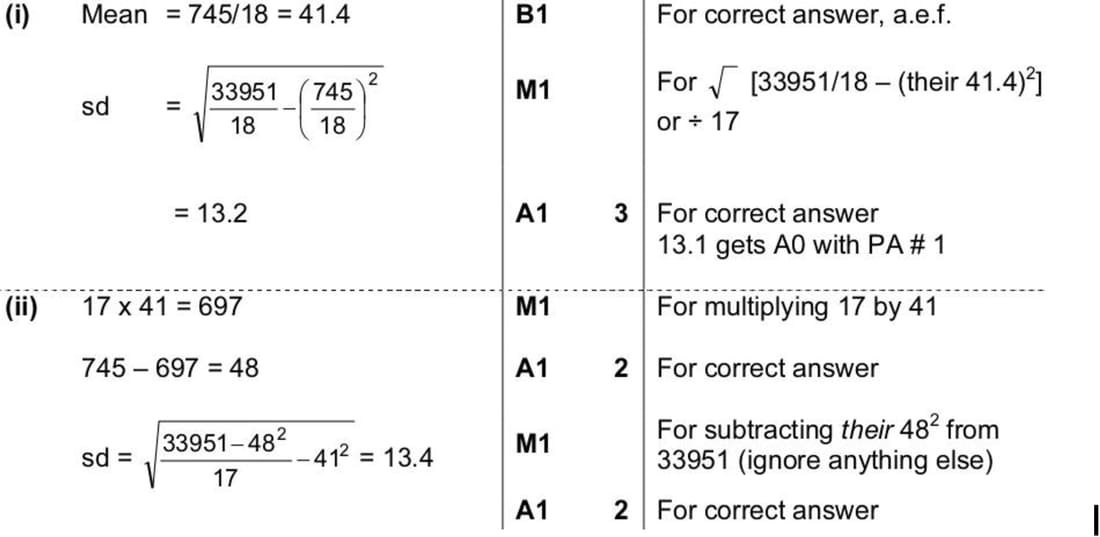
The ages, \(x\) years, of 18 people attending an evening class are summarised by the following totals: \(\Sigma x = 745, \Sigma x^2 = 33951\).
(i) Calculate the mean and standard deviation of the ages of this group of people. [3]
(ii) One person leaves the group and the mean age of the remaining 17 people is exactly 41 years. Find the age of the person who left and the standard deviation of the ages of the remaining 17 people. [4]
9709 P6 - Jun 2004 - Q1
Two cricket teams kept records of the number of runs scored by their teams in 8 matches. The scores are shown in the following table.
| Team A | 150 | 220 | 77 | 30 | 298 | 118 | 160 | 57 |
|---|---|---|---|---|---|---|---|---|
| Team B | 166 | 142 | 170 | 93 | 111 | 130 | 148 | 86 |
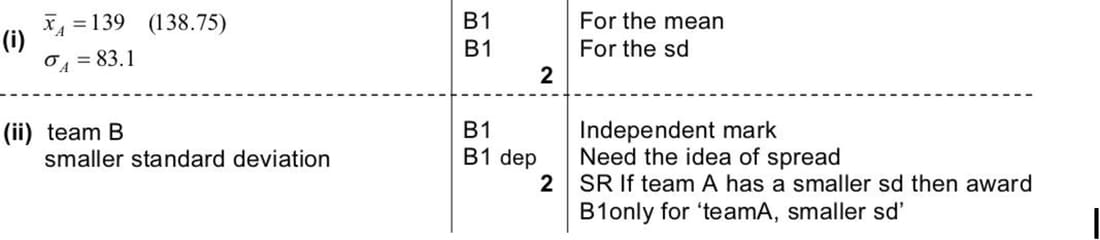
- Find the mean and standard deviation of the scores for team A. [2]
- State with a reason which team has the more consistent scores. [2]
The mean and standard deviation for team B are 130.75 and 29.63 respectively.
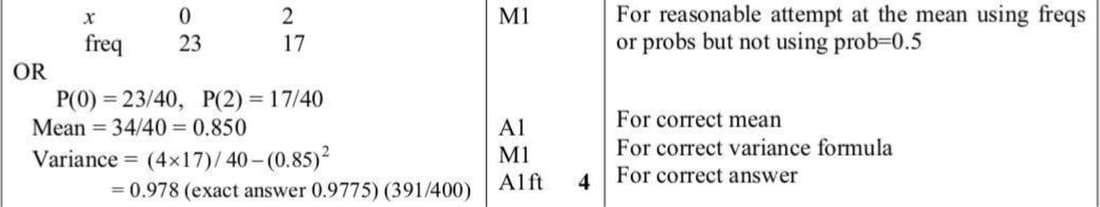
9709 P6 - Nov 2003 - Q1
A computer can generate random numbers which are either 0 or 2. On a particular occasion, it generates a set of numbers which consists of 23 zeros and 17 twos. Find the mean and variance of this set of 40 numbers.
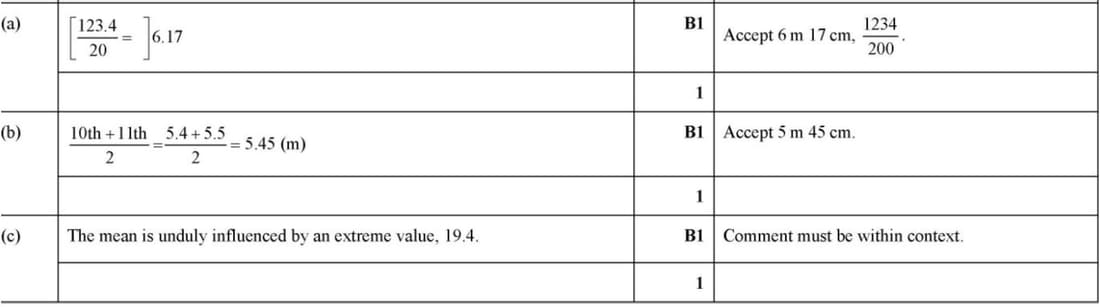
9709 P53 - Jun 2022 - Q2
Twenty children were asked to estimate the height of a particular tree. Their estimates, in metres, were as follows.
4.1, 4.2, 4.4, 4.5, 4.6, 4.8, 5.0, 5.2, 5.3, 5.4, 5.5, 5.8, 6.0, 6.2, 6.3, 6.4, 6.6, 6.8, 6.9, 19.4
(a) Find the mean of the estimated heights.
(b) Find the median of the estimated heights.
(c) Give a reason why the median is likely to be more suitable than the mean as a measure of the central tendency for this information.
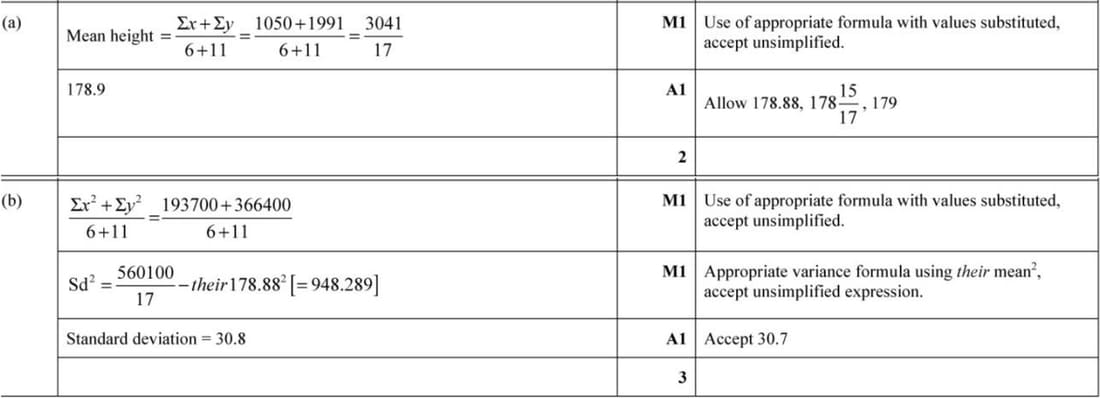
9709 P53 - Jun 2021 - Q3
A sports club has a volleyball team and a hockey team. The heights of the 6 members of the volleyball team are summarised by \(\Sigma x = 1050\) and \(\Sigma x^2 = 193700\), where \(x\) is the height of a member in cm. The heights of the 11 members of the hockey team are summarised by \(\Sigma y = 1991\) and \(\Sigma y^2 = 366400\), where \(y\) is the height of a member in cm.
(a) Find the mean height of all 17 members of the club.
(b) Find the standard deviation of the heights of all 17 members of the club.
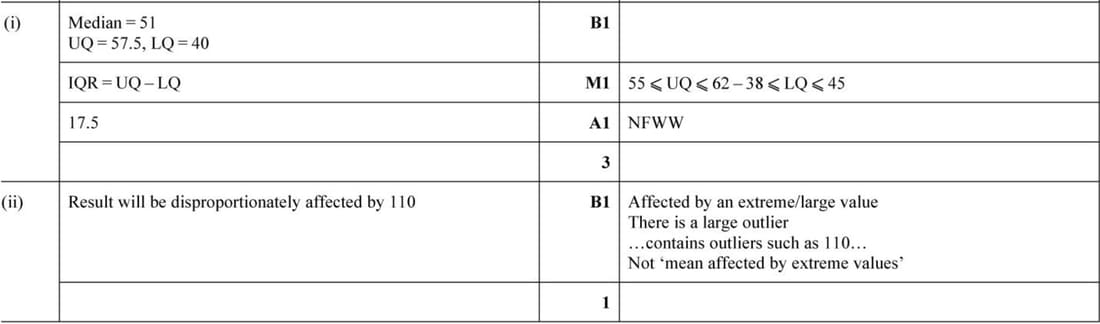
9709 P62 - Nov 2019 - Q1
Twelve tourists were asked to estimate the height, in metres, of a new building. Their estimates were as follows.
50, 45, 62, 30, 40, 55, 110, 38, 52, 60, 55, 40
- Find the median and the interquartile range for the data.
- Give a disadvantage of using the mean as a measure of the central tendency in this case.
9709 P61 - Nov 2019 - Q3
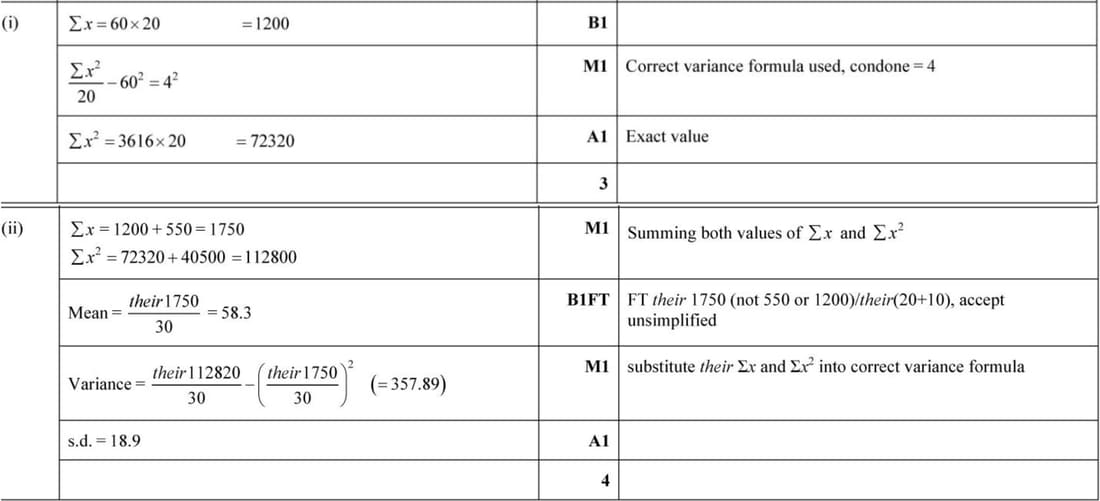
The mean and standard deviation of 20 values of \(x\) are 60 and 4 respectively.
- Find the values of \(\Sigma x\) and \(\Sigma x^2\).
Another 10 values of \(x\) are such that their sum is 550 and the sum of their squares is 40 500.
- Find the mean and standard deviation of all these 30 values of \(x\).
9709 P62 - Jun 2019 - Q6
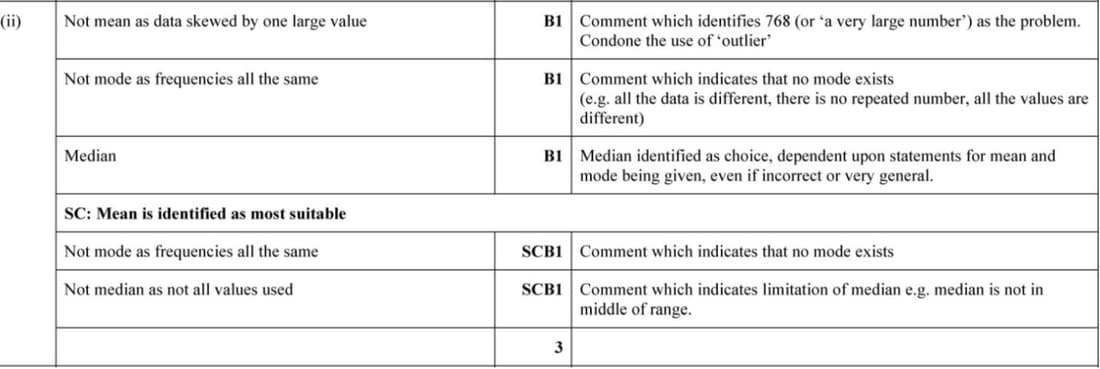
The times in minutes taken to run a marathon were recorded for a group of 13 marathon runners and were found to be as follows.
180, 275, 235, 242, 311, 194, 246, 229, 238, 768, 332, 227, 228
State which of the mean, mode or median is most suitable as a measure of central tendency for these times. Explain why the other measures are less suitable.
9709 P63 - Nov 2018 - Q7
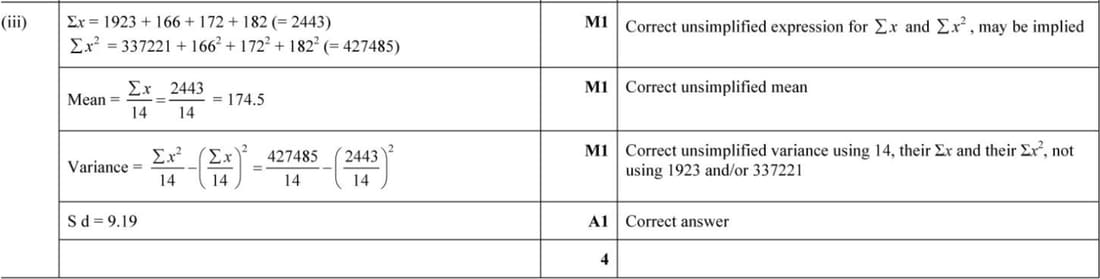
The heights of the 11 members of the Anvils are denoted by \(x\) cm. It is given that \(\Sigma x = 1923\) and \(\Sigma x^2 = 337221\). The Anvils are joined by 3 new members whose heights are 166 cm, 172 cm and 182 cm. Find the standard deviation of the heights of all 14 members of the Anvils.
9709 P32 - Nov 2023 - Q1
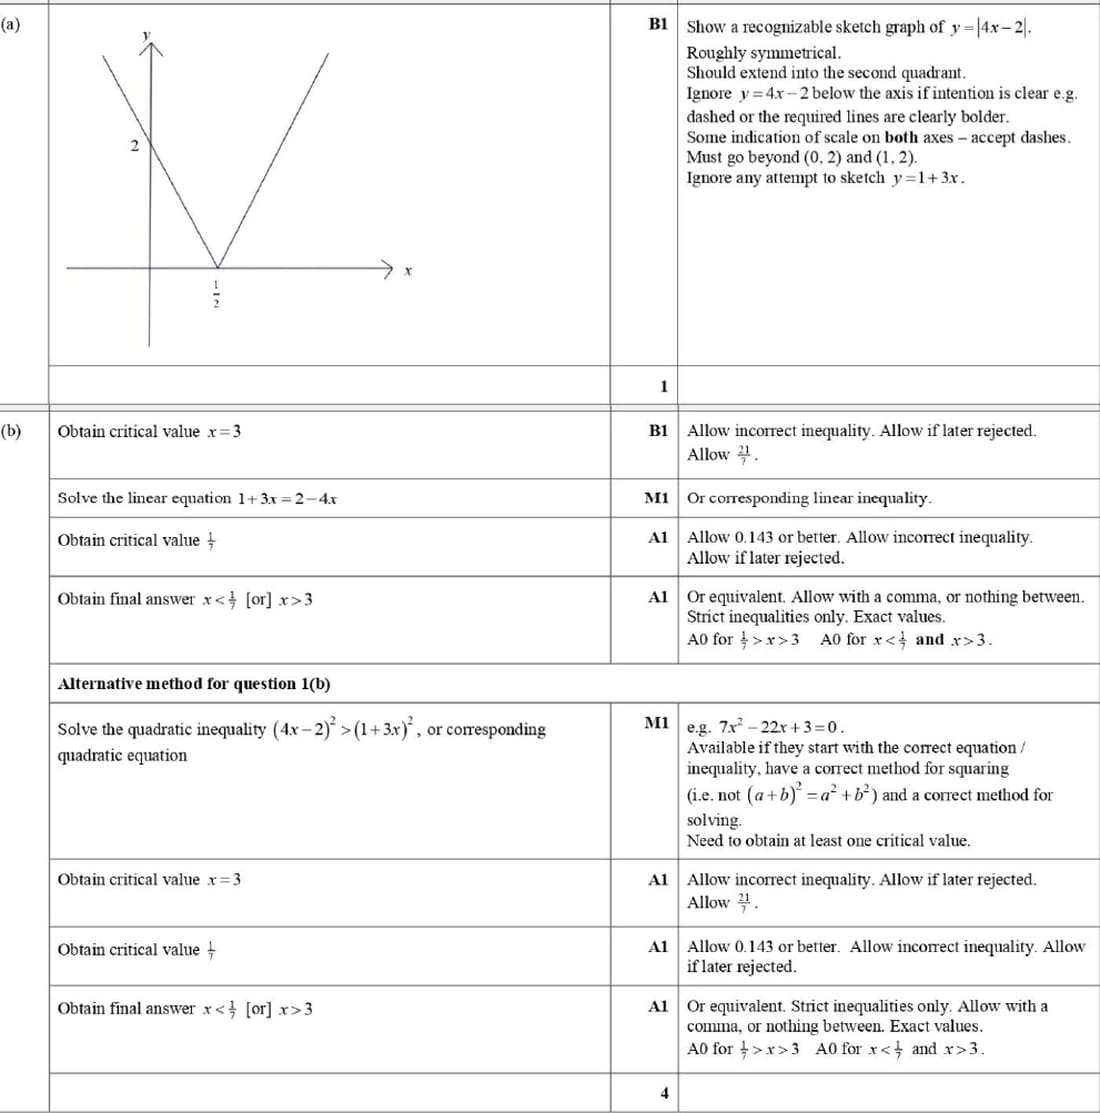
(a) Sketch the graph of \(y = |4x - 2|\).
(b) Solve the inequality \(1 + 3x < |4x - 2|\).
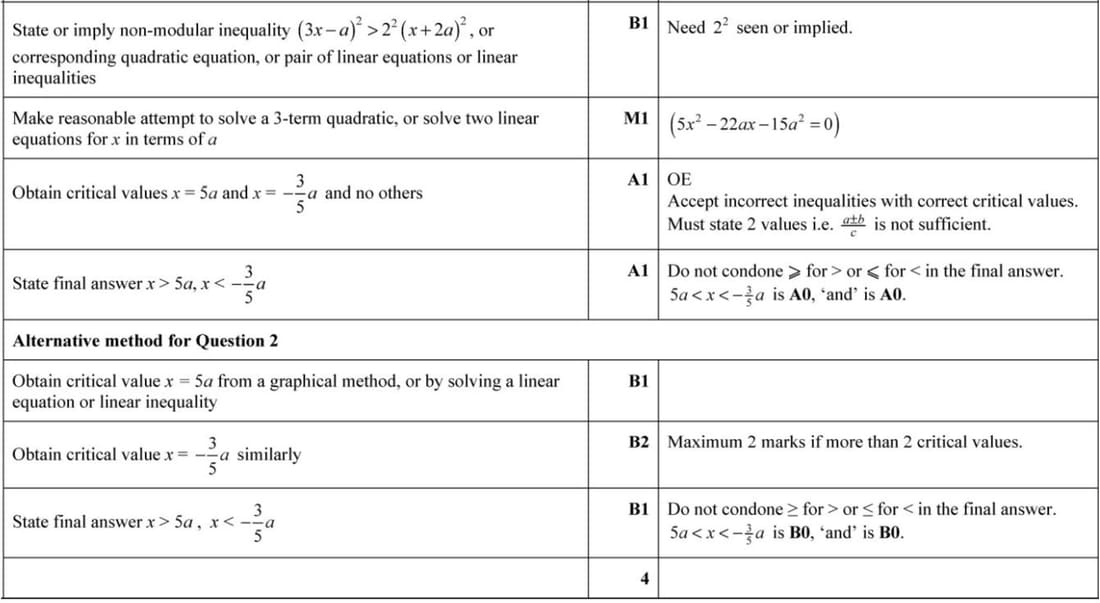
9709 P32 - Nov 2021 - Q2
Solve the inequality: \(|3x - a| > 2|x + 2a|\), where \(a\) is a positive constant.
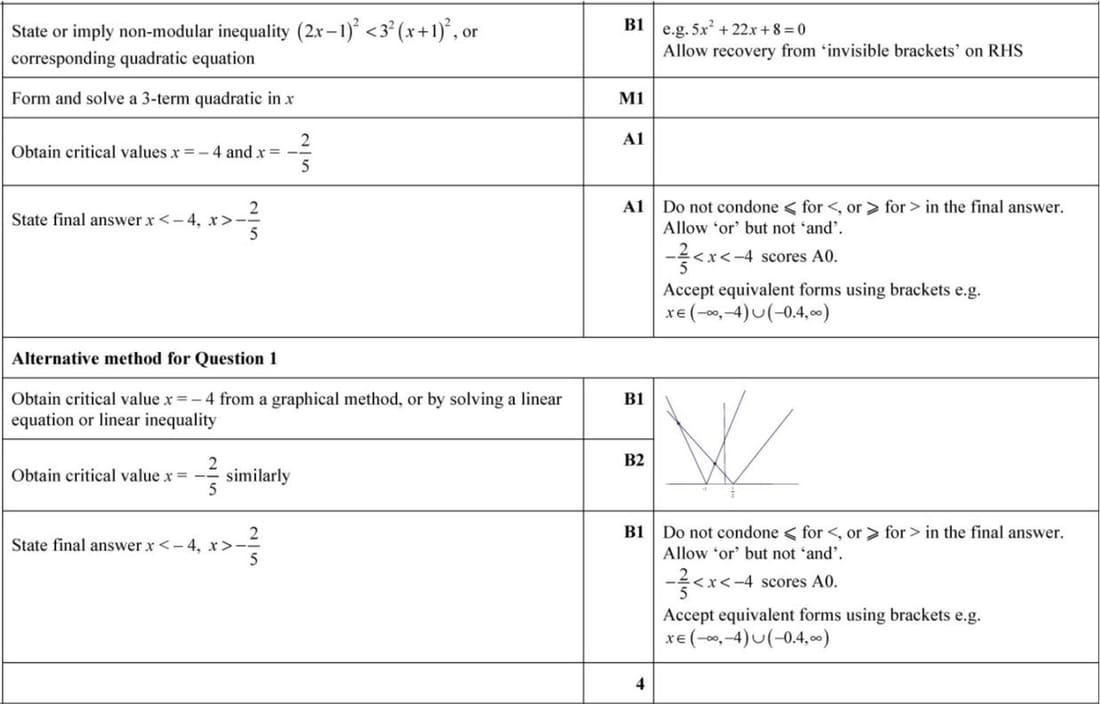
9709 P32 - Jun 2021 - Q1
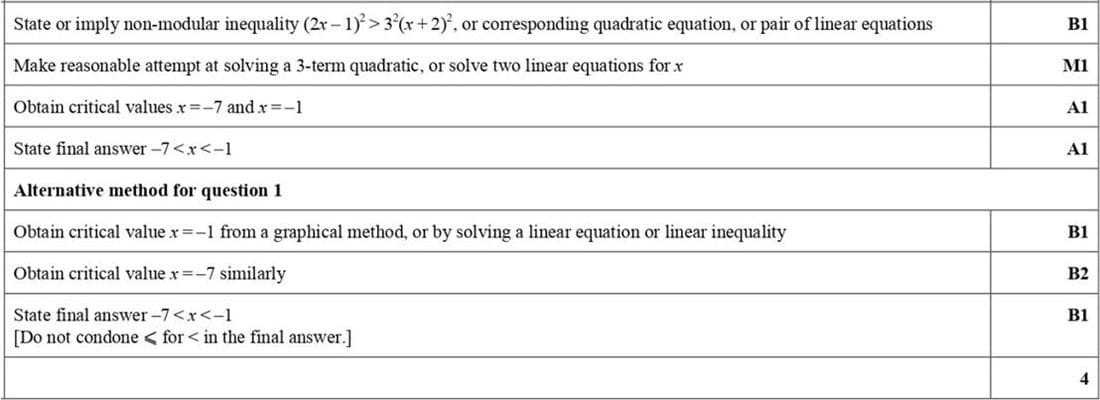
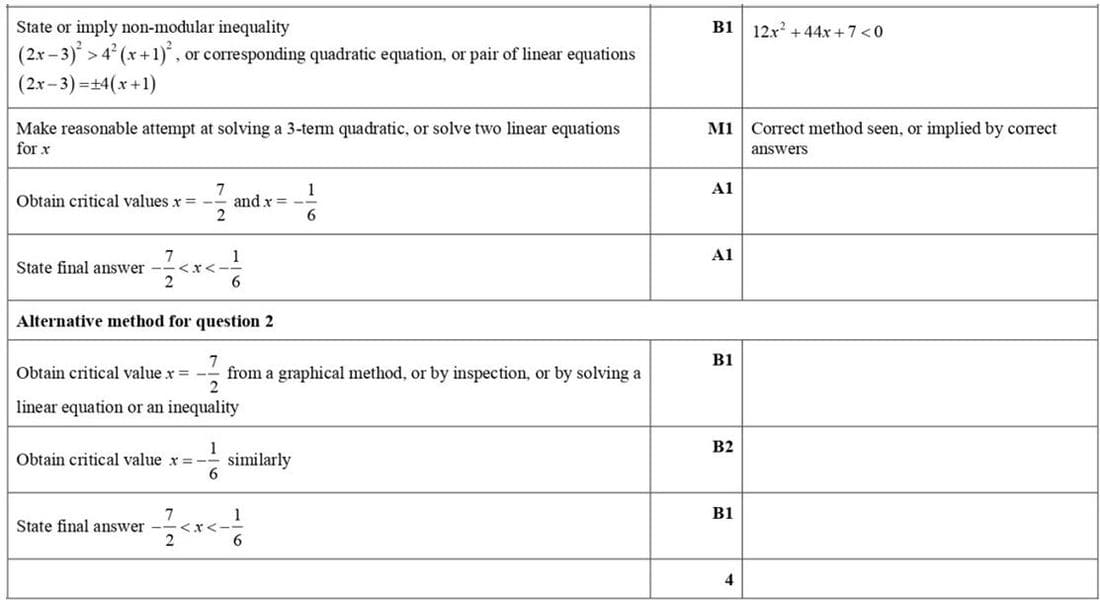
Solve the inequality: \(|2x - 1| < 3|x + 1|\)
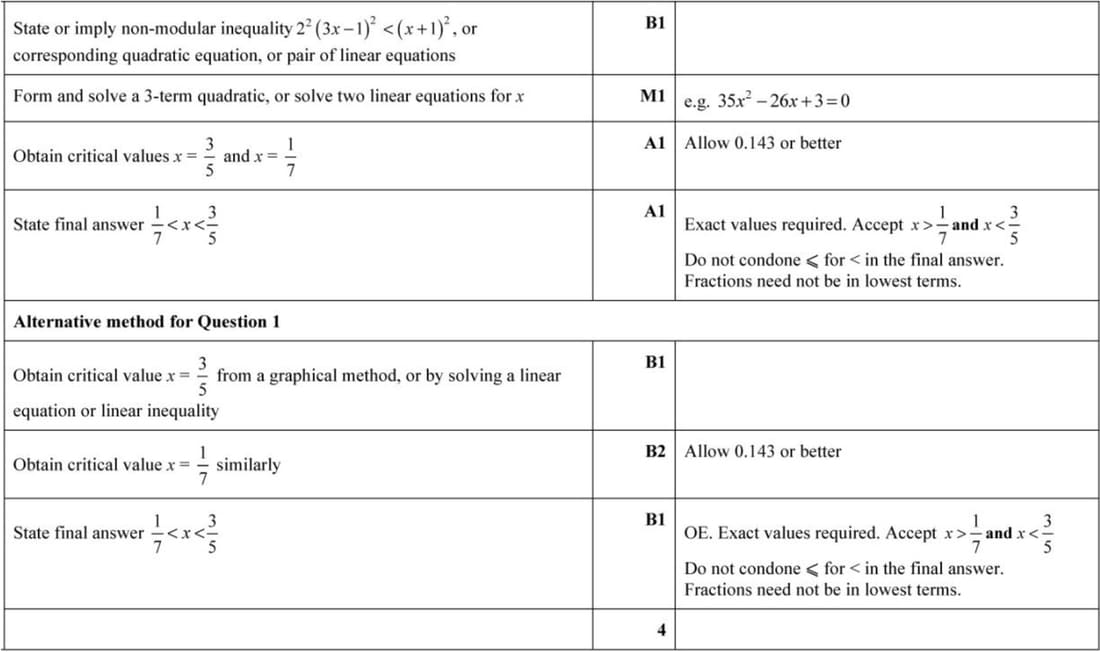
9709 P31 - Jun 2021 - Q1
Solve the inequality: \(2|3x - 1| < |x + 1|\)
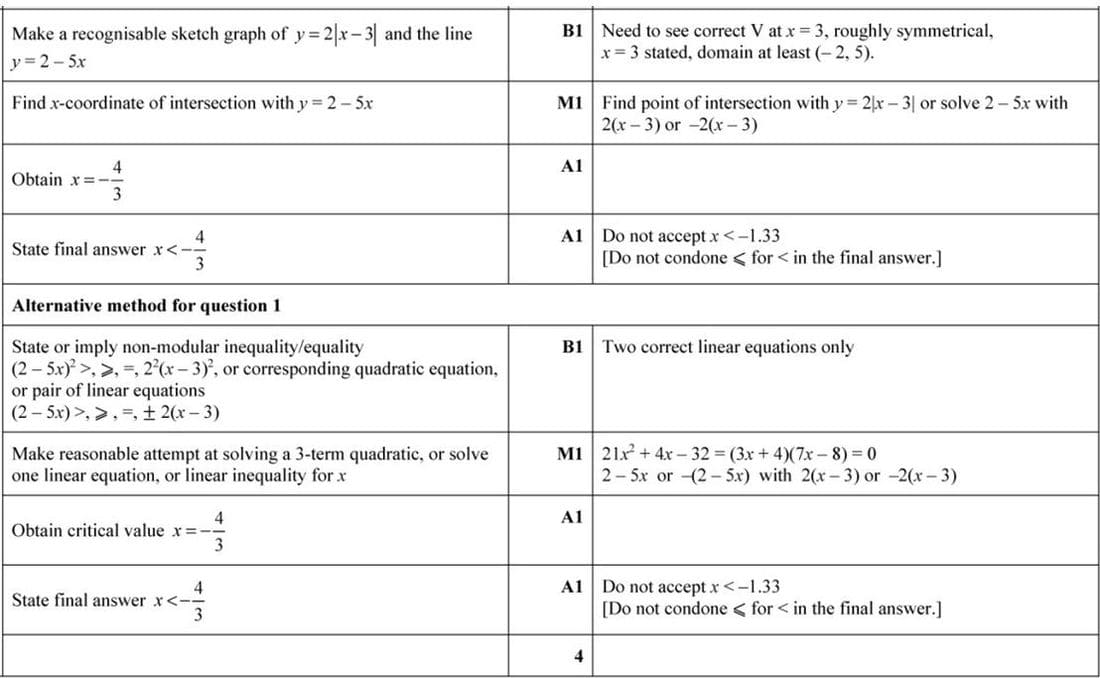
9709 P31 - Nov 2020 - Q1
Solve the inequality: \(2 - 5x > 2|x - 3|\)
9709 P33 - Jun 2020 - Q1
Solve the inequality: \(|2x - 1| > 3|x + 2|\)
9709 P22 - Mar 2023 - Q1
Solve the inequality: \(|x - 2| < 3x - 4\)

9709 P12 - Jun 2023 - Q3
Sketch the graph of \(y = |x - 2|\).
9709 P31 - Nov 2019 - Q2
Solve the inequality: \(|2x - 3| > 4|x + 1|\)
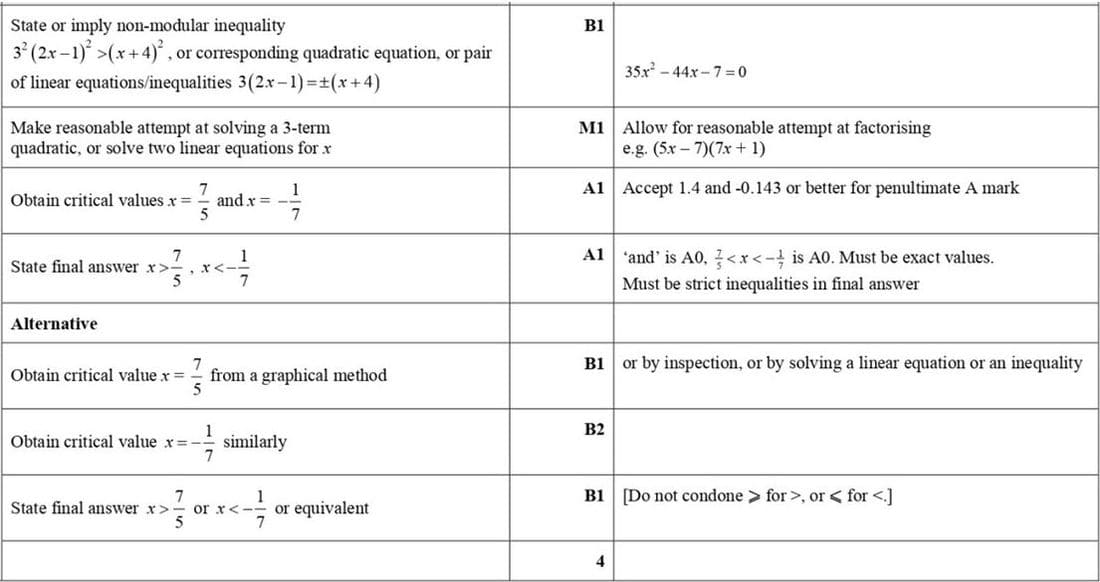
9709 P32 - Nov 2018 - Q1
Solve the inequality: \(3|2x - 1| > |x + 4|\)