Use a sample mean to assess evidence about a population claim and state a careful conclusion.
By the end of this lesson
- Write null and alternative hypotheses about a population mean.
- Choose one or two tails from the research question.
- Carry out exact known-variance and suitable approximate normal mean tests.
- Interpret significance, critical regions and conclusions correctly.
Before you begin: Calculate the standard error of a sample mean.; Use normal probabilities and standard normal critical values.; Distinguish population parameters from sample estimates..
1. Compare the observation with a population claim
A hypothesis test starts with a claim about a population parameter. We temporarily assume that claim is true, then ask whether the observed sample result would be unusually extreme under that assumption. An extreme result gives evidence against the claim; an ordinary result provides insufficient evidence to reject it.
The null hypothesis, $H_0$, supplies the reference value. For a population mean we write $H_0:\mu=\mu_0$, where $\mu_0$ is the claimed value. The alternative hypothesis, $H_1$, describes the departure being investigated. Hypotheses concern $\mu$, not the observed sample mean $\bar{x}$: the sample mean is evidence about the population.
2. Significance levels and critical regions
The critical region is the set of sufficiently extreme statistic values for which we reject $H_0$. A significance level of $5\%$ assigns total probability $0.05$ to this region under the null model. For an approximate test, this probability is approximately $0.05$. It is not the probability that $H_0$ is true.
| Alternative | Tail or tails | 5% normal critical region |
|---|---|---|
| $H_1:\mu>\mu_0$ | Upper | $z>1.645$ |
| $H_1:\mu<\mu_0$ | Lower | $z<-1.645$ |
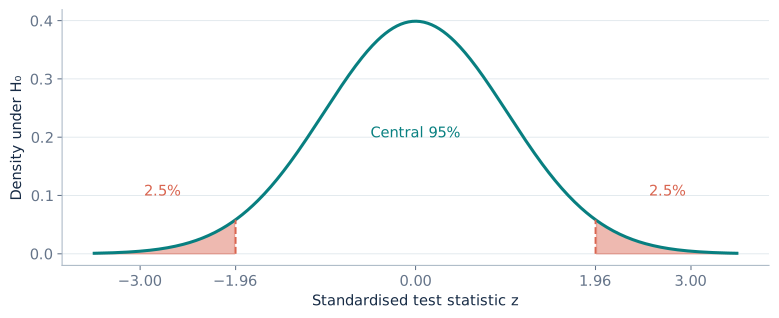
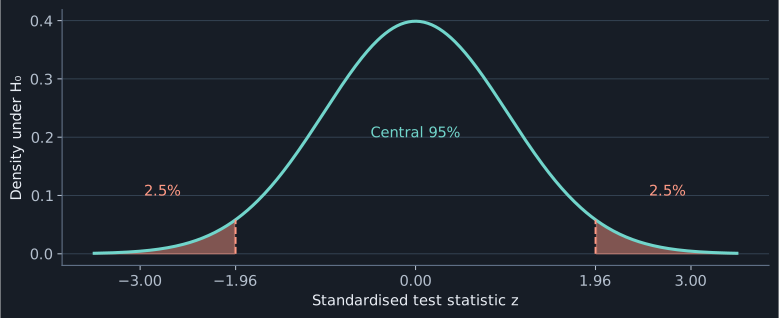
| $H_1:\mu\ne\mu_0$ | Two | $z<-1.96$ or $z>1.96$ |
A two-tailed test looks for a departure in either direction. Split the significance level equally: at $5\%$, each tail contains $2.5\%$. The displayed cutoffs are rounded standard normal quantiles; an equality convention does not affect probabilities in a continuous model.
3. Standardise the sample mean under the null
Key formula
Known population standard deviation
$Z$ is the random statistic before sampling; $z$ is its observed value. Under $H_0$, $Z\sim N(0,1)$ for an independent random sample from a normal population with known $\sigma$.
The denominator is the standard error of the sample mean, not the standard deviation of individual observations. A suitable large sample from a non-normal population with finite variance can justify an approximate normal test through the central limit theorem. There is no universal sample-size threshold that makes this approximation reliable.
- Check random sampling and independent observations.
- Identify whether the population standard deviation is known or estimated.
- State whether normality of the test statistic is exact or an approximation.
4. Worked tests with known variance
Worked example
Is a filling machine underfilling?
Bag masses are normal with known standard deviation $8$ g. An independent random sample of $25$ bags has mean $496.8$ g. Test at $5\%$ whether the population mean is less than $500$ g.
Define $\mu$ as the population mean bag mass and choose a lower-tailed alternative.
\[H_0:\mu=500,\qquad H_1:\mu<500\]Calculate the standard error and observed statistic.
\[\operatorname{SE}=\frac8{\sqrt{25}}=1.6,\qquad z=\frac{496.8-500}{1.6}=-2\]The critical region is $z<-1.645$. Since $-2<-1.645$, reject $H_0$.
Worked example
Has a mean fill volume changed?
Bottle volumes are normal with known standard deviation $12$ ml. An independent random sample of $36$ bottles has mean $254$ ml. Test at $5\%$ whether the population mean differs from $250$ ml.
A change in either direction requires two tails.
\[H_0:\mu=250,\qquad H_1:\mu\ne250\]Calculate the statistic using the standard error.
\[\operatorname{SE}=\frac{12}{\sqrt{36}}=2,\qquad z=\frac{254-250}{2}=2\]At $5\%$, reject for $|z|>1.96$. Here $2>1.96$.
5. A suitable large sample with unknown variance
When the population variance is unknown, estimate it using $s^2$ with denominator $n-1$. For a suitable large sample, replacing $\sigma$ by $s$ gives an approximate normal test. This is not an exact known-variance test. Small normal samples with unknown variance require the t methods taught in Further Statistics.
Key formula
Approximate statistic using an estimated standard error
Use an independent random sample and a justified large-sample normal approximation. The sample standard deviation $s$ estimates $\sigma$.
Worked example
A large sample of item masses
An independent random sample of $100$ items gives $\bar{x}=51.8$ g and $s=10$ g. A large-sample normal approximation is suitable. Test at $5\%$ whether the population mean exceeds $50$ g.
State an upper-tailed alternative.
\[H_0:\mu=50,\qquad H_1:\mu>50\]Estimate the standard error.
\[\widehat{\operatorname{SE}}=\frac{10}{\sqrt{100}}=1,\qquad z_{\mathrm{approx}}=\frac{51.8-50}{1}=1.8\]Since $1.8>1.645$, the result falls in the approximate upper-tailed $5\%$ critical region.
6. What the conclusion does and does not say
If the statistic is in the critical region, reject $H_0$ and state the evidence for $H_1$ in context. Otherwise, do not reject $H_0$: there is insufficient evidence for the proposed departure at that significance level. A non-significant result does not prove that the null value is correct.
In the bottle example, an observed mean of $253$ ml would give $z=(253-250)/2=1.5$. This lies outside the two-tailed critical region. The conclusion would be insufficient evidence that the population mean differs from $250$ ml, even though the sample mean itself differs from $250$.
7. Optional: expressing the evidence with a p-value
A p-value is the probability, assuming $H_0$ and the model assumptions, of a statistic at least as extreme as the observed value in the direction or directions specified by $H_1$. Reject when the p-value is at most the significance level.
Key formula
Normal p-values
Here $\Phi(a)=\operatorname{P}(Z\le a)$ for $Z\sim N(0,1)$. These formulas use standard normal symmetry.
For the bottle test, $p=2\operatorname{P}(Z>2)\approx0.0455<0.05$, agreeing with the critical-region decision. The p-value is not the probability that the null hypothesis is true.
Practice
Try each question before opening its worked solution.
Question 1
Measurements are normal with known $\sigma=15$. An independent random sample of $36$ gives $\bar{x}=125$. Test at $1\%$ whether the population mean exceeds $120$. Use the upper-tail critical value $2.326$.
Show worked solution
State the hypotheses and calculate the standard error.
\[H_0:\mu=120,\quad H_1:\mu>120,\qquad \operatorname{SE}=15/\sqrt{36}=2.5\]Calculate and compare the statistic.
\[z=\frac{125-120}{2.5}=2<2.326\]
Question 2
Measurements are normal with known $\sigma=6$. An independent random sample of $16$ gives $\bar{x}=36.7$. Test at $5\%$ whether the population mean differs from $40$.
Show worked solution
A difference requires two tails.
\[H_0:\mu=40,\qquad H_1:\mu\ne40\]Calculate the statistic.
\[\operatorname{SE}=6/\sqrt{16}=1.5,\qquad z=\frac{36.7-40}{1.5}=-2.2\]Since $-2.2<-1.96$, the result is in the critical region.
Question 3
For a normal population with known $\sigma=10$, take an independent random sample of $25$. Express the $5\%$ critical region for testing $H_0:\mu=100$ against $H_1:\mu>100$ in terms of the observed mean $\bar{x}$.
Show worked solution
The standard error is two, and the test is upper-tailed.
\[\frac{\bar{x}-100}{2}>1.645\]Rearrange the inequality.
\[\bar{x}>100+2(1.645)=103.29\]
Question 4
An independent random sample of $64$ gives $\bar{x}=19.4$ and $s=4$. A large-sample normal approximation is suitable. Test at $5\%$ whether the population mean is below $20$.
Show worked solution
State the hypotheses and estimate the standard error.
\[H_0:\mu=20,\quad H_1:\mu<20,\qquad \widehat{\operatorname{SE}}=4/\sqrt{64}=0.5\]Compare the approximate statistic with the lower-tail threshold.
\[z_{\mathrm{approx}}=\frac{19.4-20}{0.5}=-1.2>-1.645\]
Estimate a population mean with an interval that expresses sampling uncertainty.