Describe a dataset accurately and prepare the notation needed for probability distributions and estimation.
By the end of this lesson
- Calculate and interpret a mean, median, variance and standard deviation.
- Use raw values, frequency tables and summary totals.
- Track the effect of coding and distinguish description from estimation.
Before you begin: Arithmetic with fractions, squares and square roots; Substitution into a formula.
1. What does a summary describe?
A dataset contains observations of a variable, such as journey time, height or the number of books borrowed. Record the unit and the number of observations, $n$. Before calculating, ask what one observation represents. A summary is useful only when its meaning remains attached to the numbers.
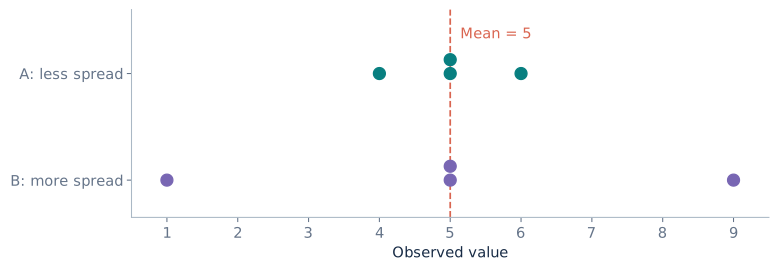
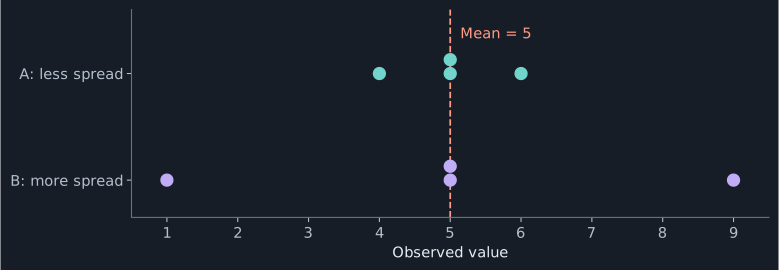
A measure of location describes where the data are centred. A measure of spread describes how much the observations differ. Two groups can have the same mean but very different consistency. Neither a mean alone nor a spread alone gives the whole description.
2. Mean and median
The notation $\sum x$ means the sum of all observed values. The arithmetic mean, written $\bar{x}$, shares that total equally between the $n$ observations. It uses every value, so a single unusually large value can move it substantially.
Key formula
Arithmetic mean
For $n>0$ observations. The mean has the same unit as the data.
To find the median, put the observations in ascending order. For odd $n$, select the value at position $(n+1)/2$. For even $n$, average the values at positions $n/2$ and $n/2+1$. The median identifies the middle of the ordered data and is less affected by an extreme value.
Worked example
Journey times
Six journey times are $12,14,15,15,17,23$ minutes. Find the mean and median.
Add all six times, then divide by six.
\[\sum x=96,\qquad \bar{x}=\frac{96}{6}=16\]The data are already ordered. Average the third and fourth values.
\[\text{Median}=\frac{15+15}{2}=15\]
3. Variance and standard deviation
A deviation is an observation minus the mean. Positive and negative deviations cancel when added, so their sum cannot measure spread. Squaring makes every contribution nonnegative and gives larger deviations more influence.
Key formula
Descriptive variance
Here $v$ describes these $n$ observations. It is not yet an unbiased estimate of a population variance.
Key formula
Standard deviation
Variance has squared units. Standard deviation returns to the original unit.
For the values $2,4,4,6$, the mean is $4$. Their squared deviations are $4,0,0,4$, so $v=8/4=2$ and the standard deviation is $\sqrt{2}\approx1.41$. A variance of zero means every observation has the same value.
4. Frequencies and summary totals
A frequency $f$ tells you how many times a value occurs. Multiply each value by its frequency when calculating the total. For the square total, use $fx^2$: square the observation, then multiply by its frequency.
Key formula
Frequency-table calculations
The number of observations is $n=\sum f$, not the number of distinct values.
Worked example
Books borrowed
The values $x=0,1,2,3$ have frequencies $f=1,3,4,2$. Find the mean and standard deviation.
Build the two weighted totals.
\[\sum f=10,\quad\sum fx=17,\quad\sum fx^2=37\]Apply the mean and variance formulas.
\[\bar{x}=\frac{17}{10}=1.7,\qquad v=\frac{37}{10}-1.7^2=0.81\]Take the square root.
\[\mathrm{SD}=\sqrt{0.81}=0.9\]
Worked example
Only the totals are known
Eight measurements have $\sum x=120$ and $\sum x^2=1848$. Find their mean and standard deviation.
The mean needs only the total and the number of observations.
\[\bar{x}=\frac{120}{8}=15\]Use the square total to calculate variance.
\[v=\frac{1848}{8}-15^2=231-225=6\]Return to the measurement unit.
\[\mathrm{SD}=\sqrt{6}\approx2.45\]
5. Combining and coding data
To combine groups, add their totals and their sizes. A group of four observations with mean $10$ contributes $40$ to the total. A group of six with mean $15$ contributes $90$. Their combined mean is $(40+90)/(4+6)=13$. Simply averaging the two means would give equal weight to unequal groups.
Coding replaces inconvenient values with simpler ones. If $x=a+by$, the shift $a$ changes location and the scale factor $b$ changes spread. A negative scale reverses the order of values, but variance and standard deviation remain nonnegative.
Key formula
Undoing a linear code
The same transformation must apply to every observation.
For example, if $y=x-50$, $n=5$, $\sum y=10$ and $\sum y^2=30$, then $\bar{y}=2$ and $v_y=6-4=2$. Adding $50$ back gives $\bar{x}=52$, while $v_x=2$. A shift leaves all distances from the mean unchanged.
6. Description and estimation use different denominators
This topic describes the observations you have, using division by $n$. Later, a random sample will help estimate the variance of a larger population. For independent observations from the same population with finite variance, the usual unbiased variance estimate uses $n-1$, where $n>1$.
Key formula
Unbiased variance estimate
Use this when estimating population variance, as requested in sampling and estimation. Do not switch denominators without checking the purpose.
The observed mean $\bar{x}$ is a number calculated from data. In later topics, $\bar{X}$ will denote the random sample mean before the observations are collected. Keeping this distinction clear helps connect descriptive calculations to inference.
Practice
Try each question before opening its worked solution.
Question 1
For $3,5,7,9$, find the mean, median, descriptive variance and standard deviation.
Show worked solution
Calculate the total and identify the middle two values.
\[\bar{x}=\frac{24}{4}=6,\qquad\text{Median}=\frac{5+7}{2}=6\]Square each observation and add.
\[\sum x^2=9+25+49+81=164\]Calculate variance, then take its square root.
\[v=\frac{164}{4}-6^2=5,\qquad\mathrm{SD}=\sqrt{5}\approx2.24\]
Question 2
Ten observations have $\sum x=80$ and $\sum x^2=670$. Find their mean and descriptive variance.
Show worked solution
Use the total to find the mean.
\[\bar{x}=\frac{80}{10}=8\]Subtract the square of the mean from the mean square.
\[v=\frac{670}{10}-8^2=67-64=3\]
Question 3
Values $0,1,2$ have frequencies $2,4,4$. Find the mean and standard deviation.
Show worked solution
Use frequencies as weights.
\[\sum f=10,\quad\sum fx=12,\quad\sum fx^2=20\]Find the mean and descriptive variance.
\[\bar{x}=1.2,\qquad v=\frac{20}{10}-1.2^2=0.56\]Take the square root.
\[\mathrm{SD}=\sqrt{0.56}\approx0.748\]
Question 4
Five values are coded using $y=(x-50)/2$. Given $\sum y=10$ and $\sum y^2=30$, find the mean and descriptive variance of $x$.
Show worked solution
Calculate summaries of the coded values.
\[\bar{y}=\frac{10}{5}=2,\qquad v_y=\frac{30}{5}-2^2=2\]Rewrite the code as $x=50+2y$, then undo the shift and scale.
\[\bar{x}=50+2(2)=54,\qquad v_x=2^2(2)=8\]
Probability supplies the weights that replace observed frequencies in a random-variable model.