Probabillity and Statistics – Pie Chart
Pie Charts
A pie chart shows data as parts of a full circle. The full circle represents the whole amount, so the total angle is
To draw a pie chart, first find the total frequency, then work out each fraction or proportion, then convert each part into an angle.
Key facts and formulae
1. Find the total frequency
Add all the frequencies together.
2. Find the proportion or fraction
For each category,
3. Find the angle
Multiply the proportion by \(360^\circ\).
4. Check
In a correct pie chart:
Worked example
The table shows the favourite fruits of some students.
| Apple | Orange | Banana | Pear | Total | |
|---|---|---|---|---|---|
| Frequency | 7 | 3 | 6 | 2 | 18 |
| Proportion | \(\dfrac{7}{18}\) | \(\dfrac{3}{18}=\dfrac{1}{6}\) | \(\dfrac{6}{18}=\dfrac{1}{3}\) | \(\dfrac{2}{18}=\dfrac{1}{9}\) | \(1\) |
| Angle | \(140^\circ\) | \(60^\circ\) | \(120^\circ\) | \(40^\circ\) | \(360^\circ\) |
Step 1: Find the total frequency
Step 2: Find each proportion
Apple:
Orange:
Banana:
Pear:
These fractions should add up to \(1\).
Step 3: Find each angle
Apple:
Orange:
Banana:
Pear:
Check:
Step 4: Draw the pie chart with a protractor
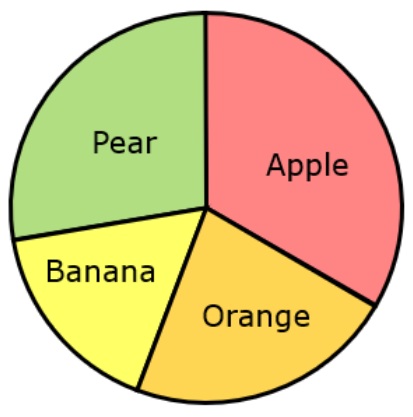
- Draw a circle using a compass.
- Draw one radius from the centre to start.
- Use a protractor to measure the first angle, for example Apple \(140^\circ\).
- Draw the next sector from the new line, for example Orange \(60^\circ\).
- Continue with Banana \(120^\circ\) and Pear \(40^\circ\).
- Label each sector clearly.
- Add a title if needed.
Labels for the diagram
After drawing the sectors, label them clearly:
- Apple — \(140^\circ\)
- Orange — \(60^\circ\)
- Banana — \(120^\circ\)
- Pear — \(40^\circ\)
Common mistakes and exam tips
Common mistakes
- Forgetting to find the total frequency first.
- Using the wrong total when finding fractions.
- Not multiplying by \(360^\circ\) to find the angle.
- Drawing sectors inaccurately with the protractor.
- Forgetting to label the sectors.
Exam tips
- Always check that all frequencies add to the total.
- Check that all proportions add to \(1\).
- Check that all angles add to \(360^\circ\).
- Use a sharp pencil and measure carefully with the protractor.
- Write the category names neatly on or near the sectors.
Summary
To draw a pie chart, find the total, work out each fraction, change each fraction into an angle, then draw each sector carefully and label it.