Maths4U
Menu

Maths4U Original · Learn, check, explain

Representation of continuous data: cumulative frequency graphs — 9709 S1

Interpolate percentiles inside a grouped class.

Notes and key methods

A cumulative frequency graph plots upper class boundaries against running totals. Locate a percentile by moving from its target cumulative frequency to the graph and then to the measurement axis.

Within a class, linear interpolation uses \(x=L+w(r-C)/f\), where L is the lower boundary, w the width, C the cumulative frequency before the class and f the class frequency. This is an estimate based on uniform spread inside the class.

Check the conditions

Three worked examples

Example 1 · Cumulative frequency and quartiles

Grouped measurements in cm have the following cumulative frequencies. Use linear interpolation, with percentile positions based on n.

Upper boundary (cm)Cumulative frequency
00
728
2184
35112
Diagram for this worked example
Use the labelled scales alongside the numerical method.
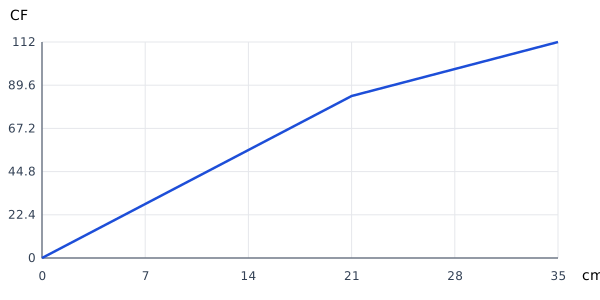
  1. Estimate the median in cm.
  2. Estimate the interquartile range in cm.
  3. Find the frequency of the middle class.
  4. Estimate the 90th percentile in cm.
Show the reasoning

(a)

\(Q_2=7+14\frac{56-28}{56}=14\)

Answer: \(14\).

(b)

\(Q_3-Q_1=21-7=14\)

Answer: \(14\).

(c)

The cumulative increase over that class is 56.

Answer: \(56\).

(d)

\(21+14\frac{0.9(112)-0.75(112)}{0.25(112)}=\frac{147}{5}\)

Answer: \(\frac{147}{5}\).

Example 2 · Cumulative frequency and quartiles

Grouped measurements in cm have the following cumulative frequencies. Use linear interpolation, with percentile positions based on n.

Upper boundary (cm)Cumulative frequency
00
830
2490
40120
Diagram for this worked example
Use the labelled scales alongside the numerical method.
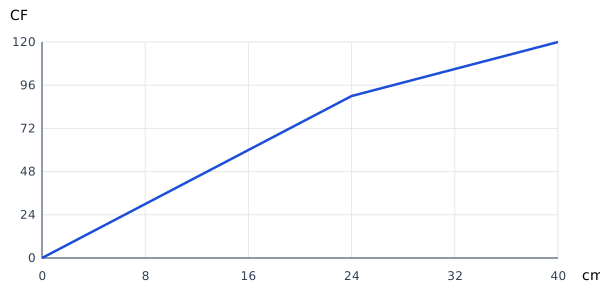
  1. Estimate the median in cm.
  2. Estimate the interquartile range in cm.
  3. Find the frequency of the middle class.
  4. Estimate the 90th percentile in cm.
Show the reasoning

(a)

\(Q_2=8+16\frac{60-30}{60}=16\)

Answer: \(16\).

(b)

\(Q_3-Q_1=24-8=16\)

Answer: \(16\).

(c)

The cumulative increase over that class is 60.

Answer: \(60\).

(d)

\(24+16\frac{0.9(120)-0.75(120)}{0.25(120)}=\frac{168}{5}\)

Answer: \(\frac{168}{5}\).

Example 3 · Cumulative frequency and quartiles

Grouped measurements in cm have the following cumulative frequencies. Use linear interpolation, with percentile positions based on n.

Upper boundary (cm)Cumulative frequency
00
932
2796
45128
Diagram for this worked example
Use the labelled scales alongside the numerical method.
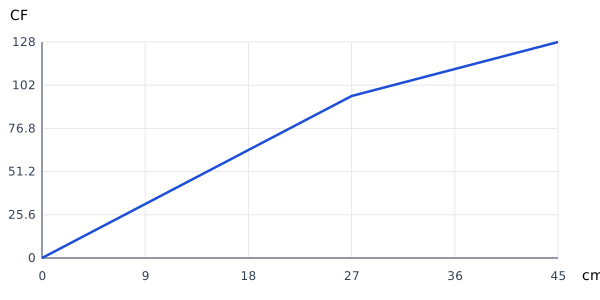
  1. Estimate the median in cm.
  2. Estimate the interquartile range in cm.
  3. Find the frequency of the middle class.
  4. Estimate the 90th percentile in cm.
Show the reasoning

(a)

\(Q_2=9+18\frac{64-32}{64}=18\)

Answer: \(18\).

(b)

\(Q_3-Q_1=27-9=18\)

Answer: \(18\).

(c)

The cumulative increase over that class is 64.

Answer: \(64\).

(d)

\(27+18\frac{0.9(128)-0.75(128)}{0.25(128)}=\frac{189}{5}\)

Answer: \(\frac{189}{5}\).

Common mistakes

Practise with answer checking

Original exam-style problems

Write complete solutions before opening the worked solution. The marking guidance rewards reasoning as well as answers.

Examination practice · 2020–2026

Apply the method to recent source-labelled questions from this chapter.

Browse recent examination questions · All topic resources and the full bank

Next skill: Comparing different data representations →