Representation of continuous data: histograms — 9709 S1
Use frequency density and midpoint estimates with unequal class widths.
Notes and key methods
In a histogram, bar area represents frequency: \(\text{frequency density}=f/\text{class width}\). Heights alone cannot be compared when class widths differ.
For grouped estimates use class midpoints m: \(\bar x\approx\sum fm/\sum f\) and \(s^2\approx\sum fm^2/\sum f-\bar x^2\). The estimates assume that midpoints reasonably represent values inside each class.
Check the conditions
Classes are disjoint and their boundaries are explicit.
Grouped means and variances are estimates, not recovered raw-data values.
Three worked examples
Example 1 · Histograms and grouped estimates
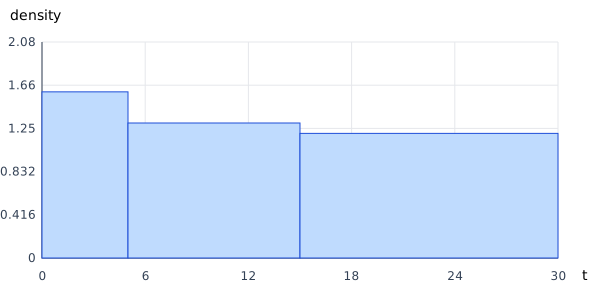
Measurements of duration t, in seconds, are grouped below.
Class (seconds)
Frequency
\(0\le t<5\)
8
\(5\le t<15\)
13
\(15\le t<30\)
18
Use the labelled scales alongside the numerical method.
Find the frequency density of the middle class.
Estimate the mean duration in seconds.
Estimate the variance in square seconds.
Find the number of observations with t below the last class boundary before the final class.
Show the reasoning
(a)
\(f/w=13/10=\frac{13}{10}\)
Answer: \(\frac{13}{10}\).
(b)
\(\bar t\approx\sum fm/\sum f=\frac{185}{13}\)
Answer: \(\frac{185}{13}\).
(c)
\(\sum fm^2/\sum f-\bar t^2=\frac{22225}{338}\)
Answer: \(\frac{22225}{338}\).
(d)
The first two classes contain 8+13 observations.
Answer: \(21\).
Example 2 · Histograms and grouped estimates
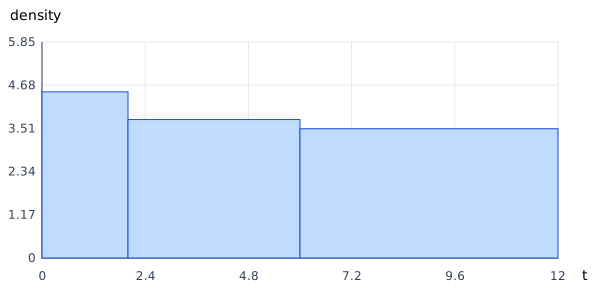
Measurements of duration t, in seconds, are grouped below.
Class (seconds)
Frequency
\(0\le t<2\)
9
\(2\le t<6\)
15
\(6\le t<12\)
21
Use the labelled scales alongside the numerical method.
Find the frequency density of the middle class.
Estimate the mean duration in seconds.
Estimate the variance in square seconds.
Find the number of observations with t below the last class boundary before the final class.
Show the reasoning
(a)
\(f/w=15/4=\frac{15}{4}\)
Answer: \(\frac{15}{4}\).
(b)
\(\bar t\approx\sum fm/\sum f=\frac{86}{15}\)
Answer: \(\frac{86}{15}\).
(c)
\(\sum fm^2/\sum f-\bar t^2=\frac{2354}{225}\)
Answer: \(\frac{2354}{225}\).
(d)
The first two classes contain 9+15 observations.
Answer: \(24\).
Example 3 · Histograms and grouped estimates
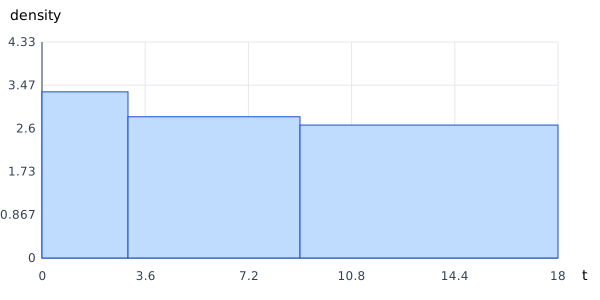
Measurements of duration t, in seconds, are grouped below.
Class (seconds)
Frequency
\(0\le t<3\)
10
\(3\le t<9\)
17
\(9\le t<18\)
24
Use the labelled scales alongside the numerical method.
Find the frequency density of the middle class.
Estimate the mean duration in seconds.
Estimate the variance in square seconds.
Find the number of observations with t below the last class boundary before the final class.
Show the reasoning
(a)
\(f/w=17/6=\frac{17}{6}\)
Answer: \(\frac{17}{6}\).
(b)
\(\bar t\approx\sum fm/\sum f=\frac{147}{17}\)
Answer: \(\frac{147}{17}\).
(c)
\(\sum fm^2/\sum f-\bar t^2=\frac{13545}{578}\)
Answer: \(\frac{13545}{578}\).
(d)
The first two classes contain 10+17 observations.
Answer: \(27\).
Common mistakes
Use frequency density rather than frequency for unequal-width bars.
Do not average the midpoints without frequency weights.