Maths4U
Menu

Maths4U Original · Learn, check, explain

Cubic graphs and sign conditions — 0606

Use ordered roots and interval signs to solve a cubic inequality.

Notes and key methods

For three distinct simple real roots, a cubic changes sign at each root. The leading coefficient fixes the sign to the far right. A test value in each interval can confirm the sign chart.

A non-strict inequality includes its zero boundaries. For \(\displaystyle y=|P(x)|\), reflect only the intervals where the cubic is negative; these roots remain the meeting points of the reflected pieces.

Check the conditions

Three worked examples

Example 1 · Cubic sign charts

\(\displaystyle P(x)=\)\(\left(x - 10\right) \left(x - 6\right) \left(x - 3\right)\). Use a sign chart to analyse P.

Diagram for this worked example
Use the labelled scales alongside the numerical method.
  1. Solve \(\displaystyle P(x)\ge 0\).
  2. Solve P(x)<0.
  3. Find the largest root.
  4. Evaluate P at the midpoint of the last two roots.
Show the reasoning

(a)

The signs from left to right are −,+,−,+; include all three zero boundaries.
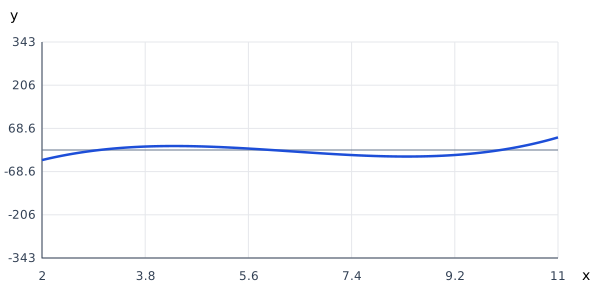
Answer: \(\left[3, 6\right] \cup \left[10, \infty\right)\)

(b)

Take precisely the negative intervals and exclude their zero boundaries.

Answer: \(\left(-\infty, 3\right) \cup \left(6, 10\right)\)

(c)

Set the last linear factor to zero.

\(10\)

Answer: \(10\).

(d)

The middle-right interval has negative sign.

\(-20\)

Answer: \(-20\).

Example 2 · Cubic sign charts

\(\displaystyle P(x)=\)\(\left(x - 10\right) \left(x - 5\right) \left(x - 4\right)\). Use a sign chart to analyse P.

Diagram for this worked example
Use the labelled scales alongside the numerical method.
  1. Solve \(\displaystyle P(x)\ge 0\).
  2. Solve P(x)<0.
  3. Find the largest root.
  4. Evaluate P at the midpoint of the last two roots.
Show the reasoning

(a)

The signs from left to right are −,+,−,+; include all three zero boundaries.
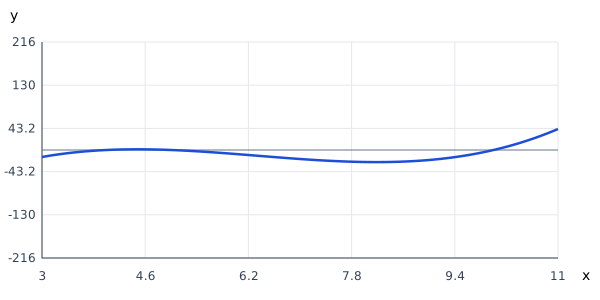
Answer: \(\left[4, 5\right] \cup \left[10, \infty\right)\)

(b)

Take precisely the negative intervals and exclude their zero boundaries.

Answer: \(\left(-\infty, 4\right) \cup \left(5, 10\right)\)

(c)

Set the last linear factor to zero.

\(10\)

Answer: \(10\).

(d)

The middle-right interval has negative sign.

\(\displaystyle - \frac{175}{8}\)

Answer: \(\displaystyle - \frac{175}{8}\).

Example 3 · Cubic sign charts

\(\displaystyle P(x)=\)\(\left(x - 9\right) \left(x - 7\right) \left(x - 5\right)\). Use a sign chart to analyse P.

Diagram for this worked example
Use the labelled scales alongside the numerical method.
  1. Solve \(\displaystyle P(x)\ge 0\).
  2. Solve P(x)<0.
  3. Find the largest root.
  4. Evaluate P at the midpoint of the last two roots.
Show the reasoning

(a)

The signs from left to right are −,+,−,+; include all three zero boundaries.
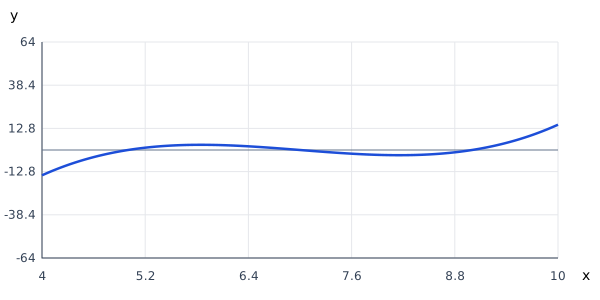
Answer: \(\left[5, 7\right] \cup \left[9, \infty\right)\)

(b)

Take precisely the negative intervals and exclude their zero boundaries.

Answer: \(\left(-\infty, 5\right) \cup \left(7, 9\right)\)

(c)

Set the last linear factor to zero.

\(9\)

Answer: \(9\).

(d)

The middle-right interval has negative sign.

\(-3\)

Answer: \(-3\).

Common mistakes

Practise with answer checking

Original exam-style problems

Write complete solutions before opening the worked solution. The marking guidance rewards reasoning as well as answers.

Examination practice · 2020–2026

Apply the method to recent source-labelled questions from this chapter.

Browse recent examination questions · All topic resources and the full bank

Next skill: Remainders of polynomial division →