Describe association and use a supplied fitted line within the data range.
Core & Extended · Syllabus C9.5, E9.5
Notes and key methods
A scatter graph plots paired numerical observations. Positive correlation means larger x values tend to accompany larger y values; negative correlation means they tend to accompany smaller y values. Association alone does not establish a cause.
A line of best fit follows the overall trend with points on both sides; it need not pass through the origin or every point. Use interpolation within the observed x range with more confidence than extrapolation outside it. No numerical correlation coefficient is required here.
Check the conditions
Use the stated units and precision.
Show the method as well as the final answer.
Three worked examples
Example 1 · Scatter graphs, correlation and estimates
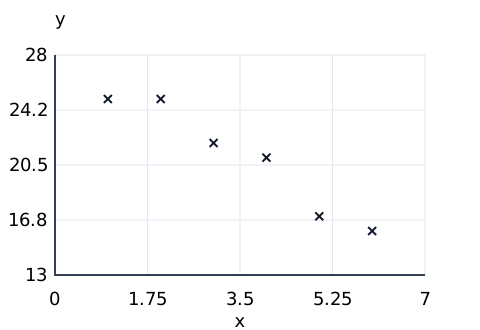
Paired observations are given below. For estimates, use the supplied fitted line \(y=28 - 2 x\).
x
y
1
25
2
25
3
22
4
21
5
17
6
16
Read the description and labels. Geometric sketches are schematic unless coordinate scales are shown.
Choose the direction of the association.
positive correlation
no association
proof of causation
negative correlation
Using the supplied fitted line, estimate y at \(\displaystyle x=3\).
Using the supplied fitted line, estimate y at \(\displaystyle x=4.5\).
According to the fitted line, find the change in y when x increases by 2.
Show the reasoning
(a)
Inspect the direction of the overall point trend.
As x increases, y generally decreases.
Answer: negative correlation.
(b)
Interpolate with the supplied line, rather than forcing it through a data point.
Substituting the input gives 22.
Answer: \(22\).
(c)
Use the complete fitted rule at an input within the observed range.
Substitute 4.5 into the fitted line to obtain \(19\).
Answer: \(19\).
(d)
Use the signed gradient for the output change.
The gradient -2 times input change 2 gives -4.
Answer: \(-4\).
Example 2 · Scatter graphs, correlation and estimates
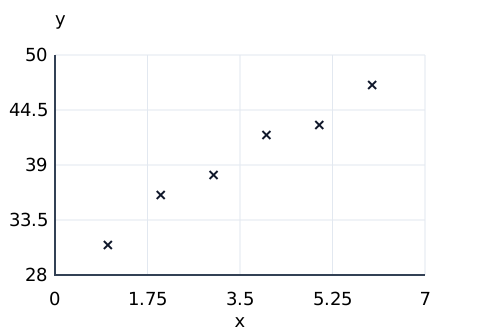
Paired observations are given below. For estimates, use the supplied fitted line \(y=3 x + 29\).
x
y
1
31
2
36
3
38
4
42
5
43
6
47
Read the description and labels. Geometric sketches are schematic unless coordinate scales are shown.
Choose the direction of the association.
no association
proof of causation
positive correlation
negative correlation
Using the supplied fitted line, estimate y at \(\displaystyle x=4\).
Using the supplied fitted line, estimate y at \(\displaystyle x=4.5\).
According to the fitted line, find the change in y when x increases by 2.
Show the reasoning
(a)
Inspect the direction of the overall point trend.
As x increases, y generally increases.
Answer: positive correlation.
(b)
Interpolate with the supplied line, rather than forcing it through a data point.
Substituting the input gives 41.
Answer: \(41\).
(c)
Use the complete fitted rule at an input within the observed range.
Substitute 4.5 into the fitted line to obtain \(\displaystyle \frac{85}{2}\).
Answer: \(\displaystyle \frac{85}{2}\).
(d)
Use the signed gradient for the output change.
The gradient 3 times input change 2 gives 6.
Answer: \(6\).
Example 3 · Scatter graphs, correlation and estimates
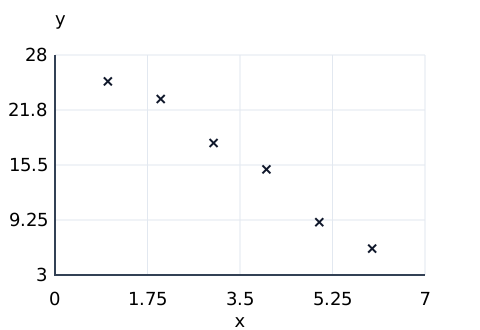
Paired observations are given below. For estimates, use the supplied fitted line \(y=30 - 4 x\).
x
y
1
25
2
23
3
18
4
15
5
9
6
6
Read the description and labels. Geometric sketches are schematic unless coordinate scales are shown.
Choose the direction of the association.
proof of causation
negative correlation
positive correlation
no association
Using the supplied fitted line, estimate y at \(\displaystyle x=5\).
Using the supplied fitted line, estimate y at \(\displaystyle x=4.5\).
According to the fitted line, find the change in y when x increases by 2.
Show the reasoning
(a)
Inspect the direction of the overall point trend.
As x increases, y generally decreases.
Answer: negative correlation.
(b)
Interpolate with the supplied line, rather than forcing it through a data point.
Substituting the input gives 10.
Answer: \(10\).
(c)
Use the complete fitted rule at an input within the observed range.
Substitute 4.5 into the fitted line to obtain \(12\).
Answer: \(12\).
(d)
Use the signed gradient for the output change.
The gradient -4 times input change 2 gives -8.
Answer: \(-8\).
Common mistakes
Keep intermediate values exact until the final step.