Represent frequency by bar area and label frequency density.
Extended · Syllabus E9.7
Notes and key methods
For a histogram, frequency density is frequency divided by class width. Bar area, rather than height alone, represents frequency. The vertical axis must therefore be labelled “Frequency density” when class widths differ.
Multiply density by class width to recover a frequency. Adjacent continuous classes have touching bars. Compare actual frequencies using areas, and do not use the highest bar alone as a statement that its class contains the most observations.
Check the conditions
Use the stated units and precision.
Show the method as well as the final answer.
Three worked examples
Example 1 · Histograms with unequal class widths
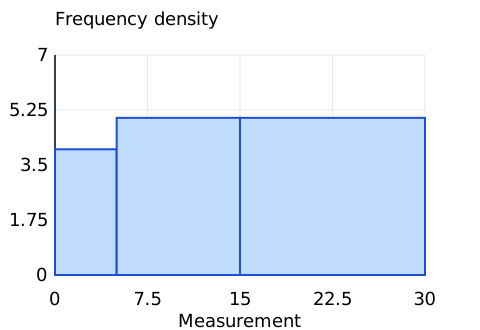
A continuous measurement has the grouped frequency table below.
Class
Frequency
\(\displaystyle 0\le x<5\)
20
\(\displaystyle 5\le x<15\)
50
\(\displaystyle 15\le x<30\)
75
Read the description and labels. Geometric sketches are schematic unless coordinate scales are shown.
Find the frequency density of the first class.
Find the frequency density of the second class.
Find the frequency density of the third class.
Find the total frequency represented by all histogram bars.
Show the reasoning
(a)
Divide frequency by the actual class width.
20 divided by width 5 gives 4.
Answer: \(4\).
(b)
Use the second class width rather than reusing the first.
50 divided by width 10 gives 5.
Answer: \(5\).
(c)
Use the third class width to determine bar height.
75 divided by width 15 gives 5.
Answer: \(5\).
(d)
Recover or use actual class frequencies rather than summing densities.
Add bar areas 20, 50, 75 to obtain 145.
Answer: \(145\).
Example 2 · Histograms with unequal class widths
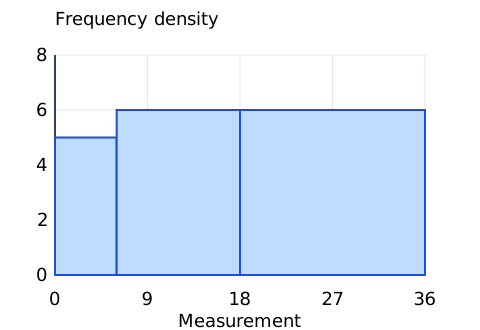
A continuous measurement has the grouped frequency table below.
Class
Frequency
\(\displaystyle 0\le x<6\)
30
\(\displaystyle 6\le x<18\)
72
\(\displaystyle 18\le x<36\)
108
Read the description and labels. Geometric sketches are schematic unless coordinate scales are shown.
Find the frequency density of the first class.
Find the frequency density of the second class.
Find the frequency density of the third class.
Find the total frequency represented by all histogram bars.
Show the reasoning
(a)
Divide frequency by the actual class width.
30 divided by width 6 gives 5.
Answer: \(5\).
(b)
Use the second class width rather than reusing the first.
72 divided by width 12 gives 6.
Answer: \(6\).
(c)
Use the third class width to determine bar height.
108 divided by width 18 gives 6.
Answer: \(6\).
(d)
Recover or use actual class frequencies rather than summing densities.
Add bar areas 30, 72, 108 to obtain 210.
Answer: \(210\).
Example 3 · Histograms with unequal class widths
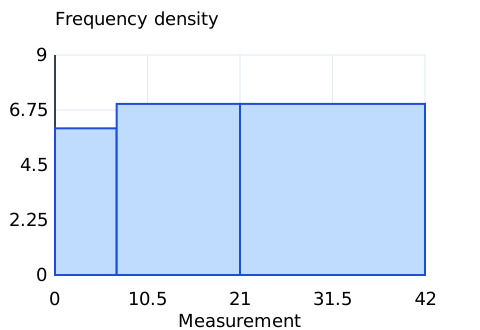
A continuous measurement has the grouped frequency table below.
Class
Frequency
\(\displaystyle 0\le x<7\)
42
\(\displaystyle 7\le x<21\)
98
\(\displaystyle 21\le x<42\)
147
Read the description and labels. Geometric sketches are schematic unless coordinate scales are shown.
Find the frequency density of the first class.
Find the frequency density of the second class.
Find the frequency density of the third class.
Find the total frequency represented by all histogram bars.
Show the reasoning
(a)
Divide frequency by the actual class width.
42 divided by width 7 gives 6.
Answer: \(6\).
(b)
Use the second class width rather than reusing the first.
98 divided by width 14 gives 7.
Answer: \(7\).
(c)
Use the third class width to determine bar height.
147 divided by width 21 gives 7.
Answer: \(7\).
(d)
Recover or use actual class frequencies rather than summing densities.
Add bar areas 42, 98, 147 to obtain 287.
Answer: \(287\).
Common mistakes
Keep intermediate values exact until the final step.