0580 P21 - Jun 2026 - Q22 - 3 marks
The lengths of 145 pieces of wire are grouped as shown. Stanley draws a histogram. Complete the missing bar heights.
| Length \(L\) (cm) | \(70<L\le90\) | \(90<L\le100\) | \(100<L\le115\) | \(115<L\le120\) |
|---|---|---|---|---|
| Frequency | 40 | 35 | 45 | 25 |
| Bar height (cm) | 4 |
Complete the table. [3]

0580 P42 - Jun 2026 - Q19 - 7 marks
The table shows the time spent in a shop by 40 customers.
| Time t (minutes) | \(0<t\le5\) | \(5<t\le10\) | \(10<t\le20\) | \(20<t\le40\) |
|---|---|---|---|---|
| Frequency | 3 | 18 | 13 | 6 |
(a) Estimate the mean time. [4]
(b) Complete the histogram. [3]


0580 P42 - Mar 2025 - Q15 - 7 marks
Virat records the heights of 80 sunflowers.
| Height h (m) | \(1.2<h\le1.5\) | \(1.5<h\le1.6\) | \(1.6<h\le1.7\) | \(1.7<h\le1.9\) |
|---|---|---|---|---|
| Frequency | 12 | 20 | 34 | 14 |
(a) Estimate the mean height. [4]
(b) Draw a histogram. [3]


0580 P43 - Jun 2025 - Q24 - 4 marks

(a) Use the histogram to find the number of people in each grouped interval. [3]
| Distance (km) | Number of people |
|---|---|
| \(0<d\le5\) | ? |
| \(5<d\le20\) | ? |
| \(20<d\le50\) | ? |
(b) People travelling more than 35 km have a car allowance. Estimate how many qualify. [1]

0580 P41 - Nov 2025 - Q25 - 3 marks
Light parcels have mass 0<m≤2 kg; heavy parcels 2<m≤5 kg.

(a) Find the number of light parcels. [1]
(b) There are 102 heavy parcels. Complete the histogram. [2]


0580 P42 - Nov 2025 - Q16 - 8 marks
The histogram shows coconut masses in categories A, B, C and D.
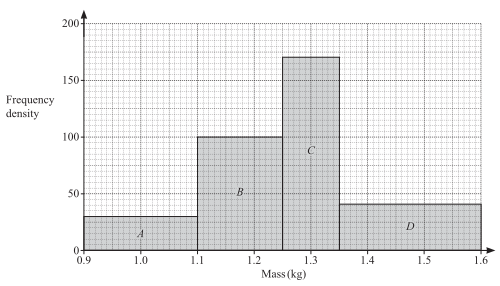
(a) Show that there are 10 coconuts in D. [1]
(b) Two coconuts are chosen at random from categories C and D. Find the probability that both are from D. [3]
(c) Estimate the mean mass of all coconuts. [4]

0580 P43 - Nov 2025 - Q23 - 7 marks
The table gives the masses of 200 oranges.
| Mass (g) | \(180<m\le200\) | \(200<m\le210\) | \(210<m\le215\) | \(215<m\le230\) |
|---|---|---|---|---|
| Frequency | 32 | 64 | 74 | 30 |
(a) Estimate the mean mass. [4]
(b) Sarah draws a histogram. Complete the bar heights in centimetres. [3]
| Mass (g) | \(180<m\le200\) | \(200<m\le210\) | \(210<m\le215\) | \(215<m\le230\) |
|---|---|---|---|---|
| Bar height (cm) | … | … | 7.4 | … |

0580 P42 - Mar 2024 - Q3 - 13 marks
Ten students have the following test marks.
| Mark | 15 | 16 | 17 | 18 | 19 | 20 |
|---|---|---|---|---|---|---|
| Frequency | 4 | 1 | 2 | 1 | 0 | 2 |
(a(i)) Find the range. [1]
(a(ii)) Find the mean. [3]
(a(iii)) Find the median. [1]
(a(iv)) State the mode. [1]
(b) Paulo has mean 17 for seven homework tasks. After the eighth his mean is 17.5. Find his eighth mark. [3]
The final exam percentages of 100 students are recorded below.
| Percentage | \(0<p\le30\) | \(30<p\le50\) | \(50<p\le60\) | \(60<p\le70\) | \(70<p\le100\) |
|---|---|---|---|---|---|
| Frequency | 12 | 18 | 35 | 20 | 15 |
(c) Draw a histogram on the grid. [4]


0580 P42 - Jun 2024 - Q3 - 15 marks
Travel times of 40 students:
| m(minutes) | \(0<m\le10\) | \(10<m\le25\) | \(25<m\le40\) | \(40<m\le60\) |
|---|---|---|---|---|
| Frequency | 3 | 18 | 15 | 4 |
(a(i)) Estimate the mean. [4]
(a(ii)) Draw a histogram. [3]

(a(iii)) Two students are chosen at random. Find P(one takes more than 25 minutes and the other 10 minutes or less). [3]
For 200 questionnaire completion times: longest 30 min, median 22 min, lower quartile 8 min, IQR 19 min, range 25 min.
(b(i)) Find the shortest time. [1]
(b(ii)) Draw a box-and-whisker plot. [3]

(b(iii)) George says 101 people took more than 22 minutes. Explain why he is wrong. [1]


0580 P41 - Nov 2024 - Q3 - 8 marks
Waiting times for 120 patients are:
| t (minutes) | \(0<t\le10\) | \(10<t\le20\) | \(20<t\le40\) | \(40<t\le50\) | \(50<t\le80\) |
|---|---|---|---|---|---|
| Frequency | 2 | 46 | 33 | 26 | 13 |
(a) Estimate the mean waiting time. [4]
At another centre the histogram below represents 90 patients; none waits more than 80 minutes.

(b) Complete the bar for waiting times between 10 and 30 minutes. [4]


0580 P42 - Nov 2024 - Q5 - 15 marks
The cumulative frequency diagram shows monthly distances for 80 motorists.

(a(i)(a)) Estimate the median. [1]
(a(i)(b)) Estimate the interquartile range. [2]
(a(ii)) One motorist is selected at random. Find the probability they travel more than 1800 km. [2]
(b) A car completes a 5.104 km lap in 1 minute 18 seconds. Find its average speed in km/h. [3]
The histogram shows the top speeds of 160 cars.

(c(i)) Show 8 cars have top speed 120<v≤160. [1]
(c(ii)) Estimate the mean top speed, showing all working. [6]


0580 P43 - Nov 2024 - Q8 - 9 marks
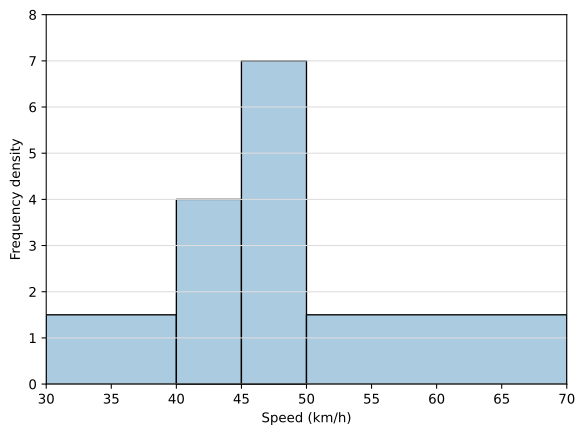
The speeds of 100 cars are grouped as follows.
| Speed v (km/h) | \(30<v\le40\) | \(40<v\le45\) | \(45<v\le50\) | \(50<v\le70\) |
|---|---|---|---|---|
| Frequency | 15 | 20 | 35 | 30 |
(a) Find the pie-chart angle for 45<v≤50. [2]
(b) Estimate the mean speed. [4]

(c) Complete the histogram. [3]

0580 P22 - Nov 2023 - Q23 - 2 marks
| Reaction time \(t\) (s) | \(0<t\le6\) | \(6<t\le10\) |
|---|---|---|
| Frequency | 18 | 16 |
The first histogram block is 7.5 cm high. Calculate the height of the second. [2]

0580 P41 - Nov 2023 - Q7 - 7 marks
Times of 42 athletes:
| Time \(t\) (s) | Frequency |
|---|---|
| \(216<t\le219\) | 9 |
| \(219<t\le224\) | 14 |
| \(224<t\le234\) | 14 |
| \(234<t\le244\) | 2 |
| \(244<t\le264\) | 3 |

(a) Estimate the mean race time. [4]
(b) Complete the histogram. [3]


0580 P43 - Nov 2023 - Q5 - 14 marks
Indira records workers’ travel times. The table and histogram each show part of the information.
| Time (minutes) | \(0<t\le10\) | \(10<t\le25\) | \(25<t\le40\) | \(40<t\le60\) | \(60<t\le80\) |
|---|---|---|---|---|---|
| Frequency | 57 | 38 | 12 |

(a) Complete the table and histogram. [5]
(b) Estimate the mean travel time. [4]
(c) Tahir says the maximum travel time is 80 minutes. Explain why he may be wrong. [1]
(d) Three workers with travel time over 25 minutes are selected at random. Find the probability one takes 60 minutes or less and two take more than 60 minutes. [4]


0580 P42 - Jun 2022 - Q7 - 12 marks
Masses \(m\) (kg) of 150 children:
| Mass | \(0<m\le10\) | \(10<m\le20\) | \(20<m\le25\) | \(25<m\le40\) | \(40<m\le50\) |
|---|---|---|---|---|---|
| Frequency | 12 | 38 | 32 | 50 | 18 |

(a) Estimate the mean mass. [4]
(b) Draw a histogram for the data. [4]
(c(i)) Complete a cumulative frequency table at upper boundaries 10, 20, 25, 40 and 50 kg. [2]
(c(ii)) Find the percentage of children with mass greater than 10 kg. [2]


0580 P42 - Nov 2022 - Q3 - 15 marks
Kai surveys distances travelled by 200 cars:
| Distance d (km) | \(80<d\le100\) | \(100<d\le150\) | \(150<d\le200\) | \(200<d\le300\) | \(300<d\le400\) |
|---|---|---|---|---|---|
| Frequency | 7 | 33 | 76 | 52 | 32 |
(a(i)) Estimate the mean distance. [4]
(a(ii)) Ann uses the same frequencies, but her last interval is \(300<d\le360\). Without recalculating the full mean, find the difference between the two estimates, showing working. [2]
(a(iii)) In Kai’s histogram the \(200<d\le300\) bar is 2.6 cm high. Find the heights for \(80<d\le100,150<d\le200,300<d\le400\). [3]
(b) A car is chosen at random. Find the probability it travelled more than 300 km. [1]
(c(i)) Two cars are chosen at random without replacement. Find the probability both travelled 150 km or less. [2]
(c(ii)) Find the probability one travelled more than 200 km and the other 100 km or less. [3]

0580 P43 - Nov 2022 - Q3 - 7 marks
The heights of 100 plants are recorded:
| Height h (cm) | \(10<h\le15\) | \(15<h\le25\) | \(25<h\le40\) | \(40<h\le60\) | \(60<h\le70\) |
|---|---|---|---|---|---|
| Frequency | 8 | 18 | 28 | 33 | 13 |

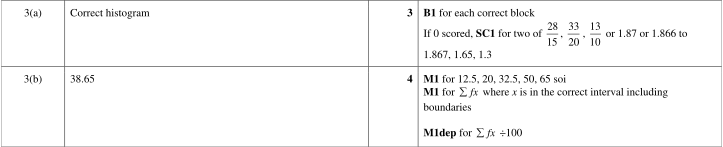
(a) Complete the histogram. [3]
(b) Estimate the mean height. [4]

0580 P42 - Jun 2021 - Q4 - 15 marks
Masses of 40 parcels:
| Mass m (kg) | .5 < m ≤ 1 | 1 < m ≤ 2 | 2 < m ≤ 4 | 4 < m ≤ 7 | 7 < m ≤ 12 |
|---|---|---|---|---|---|
| Frequency | 4 | 7 | 15 | 10 | 4 |


(a(i)) Complete the histogram. [3]
(a(ii)) Estimate the mean mass. [4]
(a(iii)) Find the probability a randomly chosen parcel weighs 2 kg or less. [1]
(a(iv)) Choose two parcels without replacement from those heavier than 2 kg. Find the probability one exceeds 7 kg and the other is at most 4 kg. [3]
(b(i)) Read the median from the box plot for a different warehouse. [1]
(b(ii)) Find its interquartile range. [1]
(b(iii)) Two parcels of masses 2.4 kg and 5.8 kg are removed. Describe the effect on the median and explain. [2]



0580 P43 - Jun 2021 - Q3 - 15 marks
Zoe’s scores: 6, 7, 7, 7, 8, 9, 9, 10, 10.

| Score | 5 | 6 | 7 | 8 | 9 | 10 |
|---|---|---|---|---|---|---|
| Frequency | 3 | 10 | 43 | 75 | 48 | 21 |

(a(i)) Find the range of Zoe’s scores. [1]
(a(ii)) Find the mode. [1]
(a(iii)) Find the median. [1]
(b(i)) Use the time diagram to estimate the median time. [1]
(b(ii)) Estimate the interquartile range. [2]
(c) Find the mean of the 200 test scores in the table. [3]
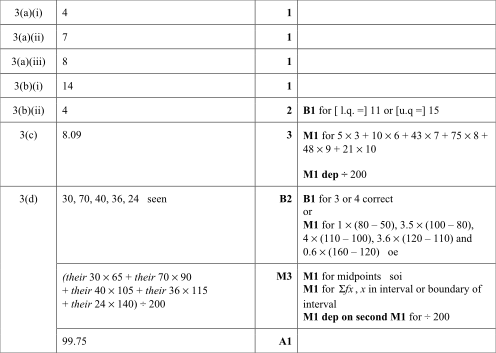
(d) Estimate the mean height of the 200 plants. Show working. [6]
0580 P23 - Nov 2020 - Q22 - 7 marks
The times t seconds for100 students to solve a puzzle are recorded.
| Time | \(0<t\le10\) | \(10<t\le15\) | \(15<t\le20\) | \(20<t\le40\) | \(40<t\le75\) |
|---|---|---|---|---|---|
| Frequency | 9 | 18 | 22 | 30 | 21 |
(a) Estimate the mean time. [4]
(b) Histogram bars have the following heights. Complete the table.
| Time | \(0<t\le10\) | \(10<t\le15\) | \(15<t\le20\) | \(20<t\le40\) | \(40<t\le75\) |
|---|---|---|---|---|---|
| Bar height(cm) | 3.6 | 14.4 | 17.6 | … | … |

0580 P22 - Jun 2019 - Q18 - 3 marks
| Age y (years) | Number |
|---|---|
| 15<y≤25 | 35 |
| 25<y≤30 | 32 |
| 30<y≤50 | 44 |
| 50<y≤80 | 12 |
Dexter draws a histogram. The bar for 15

0580 P43 - Jun 2019 - Q6 - 8 marks
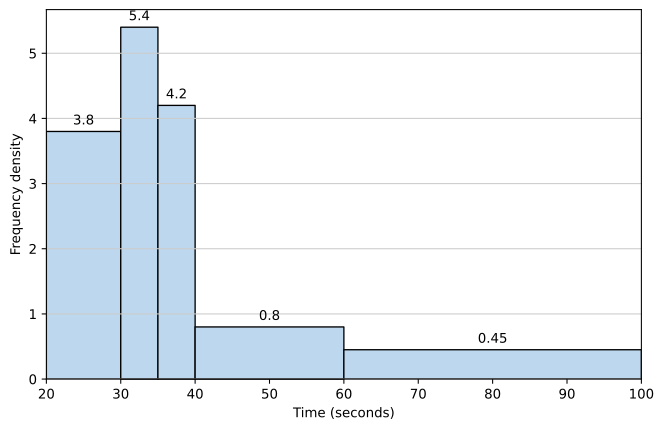
120 boys solve a puzzle in t seconds:
| Time t (seconds) | Frequency |
|---|---|
| 20<t≤30 | 38 |
| 30<t≤35 | 27 |
| 35<t≤40 | 21 |
| 40<t≤60 | 16 |
| 60<t≤100 | 18 |
(a) Estimate the mean time. [4]
(b) Complete the histogram. [4]


0580 P23 - Nov 2019 - Q23 - 4 marks
The school travel times of 50 students are recorded.
| Time t (minutes) | \(0<t\le10\) | \(10<t\le15\) | \(15<t\le20\) | \(20<t\le40\) |
|---|---|---|---|---|
| Frequency | 7 | 19 | 16 | 8 |
(a) Write the modal class. [1]

(b) Complete the histogram. [3]


0580 P22 - Jun 2018 - Q13 - 2 marks
The histogram shows time t minutes spent in a shop by 80 people.

| t (minutes) | \(0<t\le5\) | \(5<t\le15\) | \(15<t\le30\) | \(30<t\le50\) | \(50<t\le70\) |
|---|---|---|---|---|---|
| Frequency | 6 | ____ | 27 | ____ | 10 |
Complete the table. [2]

0580 P42 - Nov 2018 - Q9 - 9 marks
Saturday supermarket times of 120 people:
| T minutes | 10| 30 | 40 | 45 | 50 | 60 | |
|---|---|---|---|---|---|---|
| Frequency | 16 | 18 | 22 | 40 | 21 | 3 |
(a(i)) Use class midpoints to estimate the mean. [4]

(a(ii)) Complete the histogram. [4]
Wednesday times for 120 people:

(b) Compare the distributions for the two days. [1]


0580 P43 - Nov 2018 - Q5 - 14 marks
A metal recycling factory records weekly mass x tonnes for 52 weeks:
| Mass | 100| 200 | 250 | 300 | |
|---|---|---|---|---|
| Frequency | 8 | 20 | 12 | 12 |
(a(i)) Estimate the mean. [4]

(a(ii)) Draw a histogram. [4]
Another factory records daily masses:

(b(i)) How many days? [1]
(b(ii)) Estimate the median. [1]
(b(iii)) Estimate upper quartile. [1]
(b(iv)) Estimate interquartile range. [1]
(b(v)) Estimate days when mass>20 tonnes. [2]


0580 P42 - Jun 2017 - Q3 - 14 marks
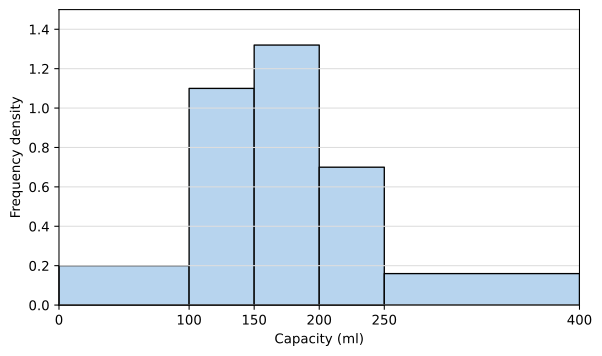
200 students estimate a cup’s capacity x ml.
| Capacity | \(0<x\le100\) | \(100<x\le150\) | \(150<x\le200\) | \(200<x\le250\) | \(250<x\le400\) |
|---|---|---|---|---|---|
| Frequency | 20 | 55 | 66 | 35 | 24 |
(a(i)) Estimate the mean capacity. [4]

(a(ii)) Complete the histogram. [4]
The same students estimate a rock’s mass m grams.
| Mass | \(m\le50\) | \(m\le100\) | \(m\le150\) | \(m\le200\) | \(m\le250\) |
|---|---|---|---|---|---|
| Cumulative frequency | 28 | 64 | 104 | 168 | 200 |

(b(i)) Draw a cumulative frequency diagram. [3]
(b(ii)(a)) Find the 65th percentile. [1]
(b(ii)(b)) Find the number estimating more than 75 g. [2]


0580 P43 - Jun 2017 - Q5 - 13 marks
Haroon has 200 letters. The histogram shows their masses m grams.

| Mass | \(0<m\le10\) | \(10<m\le20\) | \(20<m\le25\) | \(25<m\le30\) | \(30<m\le50\) |
|---|---|---|---|---|---|
| Frequency | 50 | 17 |
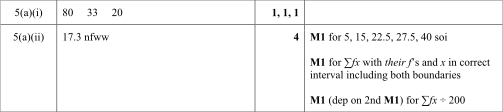
(a(i)) Complete the frequency table. [3]
(a(ii)) Estimate the mean mass. [4]
Haroon also has 15 parcels: 9 small and 6 large. He selects two at random without replacement.
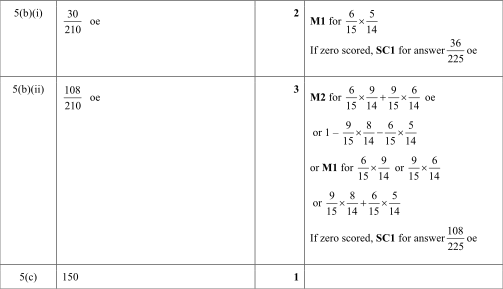
(b(i)) Find P(both large). [2]
(b(ii)) Find P(one small and one large). [3]
(c) P(a parcel arrives late)=3/80. For 4000 parcels, estimate the number arriving late. [1]
0580 P41 - Nov 2017 - Q5 - 7 marks
Masses m grams of 360 apples are shown in the histogram. The shaded key square represents 10 apples.
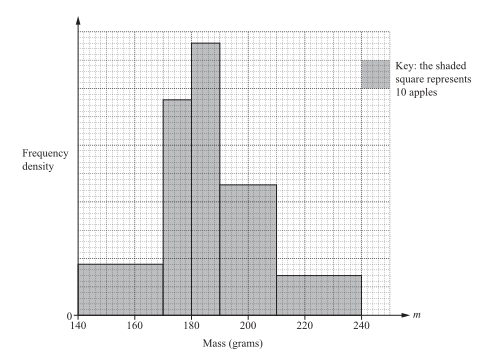
| Mass (g) | \(140<m\le170\) | \(170<m\le180\) | \(180<m\le190\) | \(190<m\le210\) | \(210<m\le240\) |
|---|---|---|---|---|---|
| Frequency | 92 | 42 |
(a) Complete the frequency table. [3]
(b) Estimate the mean mass. [4]

0580 P42 - Nov 2017 - Q6 - 14 marks
For 100 students in group A, distances d metres run in one minute are shown.

(a(i)) Find the median. [1]
(a(ii)) Find the upper quartile. [1]
(a(iii)) Find the interquartile range. [1]
(a(iv)) Find how many run more than 350 m. [2]
Group B also has 100 students:
| Distance (m) | \(100<d\le200\) | \(200<d\le250\) | \(250<d\le280\) | \(280<d\le320\) | \(320<d\le400\) |
|---|---|---|---|---|---|
| Frequency | 20 | 22 | 30 | 16 | 12 |
(b(i)) Estimate the mean distance. [4]

(b(ii)) Complete the histogram. [4]
(c) Group B’s median is 258 m. Complete: on average group A students run … than group B. [1]


0580 P43 - Nov 2017 - Q4 - 17 marks
150 girls take t minutes to complete an essay:
| Time (min) | \(60<t\le65\) | \(65<t\le70\) | \(70<t\le80\) | \(80<t\le100\) | \(100<t\le150\) |
|---|---|---|---|---|---|
| Frequency | 10 | 26 | 34 | 58 | 22 |
(a) Write the interval containing the median. [1]
(b) Estimate the mean time. [4]
(c(i)) Explain why the exact range cannot be calculated. [1]
(c(ii)) Find the pie chart angle for 65
(d) Find P(a random girl took more than 100 min). [1]
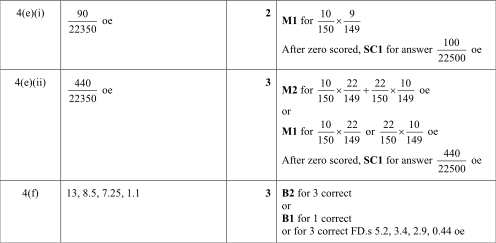
(e(i)) Two distinct girls are chosen. Find P(both took at most 65 min). [2]
(e(ii)) Find P(one took at most 65 min and the other more than 100 min). [3]
A histogram’s first block has height 5 cm.
| Time (min) | \(60<t\le65\) | \(65<t\le70\) | \(70<t\le80\) | \(80<t\le100\) | \(100<t\le150\) |
|---|---|---|---|---|---|
| Block height (cm) | 5 |
(f) Complete the height table. [3]

0580 P22 - Jun 2016 - Q20 - 4 marks
Deborah records the number of minutes late, \(t\), for trains arriving at a station. The histogram shows the data.

(a) Find the number of trains recorded. [2]
(b) Calculate the percentage that arrived more than 10 minutes late. [2]

0580 P23 - Nov 2016 - Q22 - 4 marks
The table describes the masses of 200 bananas. Complete the histogram column heights.
| Mass m (g) | \(90<m\le110\) | \(110<m\le120\) | \(120<m\le125\) | \(125<m\le140\) |
|---|---|---|---|---|
| Frequency | 40 | 70 | 60 | 30 |
| Histogram height (cm) | 6 |
Complete the table. [4]

0580 P42 - Mar 2015 - Q9 - 9 marks
Heights of 40 children:
| Height h (cm) | \(120<h\le130\) | \(130<h\le140\) | \(140<h\le144\) | \(144<h\le150\) | \(150<h\le170\) |
|---|---|---|---|---|---|
| Frequency | 3 | 14 | 4 | 6 | 13 |
(a) Write the class interval containing the median. [1]
(b) Estimate the mean height. [4]

(c) Complete the histogram. [4]


0580 P42 - Jun 2015 - Q7 - 9 marks
50 students estimate the mass M grams of sweets in a jar:
| M (grams) | \(0<M\le200\) | \(200<M\le300\) | \(300<M\le350\) | \(350<M\le400\) | \(400<M\le500\) |
|---|---|---|---|---|---|
| Frequency | 5 | 9 | 18 | 12 | 6 |
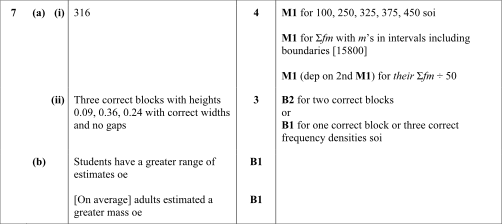
(a(i)) Estimate the mean. [4]

(a(ii)) Complete the histogram. [3]

(b) 50 adults also estimate the mass, as shown. Use the histograms to give two comparisons between the students’ and adults’ distributions. [2]

0580 P43 - Jun 2015 - Q4 - 7 marks
Times t minutes for 200 students to complete an IGCSE paper:
| t (min) | \(40<t\le60\) | \(60<t\le70\) | \(70<t\le75\) | \(75<t\le90\) |
|---|---|---|---|---|
| Frequency | 10 | 50 | 80 | 60 |
(a) Use mid-interval values to estimate the mean time. [3]

(b) Draw a histogram. [4]


0580 P43 - Nov 2015 - Q6 - 13 marks
The masses m grams of 160 apples are:
| m (g) | \(30<m\le80\) | \(80<m\le100\) | \(100<m\le120\) | \(120<m\le200\) |
|---|---|---|---|---|
| Frequency | 50 | 30 | 40 | 40 |
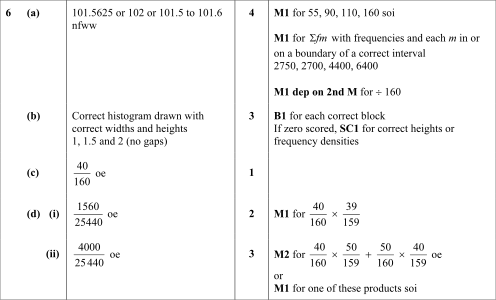
(a) Estimate the mean. [4]

(b) Complete the histogram. [3]
(c) Find the probability that a randomly chosen apple has mass more than 120 g. [1]
Two apples are chosen without replacement. Find the probability that:
(d(i)) both have mass more than 120 g; [2]
(d(ii)) one has mass more than 120 g and one has mass 80 g or less. [3]

0580 P42 - Jun 2014 - Q7 - 9 marks

(a(i)) Show that 12 apples have mass 70 < m ≤ 100 g. [1]
(a(ii)) Estimate the mean mass of all 39 apples. [5]
(b) 20 oranges have mean mass 70 g. One is eaten; the remaining 19 have mean 70.5 g. Find the mass eaten. [3]

0580 P43 - Jun 2014 - Q2 - 9 marks

90 people were asked how much money they gave to charity in one month.
| Amount (\$x) | 0 < x ≤ 10 | |||||
|---|---|---|---|---|---|---|
| Frequency | 4 |
(a) Complete the frequency table for the six histogram columns. [5]
(b) Estimate the mean amount. [4]

0580 P42 - Nov 2014 - Q3 - 9 marks
50 chefs’ omelette cooking times are recorded.
| Time t (s) | 20–25 | 25–30 | 30–35 | 35–40 | 40–45 | 45–50 |
|---|---|---|---|---|---|---|
| Frequency | 2 | 6 | 7 | 19 | 9 | 7 |
(a) Give the modal interval. [1]
(b) Estimate the mean, showing working. [4]
| Time t (s) | 20 < t ≤ 35 | 35 < t ≤ 40 | 40 < t ≤ 50 |
|---|---|---|---|
| Frequency |
(c(i)) Complete the combined table. [1]

(c(ii)) Draw a histogram for the combined table. [3]


0580 P41 - Jun 2013 - Q5 - 8 marks
The table gives heights of 42 students.
| Height (cm) | \(150<h\le160\) | \(160<h\le165\) | \(165<h\le180\) | \(180<h\le190\) |
|---|---|---|---|---|
| Frequency | 5 | 9 | 18 | 10 |
(a) Use mid-interval values to estimate the mean height, showing working. [3]
(b) Give the interval containing the lower quartile. [1]

(c) Complete the histogram; one column is already drawn. [4]


0580 P41 - Nov 2013 - Q7 - 18 marks
120 students answer a question. The time t seconds is measured.
| Time (s) | \(0<t\le10\) | \(10<t\le20\) | \(20<t\le30\) | \(30<t\le40\) | \(40<t\le50\) | \(50<t\le60\) |
|---|---|---|---|---|---|---|
| Frequency | 6 | 44 | 40 | 14 | 10 | 6 |
(a) Estimate the mean time. [4]
| Time | \(t\le10\) | \(t\le20\) | \(t\le30\) | \(t\le40\) | \(t\le50\) | \(t\le60\) |
|---|---|---|---|---|---|---|
| Cumulative frequency | 6 | … | … | 104 | … | 120 |
(b(i)) Complete the cumulative frequency table. [2]

(b(ii)) Draw the cumulative frequency diagram. [3]
(b(iii)) Use it to find the median, lower quartile and 60th percentile. [4]
| Time (s) | \(0<t\le20\) | \(20<t\le30\) | \(30<t\le60\) |
|---|---|---|---|
| Frequency | … | 40 | … |
(c(i)) Complete the new frequency table. [2]

(c(ii)) Complete the histogram. [3]

0580 P43 - Nov 2013 - Q5 - 15 marks
80 students report their internet use in one day.
| Time (h) | \(0<t\le1\) | \(1<t\le2\) | \(2<t\le3\) | \(3<t\le5\) | \(5<t\le7\) | \(7<t\le10\) |
|---|---|---|---|---|---|---|
| Frequency | 15 | 11 | 10 | 19 | 13 | 12 |
(a(i)) Estimate the mean time. [4]

(a(ii)) Complete the histogram. [4]
On any day, Chaminda uses the internet with probability 3/5 and Niluka with probability 3/4.

(b(i)) Complete the tree. [2]
(b(ii)) Find the probability that at least one uses the internet. [3]
(b(iii)) Find the probability that Chaminda uses the internet on three consecutive days. [2]


0580 P23 - Jun 2012 - Q7 - 2 marks
Complete u and v in the table.
| Height (cm) | \(0<h\le10\) | \(10<h\le15\) | \(15<h\le30\) |
|---|---|---|---|
| Frequency | 25 | u | 9 |
| Frequency density | 2.5 | 4.8 | v |

0580 P41 - Jun 2012 - Q5 - 15 marks
Felix records the journey times of 80 motorists.

(a(i)) Find the median. [1]
(a(ii)) Find the upper quartile. [1]
(a(iii)) Find the interquartile range. [1]
(b) Find the number whose journey took more than 5 hours but no more than 7. [1]
| Time (h) | \(0<t\le2\) | \(2<t\le3\) | \(3<t\le4\) | \(4<t\le5\) | \(5<t\le6\) | \(6<t\le8\) |
|---|---|---|---|---|---|---|
| Frequency | 20 | 25 | 18 | … | … | … |
(c(i)) Complete the frequency table. [2]
(c(ii)) Estimate the mean journey time. [4]
(d) Draw a histogram for the table, labelling both axes. [5]


0580 P23 - Nov 2012 - Q12 - 2 marks
| Mass m (kg) | \(0<m\le0.5\) | \(0.5<m\le1.5\) | \(1.5<m\le3\) |
|---|---|---|---|
| Frequency | 20 | 18 | 9 |
| Frequency density | 18 |

0580 P42 - Nov 2012 - Q5 - 12 marks
A farmer records masses of 158 potatoes.
| Mass m (g) | \(0<m\le40\) | \(40<m\le80\) | \(80<m\le120\) | \(120<m\le160\) | \(160<m\le200\) | \(200<m\le240\) |
|---|---|---|---|---|---|---|
| Frequency | 6 | 10 | 28 | 76 | 22 | 16 |
(a) Estimate the mean mass, showing working. [4]
| Mass m (g) | \(0<m\le80\) | \(80<m\le200\) | \(200<m\le240\) |
|---|---|---|---|
| Frequency | 16 |
(b(i)) Complete the regrouped frequency table. [2]

(b(ii)) Complete the histogram for the regrouped table. [3]
(c) 15 potatoes have mean mass 136 g. Three more have mean mass 130 g. Find the combined mean. [3]


0580 P41 - Jun 2010 - Q6 - 7 marks
| Mass m (g) | \(10<m\le20\) | \(20<m\le40\) | \(40<m\le50\) |
|---|---|---|---|
| Frequency | 10 | 30 | 20 |
(a) Estimate the mean mass of the 60 potatoes. [4]
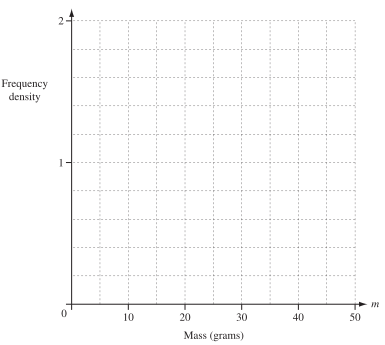
(b) Draw an accurate histogram. [3]


0580 P43 - Jun 2010 - Q7 - 13 marks
| Books | 11 | 12 | 13 | 14 | 15 | 16 |
|---|---|---|---|---|---|---|
| Members | 35 | 28 | 22 | 18 | 14 | 9 |
(a) For these 126 members, find the mode, median and mean number of books borrowed. [6]

| Hours h | \(0<h\le5\) | \(5<h\le8\) | \(8<h\le10\) | \(10<h\le12\) | \(12<h\le16\) | \(16<h\le20\) |
|---|---|---|---|---|---|---|
| Frequency | 20 | 24 | 10 |
(b)(i) Complete the frequency table from the histogram. [3]
(b)(ii) Estimate the mean weekly reading time, showing working. [4]

0580 P43 - Nov 2010 - Q10 - 13 marks
(a) Find both possible sets of six integers with mode 8, median 9, mean 10, smallest integer greater than 6 and largest 16. [5]
Ahmed sells 160 oranges with these masses:
| Mass m (g) | \(50<m\le80\) | \(80<m\le90\) | \(90<m\le100\) | \(100<m\le120\) | \(120<m\le150\) |
|---|---|---|---|---|---|
| Frequency | 30 | 35 | 40 | 40 | 15 |
(b)(i) Estimate their mean mass. [4]

(b)(ii) Complete the histogram. [4]

