0580 P42 - Mar 2026 - Q18 - 10 marks
The table gives the delay time of each of 90 trains.
| Time (m minutes) | \(0<m\le10\) | \(10<m\le30\) | \(30<m\le45\) | \(45<m\le75\) |
|---|---|---|---|---|
| Frequency | 13 | 35 | 36 | 6 |
(a) Calculate an estimate of the mean delay. [4]
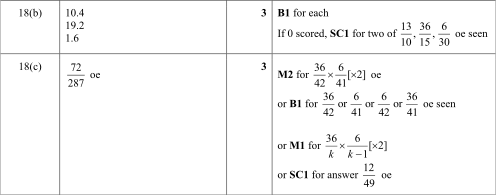
(b) A histogram is drawn. The bar for \(10<m\le30\) is 14 cm high. Calculate the heights for the other three intervals. [3]
(c) Two trains with delays of more than 30 minutes are chosen at random. Find the probability that just one is delayed for 45 minutes or less. [3]

0580 P41 - Jun 2026 - Q12 - 7 marks
(a) The four values \(200,51,2n,n+1\) have mean \(3n\). Find n. [3]
The table gives the masses of 200 boxes.
| Mass m (g) | \(0<m\le20\) | \(20<m\le40\) | \(40<m\le60\) | \(60<m\le80\) |
|---|---|---|---|---|
| Frequency | 29 | 67 | 55 | 49 |
(b) Estimate the mean mass. [4]
0580 P42 - Jun 2026 - Q2 - 5 marks
A librarian records the numbers of books borrowed by 40 students.
| Books | 0 | 1 | 2 | 3 | 4 | 5 |
|---|---|---|---|---|---|---|
| Frequency | 5 | 14 | 10 | 8 | 1 | 2 |
(a) Find the mode. [1]
(b) Find the median. [1]
(c) Find the mean. [3]

0580 P43 - Jun 2026 - Q9 - 5 marks
The table shows the test marks of 100 students.
| Mark x | \(0<x\le20\) | \(20<x\le40\) | \(40<x\le60\) | \(60<x\le80\) | \(80<x\le100\) |
|---|---|---|---|---|---|
| Frequency | 4 | 20 | 31 | 34 | 11 |
(a) State the modal class. [1]
(b) Estimate the mean. [4]

0580 P22 - Jun 2025 - Q13 - 11 marks
100 students solve a puzzle. The table gives their times.
| Time t (seconds) | \(20<t\le40\) | \(40<t\le60\) | \(60<t\le100\) |
|---|---|---|---|
| Frequency | 30 | 40 | 30 |
(a(i)) Estimate the mean time. [4]

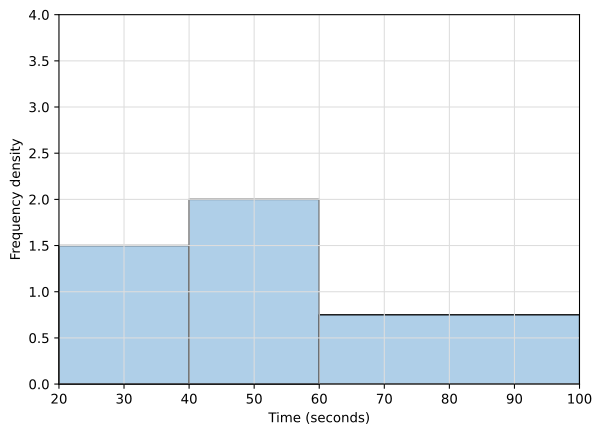
(a(ii)) Complete the histogram. [2]
80 adults solve the same puzzle. Their cumulative frequencies are shown below.
| Time t (seconds) | ≤20 | ≤40 | ≤60 | ≤80 | ≤100 | ≤120 |
|---|---|---|---|---|---|---|
| Cumulative frequency | 0 | 12 | 36 | 60 | 74 | 80 |
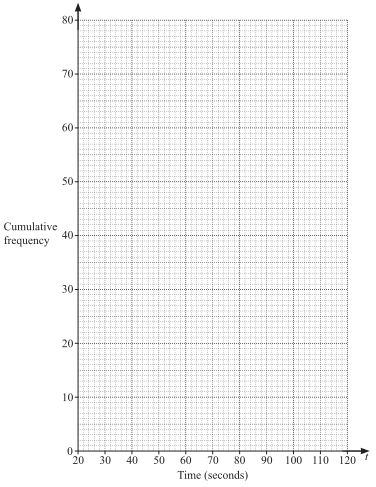
(b(i)) Draw the cumulative frequency diagram. [3]
(b(ii)(a)) Estimate the median from the diagram. [1]
(b(ii)(b)) Estimate the lower quartile from the diagram. [1]


0580 P41 - Jun 2025 - Q15 - 9 marks
The heights of 140 basketball players are recorded.
| Height h (cm) | \(160<h\le180\) | \(180<h\le185\) | \(185<h\le190\) | \(190<h\le200\) | \(200<h\le210\) |
|---|---|---|---|---|---|
| Frequency | 7 | 12 | 31 | 70 | 20 |
(a) Estimate the mean height. [4]
(b) Two players are chosen at random. Find the probability that both have height greater than 190 cm and at most 200 cm. [2]

(c) Complete the histogram. [3]


0580 P41 - Nov 2025 - Q16 - 4 marks
The table gives the heights of 50 plants.
| Height (cm) | \(5<h\le10\) | \(10<h\le12\) | \(12<h\le20\) |
|---|---|---|---|
| Frequency | 3 | 24 | 23 |
Estimate the mean height. [4]

0580 P22 - Mar 2024 - Q17 - 4 marks
The heights of 200 people are recorded.
| Height (cm) | \(100<h\le120\) | \(120<h\le130\) | \(130<h\le150\) | \(150<h\le190\) |
|---|---|---|---|---|
| Frequency | 32 | 55 | 64 | 49 |
Estimate the mean height. [4]

0580 P41 - Jun 2024 - Q4 - 18 marks
Cars take the times shown to travel 195 m.

(a(i)) Find the median time. [1]
(a(ii)) Find the interquartile range. [1]
(a(iii)) Find the difference between the fastest and slowest average speeds, in km/h. [5]
Distances 80 other cars can travel with a full tank:
| d(km) | \(250<d\le300\) | \(300<d\le400\) | \(400<d\le420\) | \(420<d\le450\) | \(450<d\le500\) |
|---|---|---|---|---|---|
| Frequency | 7 | 13 | 19 | 21 | 20 |
(b(i)) State the class interval containing the median. [1]
(b(ii)) Estimate the mean distance. [4]
(b(iii)) In a histogram, the first bar is 2.8 cm high. Find the heights for \(300<d\le400\), \(400<d\le420\) and \(420<d\le450\). [3]
(b(iv)) Two cars are chosen at random. Find P(one can travel more than 450 km and the other not more than 300 km). [3]


0580 P43 - Jun 2024 - Q3 - 11 marks
A die is rolled 60 times.
| Score | 1 | 2 | 3 | 4 | 5 | 6 |
|---|---|---|---|---|---|---|
| Frequency | 10 | 6 | 11 | 13 | 14 | 6 |
(a) Find the mode, median and mean. [5]
The speeds of 100 cars:
| v(km/h) | \(20<v\le30\) | \(30<v\le50\) | \(50<v\le75\) |
|---|---|---|---|
| Frequency | 10 | 72 | 18 |
(b(i)) Estimate the mean speed. [4]
(b(ii)) In a histogram the first bar is 3 cm high. Find the heights of the other two bars. [2]

0580 P23 - Nov 2024 - Q5 - 4 marks
20 students record the numbers of coins in their pockets.
| Coins | 0 | 1 | 2 | 3 | 4 | 5 | 6 |
|---|---|---|---|---|---|---|---|
| Frequency | 3 | 1 | 7 | 8 | 0 | 0 | 1 |
(a) Find the median. [1]
(b) Find the mean. [3]


0580 P42 - Mar 2023 - Q2 - 15 marks
100 students take a reaction test.
| Reaction time (seconds) | 6 | 7 | 8 | 9 | 10 | 11 |
|---|---|---|---|---|---|---|
| Number of students | 3 | 32 | 19 | 29 | 11 | 6 |
The box plot shows heights of some students.

The masses of 200 potatoes are also measured.
| Mass \(m\) (g) | \(50<m\le110\) | \(110<m\le200\) | \(200<m\le300\) |
|---|---|---|---|
| Frequency | 60 | 99 | 41 |

(a(i)) Write down the modal reaction time. [1]
(a(ii)) Find the median reaction time. [1]
(a(iii)) Calculate the mean reaction time. [3]
(a(iv)) Two students are chosen at random without replacement. Find the probability that both reaction times are at least 9 seconds. [2]
(b(i)) Find the range of the heights. [1]
(b(ii)) Find the interquartile range of the heights. [1]
(c(i)) Calculate an estimate of the mean potato mass. [4]
(c(ii)) Complete the histogram. [2]


0580 P41 - Jun 2023 - Q3 - 13 marks
The masses of 1000 eggs are recorded.
| Mass \(m\) (g) | \(40<m\le50\) | \(50<m\le56\) | \(56<m\le64\) | \(64<m\le70\) |
|---|---|---|---|---|
| Frequency | 126 | 520 | 154 | 200 |
(a(i)) Estimate the mean mass. [4]
(a(ii)) An egg is chosen at random. Find the probability its mass is greater than 56 g, as a fraction in simplest form. [2]
(b(i)) A farmer makes a profit of \$24 730. Write this correct to 2 significant figures. [1]
(b(ii)) Write \$24 730 in standard form. [1]
(c(i)) A farm has 500 hens, to the nearest 10. The mean eggs per hen in a year is 320, to the nearest 20. Calculate an upper bound for the total eggs in that year. [3]
(c(ii)) Another farm has 800 hens, to the nearest 20. Calculate a lower bound for the difference between the numbers of hens on the farms. [2]

0580 P42 - Nov 2023 - Q2 - 11 marks
Daisy records 50 homework marks.
| Mark | 15 | 16 | 17 | 18 | 19 | 20 |
|---|---|---|---|---|---|---|
| Frequency | 1 | 3 | 19 | 11 | 10 | 6 |
Ed’s 11 test scores: \(21,33,20,25,21,34,22,21,20,30,18\).
(a(i)) Find Daisy’s range. [1]
(a(ii)) Find her mode. [1]
(a(iii)) Find her median. [1]
(a(iv)) Find her mean. [3]
(b(i)) Draw a stem-and-leaf diagram for Ed, using stems 1, 2 and 3, with key \(2\mid5\) means 25. [2]
(b(ii)) Find Ed’s median. [1]
(b(iii)) Find Ed’s interquartile range. [2]

0580 P22 - Mar 2021 - Q17 - 3 marks
Number of books in school bags:
| Books | 5 | 6 | 7 | 8 | 9 | 10 |
|---|---|---|---|---|---|---|
| Frequency | 4 | 5 | x | 11 | 7 | 5 |
The mean is 7.6. Find x. [3]

0580 P43 - Nov 2021 - Q8 - 15 marks
Jean asks 600 people for their favourite sport.

(a(i)) Show that 100 choose tennis. [1]
(a(ii)) Find how many choose rugby. [2]
(a(iii)) 125 choose cricket; the rest choose swimming. Complete the pie chart. [2]
(b) Plant heights: minimum 0.6 cm, range 8.1 cm, median 5.2 cm, lower quartile 3.4 cm, IQR 4.1 cm. Draw a box-and-whisker plot. [3]
(c(i)) For the dice results below, find the range. [1]
(c(ii)) Find the mode. [1]
(c(iii)) Find the median. [1]
(d) Estimate the mean time for the grouped data below. [4]
| Dice score | 1 | 2 | 3 | 4 | 5 | 6 |
|---|---|---|---|---|---|---|
| Frequency | 16 | 25 | 17 | 19 | 8 | 15 |
| Time (s) | \(10<t\le20\) | \(20<t\le25\) | \(25<t\le30\) | \(30<t\le50\) | \(50<t\le80\) |
|---|---|---|---|---|---|
| Frequency | 2 | 8 | 12 | 16 | 12 |


0580 P22 - Mar 2020 - Q6 - 3 marks
| Mark | 5 | 6 | 7 | 8 | 9 | 10 |
|---|---|---|---|---|---|---|
| Frequency | 8 | 5 | 11 | 7 | 5 | 4 |
The table shows marks scored by 40 students. Calculate the mean mark. [3]

0580 P23 - Jun 2020 - Q15 - 4 marks
Each of 60 people gives \$x to a charity.
| \(0<x\le20\) | \(20<x\le25\) | \(25<x\le35\) | \(35<x\le50\) | \(50<x\le100\) |
|---|---|---|---|---|
| 21 | 16 | 6 | 10 | 7 |
The table gives donation intervals and their frequencies. Estimate the mean donation. [4]

0580 P41 - Nov 2020 - Q3 - 11 marks

(a) The box plots show weekly exercise times. For each statement, say agree or disagree and give a reason: “On average, women spent less time exercising than men”; “Women’s times show less variation than men’s times”. [2]
Weekly exercise times of 100 children:
| Time (minutes) | \(0<t\le60\) | \(60<t\le100\) | \(100<t\le160\) | \(160<t\le220\) | \(220<t\le320\) |
|---|---|---|---|---|---|
| Frequency | 41 | 24 | 23 | 8 | 4 |
(b(i)) Estimate the mean time. [4]

(b(ii)(a)) Use the cumulative frequency graph to estimate the 60th percentile. [1]
(b(ii)(b)) Estimate how many children spent more than 3 hours exercising. [2]
(b(iii)) A histogram has bar height 10.8 cm for \(60<t\le100\). Find the height for \(160<t\le220\). [2]


0580 P42 - Mar 2019 - Q7 - 14 marks
20 students record pencil case mass p grams.
| Mass (g) | \(0<p\le50\) | \(50<p\le100\) | \(100<p\le125\) | \(125<p\le150\) | \(150<p\le200\) |
|---|---|---|---|---|---|
| Frequency | 2 | 5 | 4 | 6 | 3 |
(a(i)) Estimate the mean mass. [4]
(a(ii)) Complete cumulative frequencies at50,100,125,150,200 g. [2]
(a(iii)) Find the probability a randomly chosen case has mass greater than150 g. [1]
(b) Complete the histogram table for school bag mass m kg.
| Mass | \(0<m\le4\) | \(4<m\le6\) | \(6<m\le7\) | \(7<m\le10\) |
|---|---|---|---|---|
| Frequency | 32 | … | … | 42 |
| Bar height (cm) | 1.6 | 2 | 1.2 | 2.8 |
A reading marathon records books read:
| Books | 1 | 2 | 3 | 4 | 5 | 6 | 7 | 8 |
|---|---|---|---|---|---|---|---|---|
| Frequency | 2 | 2 | 16 | 10 | 9 | 4 | x | 2 |
(c(i)) Mean=4.28. Find x. [3]
(c(ii)) State the mode. [1]
(c(iii)) State the median. [1]

0580 P21 - Jun 2018 - Q23 - 6 marks
40 people were asked how many times they visited the cinema in one month.
| Cinema visits | 0 | 1 | 2 | 3 | 4 | 5 | 6 | 7 |
|---|---|---|---|---|---|---|---|---|
| Frequency | 5 | 5 | 6 | 6 | 7 | 3 | 6 | 2 |
(a(i)) Find the mode. [1]
(a(ii)) Calculate the mean. [3]
(b) Omar draws a pie chart. Calculate the sector angle for those visiting 5 times. [2]

0580 P43 - Jun 2018 - Q3 - 16 marks
Physics and chemistry marks for 12 students:

(a(i)) State the type of correlation. [1]
(a(ii)) Draw a line of best fit. [1]
(a(iii)) Estimate the chemistry mark for a student whose physics mark is4. [1]
Absences of 24 students:
| Days absent | 0 | 1 | 2 | 3 | 4 | 5 |
|---|---|---|---|---|---|---|
| Frequency | 10 | 8 | 3 | 2 | 0 | 1 |
(b) Find the mode, median and mean. [5]
Eggs sold in a shop:
| Size | Small | Medium | Large |
|---|---|---|---|
| Mass m grams | \(46<m\le52\) | \(52<m\le62\) | \(62<m\le80\) |
| Number sold | 78 | 180 | 162 |
(c(i)) Estimate the mean mass. [4]

(c(ii)) Draw a histogram. [4]


0580 P22 - Mar 2016 - Q16 - 4 marks
Raj measures the heights of 70 plants. The table summarises the measurements.
| Height \(h\) (cm) | \(10<h\le20\) | \(20<h\le40\) | \(40<h\le50\) | \(50<h\le60\) | \(60<h\le90\) |
|---|---|---|---|---|---|
| Frequency | 7 | 15 | 27 | 13 | 8 |
Estimate the mean height. [4]

0580 P41 - Jun 2016 - Q3 - 15 marks
200 students estimate the volume \(V\) m³ of a classroom. The cumulative frequency graph shows their results.

Find:
(a(i)) the median; [1]
(a(ii)) the lower quartile; [1]
(a(iii)) the interquartile range; [1]
(a(iv)) the number who estimate a volume greater than 300 m³. [2]
The same students estimate the total window area \(A\) m²:
| Area (m²) | \(20<A\le60\) | \(60<A\le100\) | \(100<A\le150\) | \(150<A\le250\) |
|---|---|---|---|---|
| Frequency | 32 | 64 | 80 | 24 |
(b(i)) Estimate the mean, showing all working. [4]

(b(ii)) Complete the histogram from the table. [4]
(b(iii)) Two students are chosen at random. Find the probability that both estimates are greater than 100 m². [2]


0580 P43 - Jun 2016 - Q4 - 13 marks
A parking machine rejects a coin with probability 0.05.
(a(i)) Adhira inserts two coins. Find the probability that both are rejected. [2]
(a(ii)) Find the probability that at least one is accepted. [1]
(b) Raj inserts four coins. Find the probability that exactly one is rejected. [3]
The daily receipts over 200 days are:
| Amount \(a\) (\$) | \(200<a\le250\) | \(250<a\le300\) | \(300<a\le350\) | \(350<a\le400\) | \(400<a\le450\) | \(450<a\le500\) |
|---|---|---|---|---|---|---|
| Frequency | 13 | 19 | 27 | 56 | 62 | 23 |
(c) Estimate the mean daily receipts. [4]
The histogram shows parking times for 200 cars.

(d(i)) Find the number parked for 100 minutes or less. [1]
(d(ii)) Find the percentage parked for more than 250 minutes. [2]


0580 P22 - Nov 2015 - Q22 - 6 marks
Pets owned by 24 students:
| Number of pets | 0 | 1 | 2 | 3 | 4 | 5 | 6 |
|---|---|---|---|---|---|---|---|
| Frequency | 1 | 2 | 3 | 5 | 7 | 3 | 3 |
(a) Find the mean number of pets. [3]
(b) Jennifer joins. The mean for all 25 is now 3.44. Find her number of pets. [3]

0580 P43 - Nov 2014 - Q9 - 16 marks
| Litres | 16 | 17 | 18 | 19 | 20 |
|---|---|---|---|---|---|
| Motorists | 11 | 10 | p | 4 | 8 |
Daily fuel use is recorded to the nearest litre.
(a(i)) The table mean is 17.7 litres. Find p. [4]
(a(ii)) Find the median. [1]
Manuel drives 320 km; fuel costs \$1.28 per 6.4 km.
(b(i)) Find fuel cost. [2]
(b(ii)) His car uses 60 litres per 480 km. Find litres for 320 km. [2]
(b(iii)) Find cost per litre. [2]
(c) Ellie travels at 30 m/s to the nearest 5 m/s for 5 minutes to the nearest 10 seconds. Find the upper bound of distance in kilometres. [5]


0580 P22 - Jun 2013 - Q20 - 7 marks
The heights h metres of 200 trees are measured.
| Height (m) | \(2<h\le6\) | \(6<h\le10\) | \(10<h\le13\) | \(13<h\le17\) | \(17<h\le19\) | \(19<h\le20\) |
|---|---|---|---|---|---|---|
| Frequency | 23 | 47 | 45 | 38 | 32 | 15 |
(a) Give the interval containing the median height. [1]
(b) Estimate the mean height. [4]
(c) Complete the cumulative frequencies at 6, 10, 13, 17, 19 and 20 m. The first is 23. [2]

0580 P41 - Jun 2011 - Q8 - 15 marks
| Mark | 11 | 12 | 13 | 14 | 15 | 16 | 17 | 18 |
|---|---|---|---|---|---|---|---|---|
| Frequency | 10 | 8 | 16 | 11 | 7 | 8 | 6 | 9 |
(a) Find the mean, median and mode. [6]
| Time t (min) | \(0<t\le10\) | \(10<t\le20\) | \(20<t\le30\) | \(30<t\le40\) | \(40<t\le50\) | \(50<t\le60\) |
|---|---|---|---|---|---|---|
| Frequency | 2 | 19 | 16 | 14 | 15 | 9 |
| Regrouped time | \(0<t\le20\) | \(20<t\le40\) | \(40<t\le50\) | \(50<t\le60\) |
|---|---|---|---|---|
| Frequency | 9 |
(b)(i) Complete Cara’s regrouped frequency table. [2]
| Time interval | 0–20 | 20–40 | 40–50 | 50–60 |
|---|---|---|---|---|
| Width | 10 | |||
| Frequency density | 0.9 |
(b)(ii) Complete the widths and frequency densities for a histogram. [3]
(c) Ten students revise for 2.5 h, twelve for 3 h and n for 4 h. Their mean is 3.1 h. Find n, showing working. [4]

0580 P41 - Jun 2010 - Q2 - 7 marks
Family sizes for 40 students:
| Number of people | 2 | 3 | 4 | 5 | 6 | 7 |
|---|---|---|---|---|---|---|
| Frequency | 1 | 1 | 17 | 12 | 6 | 3 |
(a)(i) Find the mode. [1]
(a)(ii) Find the median. [1]
(a)(iii) Find the mean. [3]
(b) Another n students have mean family size 3. Express the combined mean for all 40+n students in terms of n. [2]
