0580 P22 - Jun 2026 - Q1 - 4 marks
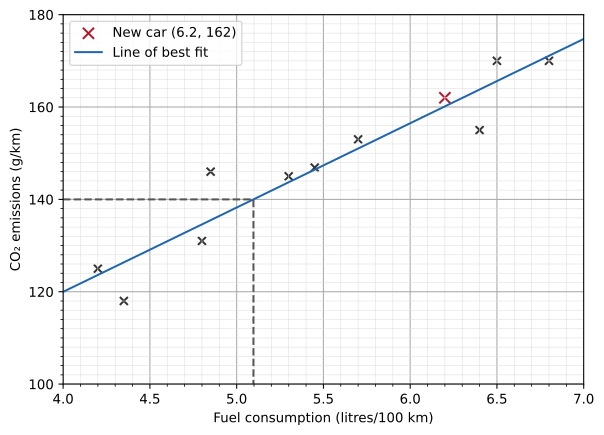
The scatter diagram gives fuel consumption and carbon dioxide emissions for 10 cars.

(a) Plot the point for another car, with fuel consumption \(6.2\text{ litres}/100\text{ km}\) and emissions \(162\text{ g/km}\). [1]
(b) State the type of correlation. [1]
(c) Draw a line of best fit. [1]
(d) Use your line to estimate the fuel consumption of a car with emissions \(140\text{ g/km}\). [1]

0580 P43 - Jun 2026 - Q6 - 5 marks
The table shows the study time and number of test errors for 9 students.
| Study time (minutes) | 5 | 8 | 11 | 15 | 18 | 21 | 25 | 27 | 31 |
|---|---|---|---|---|---|---|---|---|---|
| Errors | 35 | 34 | 30 | 25 | 24 | 20 | 13 | 9 | 6 |
(a) Complete the scatter diagram. The first 6 points are plotted. [2]

(b) State the type of correlation. [1]
(c) Draw a line of best fit. [1]
(d) Use your line to estimate the number of errors for a student who studies for 13 minutes. [1]


0580 P42 - Mar 2025 - Q7 - 5 marks
The table shows the ages and masses of 10 babies.
| Age (weeks) | 9 | 12 | 15 | 2 | 5 | 6 | 9 | 7 | 1 | 11 |
|---|---|---|---|---|---|---|---|---|---|---|
| Mass (kg) | 4.3 | 5.8 | 6.2 | 3.0 | 3.9 | 4.0 | 4.6 | 4.5 | 2.5 | 5.3 |
(a) Complete the scatter diagram. The first six points are plotted. [2]

(b) State the type of correlation. [1]
(c) Draw a line of best fit. [1]
(d) Estimate the mass of a 14-week-old baby from your line. [1]


0580 P23 - Jun 2025 - Q4 - 1 mark
The number of ice creams sold increases as temperature rises. Name this type of correlation. [1]

0580 P23 - Nov 2025 - Q6 - 4 marks
The scatter diagram compares the values of ten paintings in 2005 and 2025, in thousands of dollars.
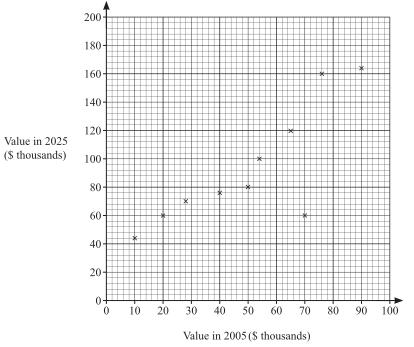
(a) Circle the point for a painting whose 2025 value is lower than expected. [1]
(b) Plot another painting worth \(\$75000\) in 2005 and \(\$140000\) in 2025. [1]
(c) How many of the original paintings were worth less than \(\$53000\) in 2005? [1]
(d) State the type of correlation. [1]


0580 P22 - Mar 2024 - Q7 - 1 mark
As temperature increases, the number of people swimming increases. State the type of correlation. [1]

0580 P22 - Nov 2024 - Q4 - 5 marks
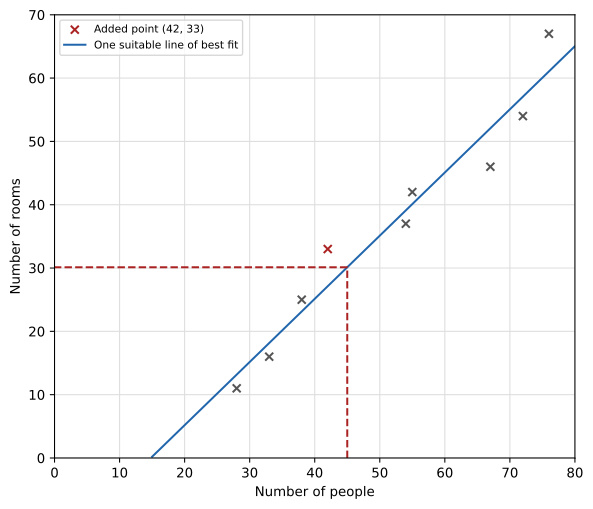
The scatter diagram shows the number of rooms and people in each of eight buildings.

(a) One building has 67 rooms. How many people are in it? [1]
(b) Another building has 42 people and 33 rooms. Plot this point. [1]
(c(i)) Draw a line of best fit. [1]
(c(ii)) Estimate the number of rooms in a building with 45 people. [1]
(d) State the type of correlation. [1]

0580 P21 - Nov 2023 - Q6 - 3 marks
The scatter diagram gives salary and car value for 10 people working in an office.

(a) Find the car value for the person with salary \$28 000. [1]
(b) Plot another person with salary \$54 000 and car value \$6100. [1]
(c) State the type of correlation. [1]

0580 P22 - Mar 2022 - Q11 - 1 mark
As temperature increases, people eat more ice cream. What type of correlation is described? [1]

0580 P23 - Jun 2022 - Q7 - 4 marks

(a) Eight days are plotted. On the day with 410 visitors, find total spending in dollars. [1]
(b) Plot the ninth day: 175 visitors spend \$9000. [1]
(c) Draw a line of best fit. [1]
(d) On day ten, spending is \$22000. Estimate the visitor count. [1]


0580 P22 - Mar 2021 - Q5 - 1 mark
Fewer bowls of hot soup are sold as temperature rises. State the type of correlation. [1]

0580 P22 - Jun 2021 - Q5 - 2 marks


(a) Choose the correct statement: no correlation; too few points to tell whether there is correlation; negative correlation; positive correlation. [1]
(b) Each diagram A–D uses the same data. Which has the most appropriate line of best fit? [1]

0580 P21 - Jun 2020 - Q3 - 4 marks
The scatter diagram shows class marks on two mathematics tests.

(a) State the highest mark on test 1. [1]
(b) State the type of correlation. [1]
(c) Draw a line of best fit. [1]
(d) Hamish scored 40 on test 1 but missed test 2. Use your line to estimate his test 2 mark. [1]


0580 P21 - Nov 2020 - Q4 - 5 marks
Aisha records distances and average running speeds in the scatter diagram.

(a) Add the four runs.
| Distance(km) | 4.2 | 5.7 | 7.1 | 8.8 |
|---|---|---|---|---|
| Average speed(km/h) | 13.4 | 11.8 | 9.8 | 8.3 |
(b) State the correlation. [1]
(c) Draw a line of best fit. [1]
(d) Estimate average speed for a6 km run. [1]


0580 P23 - Jun 2019 - Q8 - 2 marks
The scatter diagram shows people and phones in each of 8 buildings.

(a) A building contains 42 people. Write down its number of phones. [1]
(b) State the type of correlation. [1]

0580 P23 - Nov 2019 - Q16 - 4 marks
Ten athletes compete in the 100 metre race and triple jump. Their results are shown.
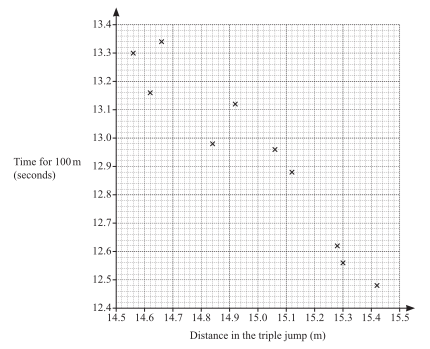
(a) One athlete jumps 15.12 m. Write down his time for the 100 metre race. [1]
(b) Plot the additional athletes: (14.74 m,13.2 s) and (15.2 m,12.76 s). [1]
(c) Draw a line of best fit. [1]
(d) State the type of correlation. [1]


0580 P22 - Mar 2018 - Q1 - 1 mark
“We eat more ice cream as the temperature rises.” What type of correlation is this? [1]

0580 P22 - Jun 2018 - Q21 - 4 marks
The scatter diagram shows the values (thousands of dollars) of eight houses in 1996 and 2016.

(a) A house was worth \$70 000 in 1996. State its value in 2016. [1]
| Value in 1996 (\$ thousands) | 40 | 80 |
|---|---|---|
| Value in 2016 (\$ thousands) | 80 | 150 |
(b) Plot these two further houses. [1]
(c) Draw a line of best fit. [1]
(d) Estimate the 2016 value of a house worth \$50 000 in 1996. [1]


0580 P21 - Nov 2018 - Q3 - 1 mark

State the type of correlation. [1]

0580 P21 - Jun 2017 - Q16 - 4 marks
Six students revised for a test. The scatter diagram gives revision time and test mark.

| Time (hours) | Mark |
|---|---|
| 4.5 | 33 |
| 6.5 | 35 |
(a) Plot these two additional students on the diagram. [1]
(b) State the type of correlation. [1]
(c) Draw a line of best fit. [1]
(d) Estimate the mark for a student revising for 5.5 hours. [1]


0580 P22 - Mar 2015 - Q1 - 1 mark
Hot drink sales in a café decrease as the weather becomes warmer. What type of correlation is shown? [1]

0580 P22 - Jun 2013 - Q17 - 4 marks
A café records these values over one week.
| Air temperature (°C) | 18 | 23 | 19 | 23 | 24 | 25 | 20 |
|---|---|---|---|---|---|---|---|
| Hot drinks sold | 12 | 8 | 13 | 10 | 9 | 7 | 12 |

(a) Draw a scatter diagram. [2]
(b) State the type of correlation. [1]
(c) Draw a line of best fit. [1]


0580 P42 - Jun 2012 - Q1 - 10 marks
The marks for 10 students are shown.
| Mathematics | 30 | 50 | 35 | 25 | 5 | 39 | 48 | 40 | 10 | 15 |
|---|---|---|---|---|---|---|---|---|---|---|
| English | 26 | 39 | 35 | 28 | 9 | 37 | 45 | 33 | 16 | 12 |

(a(i)) Complete the scatter diagram; four points are already plotted. [2]
(a(ii)) State the type of correlation. [1]
(a(iii)) Draw a line of best fit. [1]
(a(iv)) Ann scores 22 in Mathematics. Estimate her English mark using your line. [1]
(b) Show that the mean English mark is 28. [2]
(c) Two new students score the same English mark. The new mean for 12 students is 31. Find their marks. [3]


0580 P22 - Nov 2012 - Q16 - 4 marks
A company sends ten different questionnaires.
| Questionnaire | A | B | C | D | E | F | G | H | I | J |
|---|---|---|---|---|---|---|---|---|---|---|
| Sent | 100 | 125 | 150 | 140 | 70 | 105 | 100 | 90 | 120 | 130 |
| Replies | 24 | 30 | 35 | 34 | 15 | 25 | 22 | 21 | 30 | 31 |

(a) Complete the scatter diagram. The first two points are plotted. [2]
(b) Describe the correlation. [1]
(c) Draw a line of best fit. [1]


0580 P21 - Nov 2011 - Q12 - 4 marks

The diagram shows Mathematics and English test marks for 15 students.
(a) Describe the correlation. [1]
(b) The mean marks are 47.3 in Mathematics and 30.3 in English. Plot the mean point (47.3,30.3). [1]
(c)(i) Draw a line of best fit. [1]
(c)(ii) A student missed the English test and scored 45 in Mathematics. Use your line to estimate her English mark. [1]

