0580 P21 - Jun 2026 - Q5 - 3 marks
Hannah records her time spent swimming, running and cycling during four months. The composite bar chart gives her results.

(a) In which month does Hannah spend the most time running? [1]
(b) In May, her swimming time is 9 hours more than her cycling time. Find her swimming time in July. [2]

0580 P23 - Jun 2026 - Q2 - 4 marks
The table gives the favourite drinks of 60 students.
| Drink | Number of students | Pie chart angle |
|---|---|---|
| Tea | 24 | \(144^\circ\) |
| Chocolate | 4 | |
| Coffee | 32 |
(a) Complete the two missing angles. [2]
(b) Draw and label a pie chart representing this information. [2]


0580 P22 - Mar 2025 - Q11 - 10 marks
A company sells items on a website and in shops. The composite bar chart gives percentages for January, February and March.

(a) In April, \(17/20\) of sales were on the website. Draw the April bar. [2]
(b) February sales totalled \(\$3.5\) million. Find the value of shop sales. [3]
(c) Sales were \(\$6\) million in May and \(\$7.5\) million in June. Find the percentage increase. [3]
(d) Total 2024 sales were \(\$52\) million, an increase of \(30\%\) on 2023. Find total 2023 sales. [2]


0580 P22 - Nov 2025 - Q5 - 5 marks
The pie chart shows how 600 students travel to school.

(a) Find how many students walk. [2]
(b) 120 travel by car; all remaining students travel by bus. Complete the pie chart. [3]


0580 P22 - Mar 2024 - Q5 - 3 marks
A car park has 20 cars, of which 3 are blue.
(a) Find the blue-car sector angle in a pie chart. [2]
(b) A car is chosen at random. Find P(not blue). [1]

0580 P22 - Jun 2024 - Q3 - 3 marks
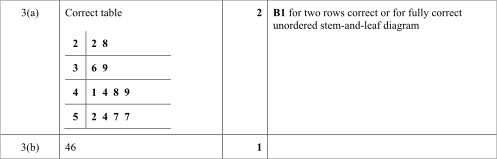
The numbers of pizzas delivered each month for a year are 48, 44, 39, 28, 57, 22, 36, 41, 54, 57, 49, 52.
(a) Complete the stem-and-leaf diagram, with stems 2, 3, 4, 5 and key 4 | 8 = 48 pizzas. [2]
| Stem | Leaves |
|---|---|
| 2 | … |
| 3 | … |
| 4 | … |
| 5 | … |
(b) Find the median. [1]
0580 P22 - Jun 2023 - Q3 - 3 marks
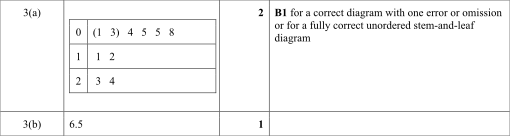
Stefan records his waiting times in minutes on ten days: \(1,3,12,5,4,23,5,24,11,8\).
| Stem | Leaf |
|---|---|
| 0 | 1 3 … |
| 1 | … |
| 2 | … |
Key: \(0\mid1\) represents 1 minute.
(a) Complete the ordered stem-and-leaf diagram. [2]
(b) Find the median. [1]
0580 P43 - Jun 2023 - Q2 - 8 marks
Anna records her daily numbers of text messages for 14 days: \(17,15,31,38,31,22,13,18,21,27,28,21,31,29\).
(a(i)) Draw a stem-and-leaf diagram with stems 1, 2 and 3. Include a key. [3]
(a(ii)) Find the median. [1]
(a(iii)) Find the mode. [1]
(a(iv)) Find the range. [1]
(b) A shop has 4 red and 8 grey phones. Anna and Pete each pick one phone at random without replacement. Find the probability both choose grey. [2]

0580 P21 - Nov 2023 - Q2 - 3 marks
Race times (minutes) for 15 people are shown in the stem-and-leaf diagram. Key: \(1\mid6\) represents 16 minutes.
| Stem | Leaves |
|---|---|
| 1 | 6 6 7 |
| 2 | 1 3 3 4 5 6 7 7 7 |
| 3 | 0 1 1 |
(a) Find the mode. [1]
(b) Find the range. [1]
(c) Find the median. [1]

0580 P23 - Nov 2023 - Q3 - 3 marks
Plant heights (cm) are shown below. Key \(10\mid4\) means 10.4 cm.
| Stem | Leaves |
|---|---|
| 10 | 4 8 |
| 11 | 1 3 4 6 |
| 12 | 2 3 6 9 |
| 13 | 2 6 9 |
(a) Find the median. [1]
(b) Find the mean. [2]

0580 P43 - Nov 2023 - Q2 - 11 marks
Monday bird counts are shown.
| Bird | Frequency | Sector angle |
|---|---|---|
| Goldfinch | 8 | 96° |
| Jay | 6 | |
| Starling | 11 | |
| Robin | 5 |

(a) Find the percentage that are Starlings. [2]
(b(i)) Complete the three missing sector angles. [2]
(b(ii)) Complete the pie chart. [2]
(c) On Tuesday the Goldfinch count is 262.5% more than on Monday. Find Tuesday’s count. [2]
(d(i)) There are about 1500 million birds in a region. Write this number in standard form. [1]
(d(ii)) The region has area 21.2 million square kilometres. Find the average number of birds per square kilometre. [2]


0580 P22 - Jun 2022 - Q2 - 2 marks
| Car colour | Black | White | Silver | Red |
|---|---|---|---|---|
| Count | 8 | 5 | 4 | 3 |
Find the red-car sector angle in a pie chart. [2]

0580 P23 - Jun 2022 - Q4 - 3 marks
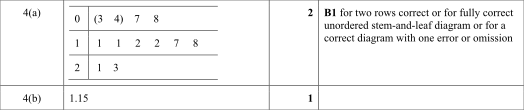
Parcel masses (kg): \(0.3,0.4,1.2,0.8,1.1,2.1,1.7,1.8,1.2,2.3,0.7,1.1\).
(a) Complete a stem-and-leaf diagram with stems 0, 1, 2 and key \(0\mid3\) means 0.3 kg. [2]
(b) Find the median. [1]
0580 P22 - Mar 2021 - Q3 - 3 marks
Daily bus passenger counts for 14 days: 15, 18, 22, 17, 35, 38, 24, 19, 19, 24, 25, 31, 36, 29.
(a) Complete a stem-and-leaf diagram with stems 1, 2, 3 and key 1 | 5 = 15 passengers. [2]
(b) Find the median. [1]

0580 P21 - Jun 2021 - Q3 - 3 marks
The stem-and-leaf diagram shows the hours that 16 students studied last week.
| Stem | Leaves |
|---|---|
| 1 | 2 5 6 8 |
| 2 | 0 1 1 7 9 |
| 3 | 2 3 4 5 |
| 4 | 4 5 7 |
Key: 1 | 2 represents 12 hours.
(a) Find the median. [1]
(b) Find the mode. [1]
(c) Find the range. [1]

0580 P22 - Jun 2021 - Q3 - 3 marks
Emma completes 15 mathematics questions. Times in minutes are shown below.
| Stem | Leaves |
|---|---|
| 0 | 3 5 6 7 7 8 8 |
| 1 | 1 2 2 3 6 6 6 |
| 2 | 0 |
Key: 2 | 0 = 20 minutes.
Find the mode, median and range. [3]

0580 P21 - Nov 2021 - Q4 - 2 marks
The diagram shows the numbers of items bought by 22 people in a supermarket.
| Stem | Leaves |
|---|---|
| 1 | 1 3 6 6 |
| 2 | 0 2 2 2 4 8 9 |
| 3 | 1 1 5 8 9 9 |
| 4 | 2 4 6 7 8 |
Key: 1 | 1 represents 11 items.
(a) Find the mode. [1]
(b) Find the median. [1]

0580 P22 - Nov 2021 - Q2 - 3 marks
The diagram shows the ages in years of 15 women.
| Stem | Leaves |
|---|---|
| 3 | 1 5 8 9 |
| 4 | 1 1 2 3 5 6 9 |
| 5 | 0 2 3 8 |
Key: 3 | 1 represents 31 years.
Find the modal age, median age and percentage older than 51. [3]

0580 P22 - Mar 2020 - Q2 - 3 marks
The numbers of swimmers recorded on 12 days are 24, 28, 13, 38, 15, 26, 45, 21, 48, 36, 18, 38.
(a) Complete a stem-and-leaf diagram with stems 1, 2, 3, 4 and key 1 | 3 = 13 swimmers. [2]
(b) Find the median number of swimmers. [1]

0580 P22 - Nov 2019 - Q6 - 2 marks
The table shows how children in Ivan’s class travel to school.
| Travel | Walk | Car | Bicycle | Bus |
|---|---|---|---|---|
| Number of children | 12 | 7 | 9 | 4 |
Find the pie-chart sector angle for children who walk. [2]

0580 P22 - Nov 2018 - Q18 - 4 marks
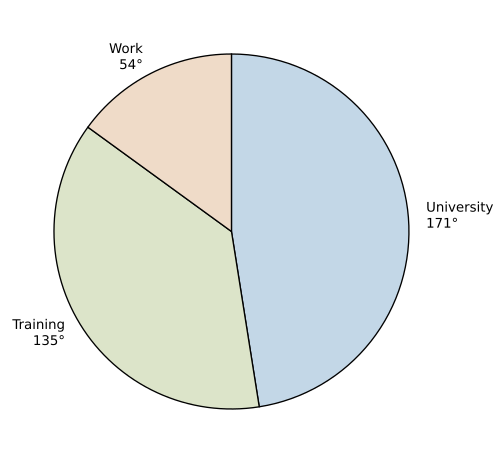
120 students choose their plans after leaving school.
| Choice | University | Training | Work |
|---|---|---|---|
| Students | 57 | 45 | 18 |

Complete a pie chart; label each sector. [4]

0580 P21 - Jun 2014 - Q17 - 5 marks
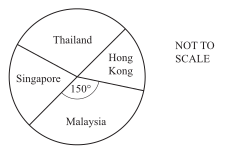
The pie chart represents 72 holidays.
(a) 24 holidays are in Thailand. Show that its sector angle is 120°. [2]
(b) Malaysia’s angle is 150°. Singapore’s angle is twice Hong Kong’s. Find the number of holidays in Hong Kong. [3]

0580 P23 - Jun 2014 - Q2 - 2 marks
| Flavour | Vanilla | Strawberry | Chocolate | Mango |
|---|---|---|---|---|
| Sold in one hour | 6 | 8 | 9 | 7 |
Find the pie-chart sector angle for mango. [2]

0580 P22 - Nov 2013 - Q4 - 2 marks
Bruce’s 18 golf scores are 2, 3, 4, 5, 4, 6, 2, 3, 4, 4, 5, 3, 4, 3, 5, 4, 4, 4. Find the pie-chart angle for score 4. [2]

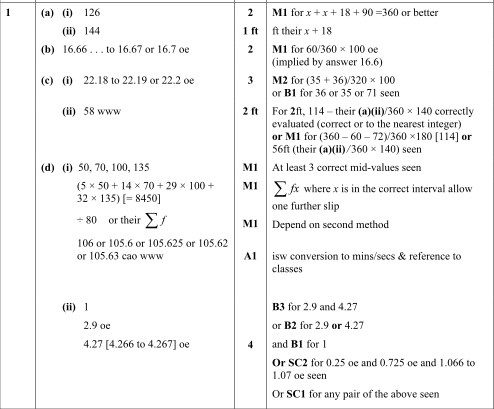
0580 P41 - Nov 2012 - Q1 - 18 marks

Pie charts show mathematics grades. There are 140 girls and 180 boys.
(a(i)) For the Girls’ chart, find x. [2]
(a(ii)) Find the Girls’ angle for B, C or D. [1]
(b) Find the percentage of Boys achieving E, F or G. [2]
(c(i)) Find the percentage of all students achieving A or A*. [3]
(c(ii)) How many more boys than girls achieved B, C or D? [2]
80 girls recorded their examination completion times.
| Time t (min) | \(40<t\le60\) | \(60<t\le80\) | \(80<t\le120\) | \(120<t\le150\) |
|---|---|---|---|---|
| Frequency | 5 | 14 | 29 | 32 |
(d(i)) Estimate the mean time. [4]
(d(ii)) On a histogram the 60–80 column has height 2.8 cm. Find the other three column heights. Do not draw it. [4]
0580 P22 - Jun 2011 - Q14 - 4 marks

60 students report their favourite drink.
(a) Find the Lemonade sector angle. [1]
(b) Find the number choosing Banana shake. [1]
(c) The pie chart radius is 3 cm. Find the Cola arc length. [2]

0580 P22 - Nov 2011 - Q16 - 5 marks
60 cars each use just one type of fuel.
| Fuel | Petrol | Diesel | Liquid Hydrogen | Electricity |
|---|---|---|---|---|
| Frequency | 40 | 12 | 2 | 6 |
(a) State the mode. [1]
(b) Find the angle of the Diesel sector in a pie chart. [2]
(c) Find, as a simplified fraction, the probability that a random car uses Electricity. [2]
