0580 P22 - Mar 2026 - Q6 - 3 marks
Nisha scored points in four basketball games. The mean is 10, the median is 13 and the range is 12.
Find the number of points she scored in each game. [3]

0580 P23 - Jun 2026 - Q4 - 3 marks
Eight office workers earn \(\$220,\$210,\$850,\$265,\$245,\$230,\$245,\$235\).
(a) Find the median wage. [2]
(b) Explain why the mean might not be a suitable average for these wages. [1]

0580 P22 - Mar 2025 - Q16 - 6 marks
The stem-and-leaf diagram gives the masses of 13 packets.
| Stem | Leaves |
|---|---|
| 3 | 1 2 8 |
| 4 | 0 1 2 3 3 8 |
| 5 | 1 2 3 4 |
Key: 3 | 1 represents 31 g.
(a) Find the interquartile range. [3]
(b) Two packets are chosen at random. Find the probability that one has mass greater than 50 g and the other less than 50 g. [3]

0580 P21 - Jun 2025 - Q9 - 3 marks
The table gives test marks for a group of students.
| Test mark | 4 | 5 | 8 |
|---|---|---|---|
| Frequency | 2 | 4 | n |
The mean mark is 6. Find n. [3]

0580 P23 - Jun 2025 - Q6 - 3 marks
There are 15 giraffes. One has height 2.6 m; none is shorter than 2.5 m. Their height range is 2.3 m. More than 3 have the same height, and the modal height is 3.9 m. The incomplete stem-and-leaf diagram shows 9 giraffes.
| Stem | Leaves |
|---|---|
| 2 | 5 |
| 3 | 2 7 7 |
| 4 | 1 1 4 5 7 |
Key: 4 | 1 means 4.1 m.
Complete the stem-and-leaf diagram for all 15 giraffes. [3]

0580 P43 - Jun 2025 - Q1 - 1 mark
Find the median of 5, 11, 11, 13, 17, 21. [1]

0580 P21 - Nov 2025 - Q13 - 4 marks
Rahul has ten scores: \(9,8,9,10,7,x,9,9,x,7\). Their mean is 8. Find the interquartile range, showing your working. [4]

0580 P42 - Nov 2025 - Q6 - 4 marks
A dentist has appointments for 10 patients. The stem-and-leaf diagram shows the waiting times of 8 patients.
| Stem | Leaves |
|---|---|
| 0 | 1 4 |
| 1 | 0 2 9 |
| 2 | 1 5 5 |
Key: 1 | 0 means 10 minutes.
The two other patients are P and Q. The mean waiting time of all 10 is 16 minutes and the range is 26 minutes. P waits longer than Q. Find their waiting times. [4]

0580 P43 - Nov 2025 - Q2 - 4 marks
The stem-and-leaf diagram shows the ages of 16 adults.
| Stem | Leaves |
|---|---|
| 3 | 2 3 3 5 6 7 |
| 4 | 0 1 5 5 6 8 9 |
| 5 | 1 1 1 |
Key: 3 | 2 means age 32 years.
(a) Find the mode. [1]
(b) Find the median. [1]
(c) Find the percentage aged less than 38 years. [2]

0580 P21 - Nov 2024 - Q15 - 5 marks
Class P test marks have lower quartile 38, median 53, interquartile range 28, range 81 and highest mark 96.
(a) Draw a box-and-whisker plot. [3]

(b) Class Q has median 49 and interquartile range 35. Make two comparisons of the distributions. [2]


0580 P23 - Nov 2024 - Q15 - 2 marks

The diagram shows plant heights.
(a) Find the median height. [1]
(b) Find the interquartile range. [1]

0580 P23 - Nov 2023 - Q14 - 2 marks
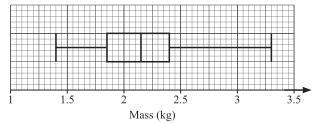
(a) Find the heaviest parcel mass. [1]
(b) Find the interquartile range. [1]

0580 P41 - Jun 2022 - Q1 - 15 marks
Midday temperatures (°C): \(17,21,21,18,23,22,25,19,21,17,19,18,21,24,23\).

| Homework time (min) | \(40<t\le60\) | \(60<t\le80\) | \(80<t\le90\) | \(90<t\le100\) | \(100<t\le150\) |
|---|---|---|---|---|---|
| Frequency | 6 | 10 | 70 | 84 | 30 |
(a(i)) Complete the temperature stem-and-leaf diagram with stems 1 and 2 and key \(1\mid7\) means 17°C. [2]
(a(ii)) Find the median temperature. [1]
(a(iii)) Find the upper quartile. [1]
(a(iv)) Find the pie-chart sector angle for days at 18°C. [2]
(b(i)) From the apple box plot, find the median. [1]
(b(ii)) Find the range. [1]
(b(iii)) Find the interquartile range. [1]
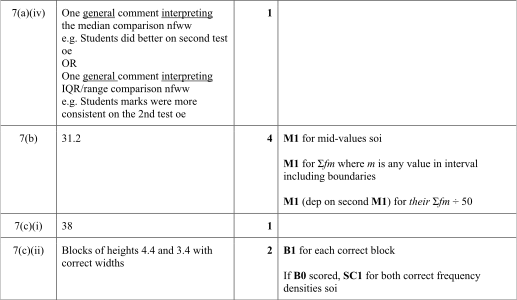
(c(i)) Estimate the mean homework time for the 200 students. [4]
(c(ii)) Regroup into \(40<t\le90\) with frequency 86 and \(90<t\le150\) with frequency 114. In a histogram the first bar is 17.2 cm high. Find the second height. [2]

0580 P22 - Nov 2022 - Q14 - 2 marks


0580 P22 - Nov 2022 - Q8 - 3 marks
Weekly exercise hours: \(5,2,1.5,3,18,4.5,2,4\).
(a) Find the median. [2]
(b) Explain why the mean may not be suitable. [1]

0580 P23 - Nov 2022 - Q4 - 3 marks
Four men have mean mass 97.5 kg, modal mass 101 kg and range 8 kg. Find their four masses. [3]

0580 P42 - Mar 2021 - Q7 - 11 marks

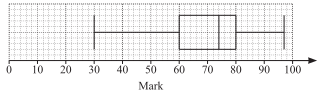
Heights of 50 plants:
| Height h (cm) | \(0<h\le20\) | \(20<h\le30\) | \(30<h\le34\) | \(34<h\le40\) | \(40<h\le60\) |
|---|---|---|---|---|---|
| Frequency | 4 | 9 | 20 | 15 | 2 |
Apple masses:
| Mass m (g) | \(100<m\le110\) | \(110<m\le115\) | \(115<m\le125\) | \(125<m\le140\) |
|---|---|---|---|---|
| Frequency | 50 | x | 44 | 51 |

(a(i)) State the median of the first test. [1]
(a(ii)) Find its range. [1]
(a(iii)) Jais scores above 75% of the students in this test. Give a possible mark. [1]
(a(iv)) Compare the two test mark distributions. [1]
(b) Estimate the mean plant height. [4]
(c(i)) Find x in the apple table. [1]
(c(ii)) Complete the apple histogram. [2]


0580 P22 - Jun 2021 - Q4 - 1 mark
Write an expression for the range of k consecutive integers. [1]

0580 P22 - Mar 2020 - Q14 - 3 marks
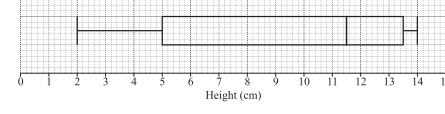
(a) The plot shows plant heights in centimetres. Write down the median. [1]
(b(i)) Find the range. [1]
(b(ii)) Find the interquartile range. [1]

0580 P21 - Jun 2020 - Q12 - 4 marks
Gemma times children and adults completing a puzzle. The children’s times are shown on the plot.

(a) Find the interquartile range of children’s times. [2]
(b) Draw the adult box plot on the same grid: minimum 28, lower quartile 42, median 58, upper quartile 70, maximum 75 seconds. [2]


0580 P43 - Jun 2020 - Q3 - 7 marks
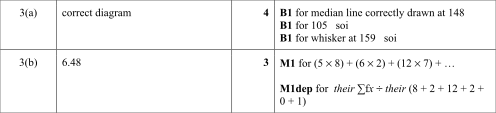
(a) Potato masses have maximum174 g, range69 g, median148 g, lower quartile121 g, and interquartile range38 g.
(a) Draw a box-and-whisker plot. [4]
(b) Calculate the mean mark from this table.
| Mark | 5 | 6 | 7 | 8 | 9 | 10 |
|---|---|---|---|---|---|---|
| Frequency | 8 | 2 | 12 | 2 | 0 | 1 |

0580 P43 - Nov 2020 - Q3 - 6 marks
The box plot shows car speeds in km/h.

(a(i)) Find the lowest speed. [1]
(a(ii)) Find the median. [1]
(a(iii)) Find the interquartile range. [1]
(b) Another car travels400 m in18 seconds. Find its average speed in km/h. [3]


0580 P23 - Jun 2019 - Q4 - 1 mark
| Method of travel | Frequency |
|---|---|
| Car | 10 |
| Walk | 5 |
| Bike | 3 |
| Bus | 2 |
The table shows travel to work for 20 people. Which average — mean, median or mode — can be used? [1]

0580 P41 - Jun 2019 - Q4 - 18 marks
(a) Scores: 21,21,23,26,25,21,22,20,21,23,23,27,24,21.
(a(i)) Find the range, mode, median and mean. [6]
(a(ii)) Choose a student at random. Find the probability of a score above 24. [1]
(b) Petra’s first n test scores have mean x; her first n−1 scores have mean x+1. Find her nth score in simplest form. [3]
(c) Midday temperatures in Zedford over one year:
| Temperature t (°C) | Days |
|---|---|
| 0<t≤10 | 50 |
| 10<t≤15 | 85 |
| 15<t≤20 | 100 |
| 20<t≤25 | 120 |
| 25<t≤35 | 10 |
(c(i)) Estimate the mean. [4]
(c(ii)) Complete the histogram. [4]



0580 P22 - Nov 2019 - Q5 - 2 marks
The masses, to the nearest kilogram, of 11 parcels are: 24, 23, 23, 26, 25, 27, 18, 96, 16, 17, 32.
(a) Find the mode. [1]
(b) Give a reason why the mean would be unsuitable. [1]

0580 P43 - Jun 2017 - Q8 - 13 marks
| Physics | 63 | 61 | 14 | 27 | 72 | 75 | 44 | 40 | 28 | 50 |
|---|---|---|---|---|---|---|---|---|---|---|
| Mathematics | 52 | 80 | 16 | 36 | 79 | 75 | 51 | 35 | 24 | 63 |

(a(i)) Complete the scatter diagram; the first six points are plotted. [2]
(a(ii)) State the correlation type. [1]
A spelling test for 30 students gives:
| Mark | 0 | 1 | 2 | 3 | 4 | 5 |
|---|---|---|---|---|---|---|
| Frequency | 2 | 4 | 5 | 5 | 6 | 8 |
(b) Find mean, median, mode and range. [7]
English test marks:
| Mark | 52 | 75 | 91 |
|---|---|---|---|
| Number of students | x | 45 | 11 |
(c) The English mean is 70.3. Find x. [3]


0580 P21 - Nov 2017 - Q4 - 2 marks
Amber’s mean mark on five tests is 80. Four marks are 68,81,74,89.
Find the fifth mark. [2]

0580 P23 - Nov 2017 - Q21 - 6 marks
The graph shows hummingbirds seen by Ali and Hussein on 10 days.

(a) Find Ali’s mean daily count. [3]
(b) Find Hussein’s median daily count. [2]
(c) On which day is Hussein’s count four times Ali’s? [1]

0580 P22 - Jun 2016 - Q11 - 3 marks
Shahruk plays four games of golf. His scores have mean 75, mode 78 and median 77.
Work out the four scores. [3]

0580 P23 - Nov 2016 - Q6 - 2 marks
James is an animal doctor. The table describes cats seen during one week.
| Day | Monday | Tuesday | Wednesday | Thursday | Friday |
|---|---|---|---|---|---|
| Cats seen | 2 | 4 | 1 | 3 | 2 |
| Mean mass (kg) | 1.9 | 0.9 | 2.1 | 1.8 | 2 |
One cat weighed 4 kg. On which day did James see this cat? [2]

0580 P22 - Jun 2015 - Q4 - 2 marks
The original list is 7, 9, 20, 3, 9.
(a) One number is removed without changing the median or range. Write that number. [1]
(b) One number is added to the original list without changing the mode. Give a possible value. [1]

0580 P21 - Nov 2015 - Q5 - 2 marks
Jim’s eight test marks are 7, 8, 8, y, 6, 9, 10, 5. His mean is 7.5. Find y. [2]

0580 P21 - Nov 2014 - Q4 - 2 marks
Seoul midday temperatures (°C) Monday to Sunday: −4, −5, −3, −11, −8, −3, −1.
(a) Find the mode. [1]
(b) How many days have temperature below the mode? [1]

0580 P21 - Jun 2012 - Q6 - 2 marks
The marks 8, 4, 8, y, 9 have mean 7.2. Find y. [2]

0580 P43 - Jun 2012 - Q4 - 9 marks
A football team receives 3 points for a win, 1 for a draw, 0 for a loss.
| Points | 3 | 1 | 0 |
|---|---|---|---|
| Frequency | 10 | 3 | 7 |
(a(i)) Find the median and mode. [3]
(a(ii)) Find the pie-chart sector angle for 1-point results. [2]
| Height (cm) | \(170<h\le180\) | \(180<h\le190\) | \(190<h\le200\) |
|---|---|---|---|
| Players | 5 | 12 | 3 |
(b) Estimate the mean player height. [4]

0580 P22 - Nov 2012 - Q6 - 3 marks
A traffic survey records the number of people in each of 125 cars.
| People | 1 | 2 | 3 | 4 | 5 |
|---|---|---|---|---|---|
| Frequency | 50 | 40 | 10 | 20 | 5 |
(a) Find the range. [1]
(b) Find the median. [1]
(c) Find the mode. [1]

0580 P23 - Nov 2011 - Q9 - 3 marks
The temperatures in °C are −2, 2, 1, −3, −1, −2, 0.
(a) Find the difference between the highest and lowest temperatures. [1]
(b) Find the mean. [2]

0580 P23 - Jun 2010 - Q1 - 2 marks
Temperatures in °C: −5, −1, 3, 2, −2, 0, 6.
(a) State the lowest temperature. [1]
(b) State the range. [1]
