9709 P62 - Mar 2026 - Q2 - 8 marks
Last year, the time, in minutes, spent by customers in a certain shop had mean 10.5 and standard deviation 6.8. This year, the shop owner wants to test whether the mean time spent by customers has changed. He decides to choose a sample of 20 customers.
(a) A shop assistant suggests that they should choose the first 20 customers who enter the shop one morning. Give two reasons why this will not produce a random sample. [2]
The shop owner decides to carry out the test at the \(10\%\) significance level. He chooses a random sample of 20 customers, and he finds that the mean time spent in the shop by these customers is 8.4 minutes. You should assume that these times come from a normal distribution.
(b) State an assumption that is necessary for the test. [1]
(c) Carry out the test. [5]

9709 P62 - Mar 2026 - Q5 - 7 marks
Anita has a dice with sides numbered 1, 2, 3, 4, 5, 6. The score on one throw is denoted by \(X\).
(a) Assuming that the dice is fair, show that \(\operatorname{Var}(X)=35/12\). [2]
Anita suspects that the dice is not fair. She thinks that low scores are more likely than high scores. She intends to throw the dice 50 times, and if the mean score is less than 3, she will conclude that the dice is not fair.
It is now given that the dice is not fair and \(\mathrm E(X)=2.5\).
(b) Assuming that \(\operatorname{Var}(X)=35/12\), calculate the probability of a Type II error. You may assume that a continuity correction is not needed. [3]
(c) State what is meant by a Type II error in this context. [1]
(d) The sample mean score from Anita’s 50 throws of the dice was 2.9. Explain why it is not possible for Anita to make a Type II error. [1]

9709 P61 - Jun 2026 - Q2 - 5 marks
In the past, \(2\%\) of talking dolls made by a certain firm have been faulty. Following a change in the manufacturing process, a quality control officer suspects that the percentage of faulty talking dolls has increased. In order to test his suspicion, he selects 50 talking dolls at random. If the number of faulty talking dolls is more than 3, he will conclude that the percentage has increased.
(a) State suitable null and alternative hypotheses for the test. [1]
(b) State what is meant by a Type II error in this context. [1]
(c) Given that the true percentage of faulty talking dolls is now \(12\%\), use a binomial distribution to find the probability of a Type II error. [3]

9709 P61 - Jun 2026 - Q4 - 11 marks
The score on one spin of a 5-sided spinner is denoted by the random variable \(X\) with probability distribution as shown in the table.
| \(x\) | 1 | 2 | 3 | 4 | 5 |
|---|---|---|---|---|---|
| \(P(X=x)\) | 0.1 | 0.3 | 0.4 | 0.1 | 0.1 |
(a) Show that \(\mathrm E(X)=2.8\). [1]
It is given that \(\operatorname{Var}(X)=1.16\). The spinner is spun 300 times. The score on each spin is noted and the mean, \(\overline X\), of the 300 scores is found.
(b) Given that \(P(2.8-k<\overline X<2.8+k)=0.2\), find the value of \(k\). [4]
(c) Explain why it was necessary to use the Central Limit Theorem in your answer to 4(b). [1]
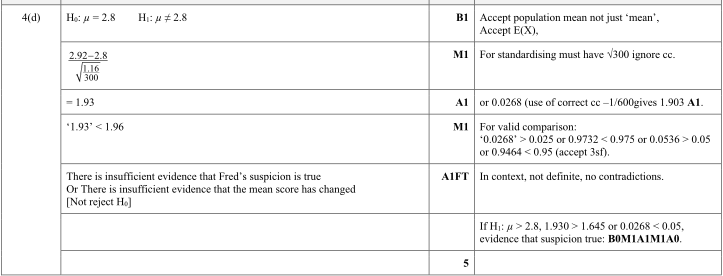
(d) For another similar spinner, it is claimed that \(\mathrm E(X)=2.8\). Fred suspects that this value is incorrect. The spinner is spun 300 times, and the mean of the 300 scores is found to be \(2.92\). Given that the variance of the score on one spin of this spinner is also \(1.16\), test Fred’s suspicion at the \(5\%\) significance level. [5]


9709 P62 - Jun 2026 - Q3 - 6 marks
The number of vehicles, \(X\), passing a certain junction between 1.00 pm and 1.01 pm is modelled by a Poisson distribution. In the past, the population mean of \(X\) was \(2.4\). After a change is made to the junction, the value of \(X\) is noted on a randomly chosen day. A hypothesis test at the \(5\%\) significance level is carried out to determine whether the population mean of \(X\) has increased.
(a) State suitable null and alternative hypotheses for the test. [1]
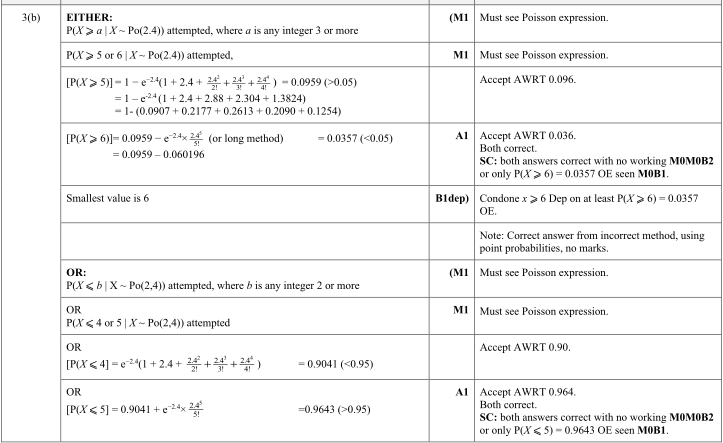
(b) Find the smallest value of \(X\) that would result in rejecting the null hypothesis. [4]
(c) State the value of \(P(\text{Type I error})\). [1]


9709 P62 - Jun 2026 - Q6 - 9 marks
The length of time, \(T\) minutes, that customers spend in a certain shop has the distribution \(\mathrm N(\mu,9.2)\). Last year the value of \(\mu\) was \(12.4\). The manager of the shop wants to test whether the value of \(\mu\) has decreased this year. She chooses a random sample of 75 customers and finds that the sample mean, \(\overline T\), for these customers is \(11.9\).
(a) Test at the \(5\%\) significance level whether the value of \(\mu\) is less than \(12.4\). [5]
(b) Explain whether it was necessary to use the Central Limit Theorem in your answer to 6(a). [1]
(c) Later the manager chooses another large random sample of \(n\) customers. She finds that, for these customers, \(\overline T=11.8\). She carries out a similar test at the \(5\%\) significance level, and the conclusion is that there is evidence that the value of \(\mu\) is less than \(12.4\). Find the range of possible values of \(n\). [3]


9709 P63 - Jun 2026 - Q2 - 6 marks
Bettie believes that \(30\%\) of students at her school are vegetarian. Amir claims that the proportion is less than \(30\%\). In order to test his claim, Amir takes a random sample of 20 students at the school. He finds that exactly 2 students in the sample say that they are vegetarian.
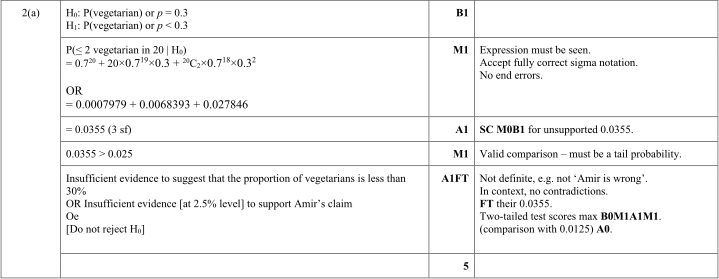
(a) Use a binomial distribution to test Amir’s claim at the \(2.5\%\) significance level. [5]
(b) State the smallest significance level at which the null hypothesis would be rejected in favour of Amir’s claim. Give your answer correct to 3 significant figures. [1]
Source clarification: the original QP says “Amir’s claim would be rejected”. The official MS gives the p-value, which is the smallest level for rejecting the null hypothesis and supporting his claim. The wording above makes that intended meaning explicit.

9709 P63 - Jun 2026 - Q5 - 14 marks
The lengths, \(X\text{ cm}\), of Wamba snakes have mean \(\mu\text{ cm}\). Research has shown that, for the whole population of Wamba snakes, \(\mu=41.5\). A researcher claims that, for the Wamba snakes in a particular region, the mean length is less than 41.5. She measures the lengths of a random sample of 150 Wamba snakes in this region. The results are summarised below:
\[n=150,\qquad\sum x=6030,\qquad\sum x^2=252014.\]
(a) Find unbiased estimates of the population mean and variance of \(X\) for Wamba snakes in this region, showing that the unbiased estimate of variance is \(64.483\) correct to 3 decimal places. [3]
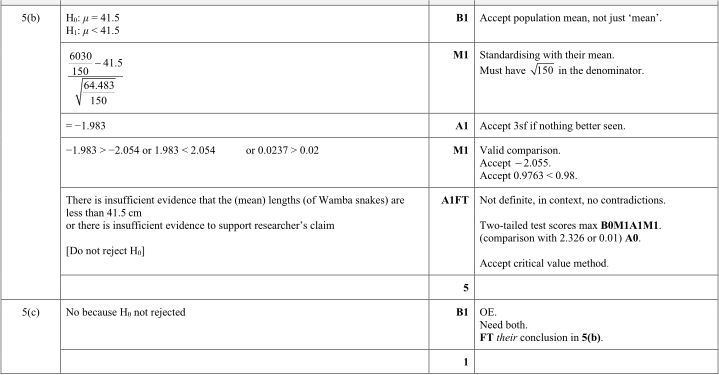
(b) Assuming that \(\operatorname{Var}(X)=64.483\) for the whole population of Wamba snakes, test the researcher’s claim at the \(2\%\) significance level. [5]
(c) Use your answer to 5(b) to explain whether it is possible for the researcher to make a Type I error. [1]
Later the researcher carries out a similar test at the \(2\%\) significance level, using the same hypotheses and another random sample of 150 Wamba snakes from this region.
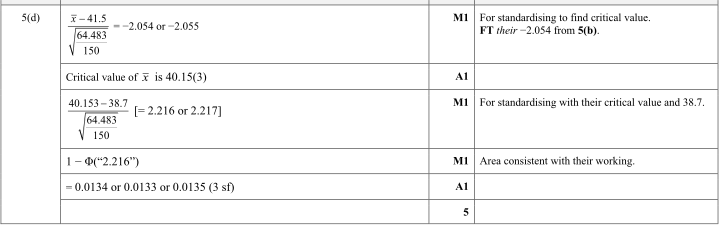
(d) Given that the population mean length of Wamba snakes for this region is \(38.7\text{ cm}\), find the probability of a Type II error. [5]

9709 P65 - Jun 2026 - Q5 - 7 marks
The manufacturer of Beta cars claims that the proportion of adults in a certain town who own a Beta car is \(1/5\). Raju suspects that the true proportion is less than \(1/5\). He plans to carry out a hypothesis test using a random sample of 40 adults from the town. If fewer than 4 of these adults own a Beta car, he will conclude that the true proportion is less than \(1/5\).
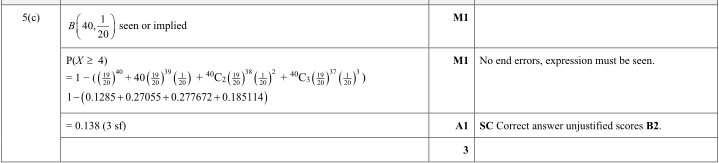
(a) Use a binomial distribution to find the smallest significance level of the test. Give your answer correct to 3 significant figures. [3]
(b) State the probability of a Type I error. [1]
It is now given that the true proportion is \(1/20\).
(c) Find the probability of a Type II error. [3]

9709 P65 - Jun 2026 - Q6 - 10 marks
In a certain country, the wingspan, in cm, of adult swans has the distribution \(\mathrm N(234.0,6.9^2)\).
(a) Find the probability that the mean wingspan for a random sample of 25 adult swans is between 232.0 cm and 235.0 cm. [4]
A naturalist wishes to test whether the mean wingspan of adult swans in a particular region is different from 234.0 cm. He chooses a random sample of 25 swans in this region and finds that the mean wingspan is 236.3 cm. Assume that the standard deviation of the wingspans is 6.9 cm.
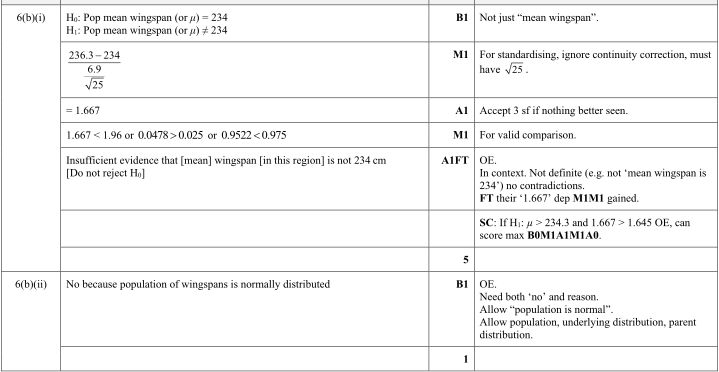
(b)(i) Carry out the test at the \(5\%\) significance level. [5]
(b)(ii) Explain whether it was necessary to use the Central Limit Theorem in 6(b)(i). [1]

9709 P61 - Nov 2025 - Q2 - 8 marks
The mean mass of packets of Trueleaf tea is supposed to be 500 grams. An inspector wishes to test whether this value is correct. He weighs 60 randomly chosen packets and notes the mass, \(x\) grams, of each packet. The results are summarised as follows.
\[n=60,\qquad\sum x=29970,\qquad\sum x^2=14970300.\]
Test, at the 5% significance level, whether the population mean mass is 500 grams. [8]

9709 P61 - Nov 2025 - Q5 - 6 marks
It is known that 20% of households in a certain country contain more than 4 people. Laxmi believes that, in her town, the percentage is lower than 20%. She chooses a random sample of 40 households in her town and notes the number which contain more than 4 people. She then carries out a test at the 2.5% significance level using a binomial distribution.
(a) Find the probability of a Type I error. [4]
(b) State the rejection region for the test. [1]
Laxmi finds that exactly 2 households in her sample contain more than 4 people.
(c) Explain why it is impossible for Laxmi to make a Type II error. [1]


9709 P62 - Nov 2025 - Q4 - 7 marks
An inspector believes that 18% of cups made at a certain factory contain flaws. The factory owner claims that the true percentage is less than 18%. The inspector examines a random sample of 40 cups and finds that 3 of them contain flaws.
(a) Stating a necessary assumption, use a binomial distribution to test the factory owner’s claim at the 5% significance level. [6]
(b) Explain why it would not be appropriate to use the Poisson approximation to the binomial distribution to carry out the test in part (a). [1]


9709 P62 - Nov 2025 - Q6 - 12 marks
The weekly profit, in dollars, made by a certain firm has a normal distribution. In the past, the weekly profit had the distribution \(N(736,26^2)\). Following a change in management, the mean weekly profit for 35 randomly chosen weeks is \(\$725\).
(a) Stating a necessary assumption, test at the 2% significance level whether the mean weekly profit has decreased. [6]
The mean weekly profit for another random sample of 35 weeks is found and a similar test is carried out at the 2% significance level.
(b) State the probability of a Type I error. [1]
(c) Given that the mean weekly profit is now in fact \(\$718\), find the probability of a Type II error. [5]


9709 P65 - Nov 2025 - Q2 - 4 marks
A researcher is investigating whether the proportion of families who do not own a car in his town is different from the proportion of the population in the whole country, which is 10.1%. He takes a large random sample of families in his town and finds the proportion of families that do not own a car.
(a) Explain why a two-tailed test is appropriate in this context. [1]
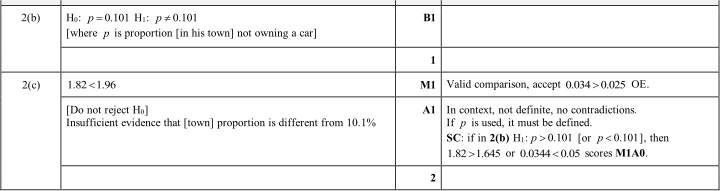
(b) State suitable null and alternative hypotheses for the test. [1]
The researcher calculates the value of the test statistic \(z\) and finds that \(z=1.82\). He carries out the test at the 5% significance level.
(c) State the conclusion of the test, explaining your answer. [2]

9709 P65 - Nov 2025 - Q3 - 8 marks
A certain website receives an average of \(\mu\) hits per hour. In the past the value of \(\mu\) was 14.4. After making some improvements, the owner of the website wishes to test whether the value of \(\mu\) has increased. He chooses a 10-minute period at random and finds that there were 6 hits during this period. You may assume that the number of hits the website receives in any given time period follows a Poisson distribution.
(a) Carry out the test at the 2.5% significance level. [6]
(b) Explain whether it is possible that a Type I error or a Type II error or both may have been made in carrying out the test. [2]

9709 P61 - Jun 2025 - Q3 - 8 marks
The time, \(T\) minutes, for a certain daily bus journey is normally distributed. The bus company claims that the mean of \(T\) is 45. A passenger believes that the mean of \(T\) is actually greater than 45. She notes the times taken for this journey on a random sample of 60 days. The results are summarised below. \[n=60,\qquad\sum t=2750,\qquad\sum t^2=127000.\]
(a) Calculate unbiased estimates of the population mean and variance. [3]
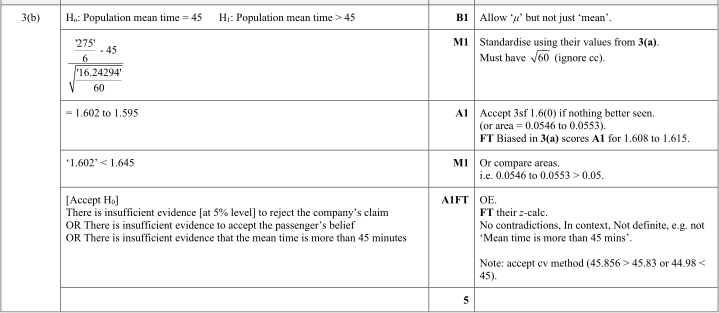
(b) Test the passenger’s belief at the 5% significance level. [5]

9709 P61 - Jun 2025 - Q6 - 7 marks
A manufacturer of cell phones claims that 25% of students own a Pumpkin phone. Jeyeraj thinks that the proportion of students at his large college who own a Pumpkin phone is less than 25%. He plans to test the manufacturer’s claim. He chooses a random sample of 30 students at his college. If the number of students who own a Pumpkin phone is less than 5, Jeyeraj will reject the manufacturer’s claim.
(a) State suitable hypotheses for the test. [1]
(b) Given that the true proportion of students at the college who own a Pumpkin phone is 10%, use a binomial distribution to find the probability of a Type II error. [3]
At Florence’s college, in a random sample of 40 students, it was found that 5 own a Pumpkin phone.
(c) Calculate an approximate 95% confidence interval for the proportion of students at Florence’s college who own a Pumpkin phone. [3]


9709 P62 - Jun 2025 - Q5 - 4 marks
The amount of time, in minutes, spent by a customer on one visit to a certain shop is modelled by the random variable \(X\sim N(\mu,\sigma^2)\). In the past, the values of \(\mu\) and \(\sigma\) were 10.5 and 3.8 respectively. The shop has recently moved to a new location, and the manager hopes that the new value of \(\mu\) will be greater than 10.5. He takes a random sample of 10 customers and notes the time they each spend in the shop. He then calculates the sample mean \(\bar x\) for these 10 times.
Using a hypothesis test at the 5% significance level, the manager finds that there is sufficient evidence to conclude that the new value of \(\mu\) is greater than 10.5.
Stating a necessary assumption, find the smallest possible value of \(\bar x\). [4]

9709 P62 - Jun 2025 - Q8 - 10 marks
Birgitte has a six-sided dice. She suspects that the dice is biased so that the probability, \(p\), that it will show a six on one throw is less than \(1/6\). She throws the dice 30 times and finds that it shows a six on exactly 2 throws.
(a) Use a binomial distribution with a 5% significance level to test Birgitte’s suspicion. [5]
Later, Birgitte carries out a similar test at the 5% significance level, using another 30 throws of the dice.
(b) Calculate the probability of a Type I error. [2]
(c) Given that the value of \(p\) is actually 0.02, calculate the probability of a Type II error. [3]


9709 P63 - Jun 2025 - Q2 - 7 marks
The lengths of pencils made at a factory are normally distributed. The standard deviation of the lengths is \(\sigma\) cm, and the mean is supposed to be 10 cm. An inspector thinks that the mean is actually greater than 10 cm. He takes a random sample of 50 pencils produced at the factory and finds that the mean of these 50 lengths is 10.03 cm. He then carries out a hypothesis test.
(a) He finds that the value of the test statistic \(z\) is 1.995 correct to 3 decimal places.
(a(i)) Calculate the value of \(\sigma\). [3]
(a(ii)) Carry out the hypothesis test at the 2.5% significance level. [3]
(b) Explain whether it was necessary to use the Central Limit Theorem in carrying out the test. [1]


9709 P63 - Jun 2025 - Q7 - 10 marks
In the past, one quarter of job applicants at a certain firm had first-class degrees. A change is made in the job description and a director of the firm believes that, on average, the proportion of job applicants with first-class degrees has decreased.
In the month following the change, there were 35 job applicants, and \(r\) of these had first-class degrees. The firm carried out a hypothesis test at the 4% significance level to test the director’s belief.
(a) Use a binomial distribution to find the largest value of \(r\) that would provide sufficient evidence that the director’s belief is correct. [6]
In another month, the director carries out a similar test at the 4% significance level using the 35 job applicants from that month.
(b) Explain the meaning of a Type I error in this context, and state the probability of a Type I error. [2]
(c) Given that the proportion of job applicants with first-class degrees this year is actually 0.05, find the probability of a Type II error. [2]

9709 P65 - Jun 2025 - Q6 - 8 marks
It is claimed that 28% of voters in a certain town support the Forward Now political party. A researcher suspects that the true figure is less than 28%. She interviews a random sample of 30 voters from the town and she finds that 4 voters in the sample say that they support the Forward Now party. She plans to carry out a hypothesis test at the 10% significance level.
(a) Use a binomial distribution to carry out the test. [5]
(b) State, with a reason, whether it is possible that a Type I error was made in carrying out the test. [1]
Later the researcher carries out a similar test at the 10% significance level, using a new random sample of 30 voters from the town.
(c) Find the probability of a Type I error. [2]


9709 P65 - Jun 2025 - Q7 - 5 marks
A firm makes a certain type of battery-powered toy. The battery life is denoted by \(X\) hours and the population mean of \(X\) is supposed to be 12. The Quality Control department wished to test whether the population mean of \(X\) is actually less than 12. They tested a random sample of 50 of these toys and found that the sample mean, \(\bar X\), was 11.4.
(a) State suitable null and alternative hypotheses for the test. [1]
You may assume that the standard deviation of the battery life is 2.3 hours.
(b) Show that the value \(\bar X=11.4\) leads to rejection of the null hypothesis at the 5% significance level. [2]
It is given that the value \(\bar X=11.4\) leads to rejection of the null hypothesis at the \(\alpha\)% significance level.
(c) Find the set of possible values of \(\alpha\). [2]


9709 P62 - Mar 2025 - Q2 - 9 marks
A researcher records the time, \(T\) seconds, taken by adults to complete a questionnaire. The results for a random sample of 60 adults who completed the questionnaire this year are summarised as follows. \[n=60,\qquad\sum t=3678,\qquad\sum t^2=226313.36.\]
(a) Find an unbiased estimate of \(\mathrm E(T)\), and show that an unbiased estimate of \(\operatorname{Var}(T)\) is 14.44. [3]
In the past, the population mean time was 62.4 seconds.
(b) Test at the 2% significance level whether the population mean time for this year is less than 62.4 seconds. [5]
(c) State, with a reason, whether it was necessary to use the Central Limit Theorem in your answer to part (b). [1]


9709 P62 - Mar 2025 - Q5 - 7 marks
Amir believes that 20% of the students at his college are left-handed. His friend believes that the true proportion, \(p\), is less than 20%. Amir plans to use the binomial distribution to test the null hypothesis, \(H_0:p=0.2\), against the alternative hypothesis, \(H_1:p<0.2\).
He decides to choose 35 students at random. If 3 or fewer of these students are left-handed, Amir will reject his belief.
(a) Find the significance level of the test. [3]
(b) State the probability of a Type I error. [1]
It is now given that the true value of \(p\) is 0.05.
(c) Find the probability of a Type II error. [3]


9709 P61 - Nov 2024 - Q5 - 6 marks
Worm lengths are normally distributed with mean \(\mu\) cm and standard deviation 2.3 cm. A magazine states that \(\mu=12.7\). A scientist measures a random sample of 50 worms and obtains \(\sum x=597.1\). He plans a test at the 1% significance level of whether the true mean differs from 12.7.
(a) State, with a reason, whether to use a one-tailed or a two-tailed test. [1]
(b) Carry out the test. [5]


9709 P61 - Nov 2024 - Q7 - 14 marks
Yearly accidents on a road have distribution \(\operatorname{Po}(m)\). Previously \(m=3.3\). After a new speed limit, the council tests whether \(m\) has decreased, using the total \(X\) over two randomly chosen years and a 5% significance level.
(a) Calculate the probability of a Type I error. [4]
(b) Given \(X=2\), carry out the test. [3]
(c) A similar test uses two different years and the same hypotheses. Given that the true value of \(m\) is 0.6, calculate the probability of a Type II error. [3]
(d) Using \(m=0.6\) and a suitable approximating distribution, find the probability of more than 10 accidents in 30 years. [4]


9709 P62 - Nov 2024 - Q3 - 6 marks
A factory owner models the number of employees using the canteen on a day by \(B(25,p)\). Previously \(p=0.8\). After introducing a new menu, he tests whether \(p\) has increased. On a randomly chosen day, 23 employees use the canteen.
(a) Use the binomial distribution to carry out the test at the 10% significance level. [5]
(b) Given that the factory has 30 employees, comment on the suitability of the model. [1]

9709 P62 - Nov 2024 - Q7 - 9 marks
One-year-old trees of a certain variety have mean height 2.3 m. A scientist believes that trees in her region have a greater mean height. She plans a test at the 2% significance level.
(a) State the probability of a Type I error. [1]
A random sample of 100 trees has heights \(h\) m satisfying \(\sum h=238,\ \sum h^2=580\).
(b) Carry out the test at the 2% significance level. [7]
(c) The test was carried out correctly, but another scientist claims that a Type II error was made. Comment on this claim. [1]

9709 P61 - Jun 2024 - Q4 - 9 marks
(a) Eight randomly sampled cereal boxes have masses 261, 249, 259, 252, 255, 256, 258, 254 grams. Find unbiased estimates of the population mean and variance. [3]
The supplier claims a mean mass of 253 g. A quality control officer suspects a greater mean. A new random sample of 100 boxes has total mass 25360 g.
(b)(i) Given a population standard deviation of 3.5 g, test at the 5% significance level whether the population mean exceeds 253 g. [5]
(b)(ii) An employee says the test is invalid because it uses the normal distribution when box masses are not known to be normal. Explain briefly whether this is true. [1]


9709 P61 - Jun 2024 - Q7 - 11 marks
Each July Rita records the number \(X\) of days on which she sees a kind of bird and models \(X\sim B(31,p)\). Earlier data suggest \(p=0.3\). In July 2022 she suspected a decrease and saw the bird on 4 days.
(a) Use the binomial distribution to test her suspicion at the 5% significance level. [5]
In July 2023 she repeats the test with the same hypotheses and significance level.
(b) Calculate the probability of a Type I error. [2]
For a different rare bird, the yearly number of sightings \(Y\) is modelled by \(B(365,0.01)\).
(c)(i) Use a suitable approximation to find \(P(Y=4)\). [3]
(c)(ii) Justify the approximation in this context. [1]


9709 P62 - Jun 2024 - Q6 - 10 marks
A cereal-box filling machine previously produced mean mass 510 g. After an adjustment, an inspector suspects a decrease. A random sample of 120 boxes has mean 508 g. Assume the population standard deviation remains 10 g.
(a) Test for a decrease at the 2.5% significance level. [5]
Later he repeats the test with another 120 boxes and the same hypotheses.
(b) Given that the true mean is now 506 g, find the probability of a Type II error. [5]


9709 P63 - Jun 2024 - Q4 - 5 marks
Do not use an approximating distribution. At last year’s election in Menham, 24% supported the Today Party. A student tests whether support has decreased. A random sample of 25 voters contains exactly 2 supporters. Carry out the test at the 5% significance level. [5]

9709 P63 - Jun 2024 - Q6 - 9 marks
Green sweets in 200 randomly sampled Frutos packets are summarised below.
| Number of green sweets | 0 | 1 | 2 | 3 | More than 3 |
|---|---|---|---|---|---|
| Number of packets | 32 | 50 | 97 | 21 | 0 |
(a) Estimate the population mean without bias and show that an unbiased variance estimate is 0.783 to 3 significant figures. [3]
The manufacturer claims mean 1.65. Anji believes the population mean \(\mu\) is smaller and tests this claim using the sample.
(b) State suitable null and alternative hypotheses. [1]
(c) Show that the result is significant at 5% but not at 1%. [4]
(d) Given that Anji made a Type I error, explain why her significance level was not 1%. [1]


9709 P62 - Mar 2024 - Q7 - 6 marks
Adult female heights in Litania have population mean \(\mu\) and standard deviation \(\sigma\) cm. In 2004 these were 163.21 and 6.95. The government claims the current mean is greater. A researcher plans a test at the 1% significance level using the mean of a random sample of 300 women.
(a) State the probability of a Type I error. [1]
Assume the standard deviation remains 6.95 cm.
(b) Given that the true current mean is 164.91 cm, find the probability of a Type II error. [5]

9709 P61 - Nov 2023 - Q5 - 5 marks
In the past the number of enquiries per minute at a customer service desk has been modelled by a random variable with distribution \(\operatorname{Po}(0.31)\). Following a change in the position of the desk, it is expected that the mean number of enquiries per minute will increase. In order to test whether this is the case, the total number of enquiries during a randomly chosen 5-minute period is noted. You should assume that a Poisson model is still appropriate.
Given that the total number of enquiries is 5, carry out the test at the 2.5% significance level. [5]

9709 P61 - Nov 2023 - Q7 - 12 marks
A biologist wishes to test whether the mean concentration \(\mu\), in suitable units, of a certain pollutant in a river is below the permitted level of 0.5. She measures the concentration, \(x\), of the pollutant at 50 randomly chosen locations in the river. The results are summarised below. \[n=50,\qquad \sum x=23.0,\qquad \sum x^2=13.02.\]
(a) Carry out a test at the 5% significance level of the null hypothesis \(\mu=0.5\) against the alternative hypothesis \(\mu<0.5\). [7]
Later, a similar test is carried out at the 5% significance level using another sample of size 50 and the same hypotheses as before. You should assume that the standard deviation is unchanged.
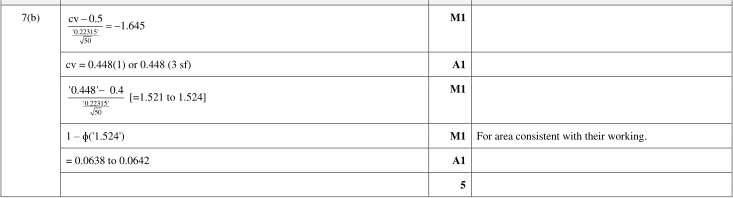
(b) Given that, in fact, the value of \(\mu\) is 0.4, find the probability of a Type II error. [5]

9709 P62 - Nov 2023 - Q4 - 5 marks
The height \(H\), in metres, of mature trees of a certain variety is normally distributed with standard deviation 0.67. In order to test whether the population mean of \(H\) is greater than 4.23, the heights of a random sample of 200 trees are measured.
(a) Write down suitable null and alternative hypotheses for the test. [1]
The sample mean height, \(\bar h\) metres, of the 200 trees is found and the test is carried out. The result of the test is to reject the null hypothesis at the 5% significance level.
(b) Find the set of possible values of \(\bar h\). [3]
(c) Ajit said, “In (b) we had to assume that H is normally distributed, so it was necessary to use the Central Limit Theorem.” Explain whether you agree with Ajit. [1]

9709 P62 - Nov 2023 - Q3 - 9 marks
A researcher read a magazine article which stated that boys aged 1 to 3 prefer green to orange. It claimed that, when offered a green cube and an orange cube to play with, a boy is more likely to choose the green one.
The researcher disagrees with this claim. She believes that boys of this age are equally likely to choose either colour. In order to test her belief, the researcher carried out a hypothesis test at the 5% significance level. She offered a green cube and an orange cube to each of 10 randomly chosen boys aged 1 to 3, and recorded the number, X, of boys who chose the green cube. Out of the 10 boys, 8 boys chose the green cube.
(a(i)) Assuming that the researcher’s belief that either colour cube is equally likely to be chosen is valid, a student correctly calculates that \(P(X=8)=0.0439\), correct to 3 significant figures. He says that, because this value is less than 0.05, the null hypothesis should be rejected. Explain why this statement is incorrect. [1]
(a(ii)) Carry out the test on the researcher’s claim that either colour cube is equally likely to be chosen. [5]
(b) Another researcher claims that a Type I error was made in carrying out the test. Explain why this cannot be true. [1]
A similar test, at the 5% significance level, was carried out later using 10 other randomly chosen boys aged 1 to 3.
(c) Find the probability of a Type I error. [2]


9709 P61 - Jun 2023 - Q3 - 6 marks
In the past, the annual amount of wheat produced per farm by a large number of similar sized farms in a certain region had mean 24.0 tonnes and standard deviation 5.2 tonnes. Last summer a new fertiliser was used by all the farms, and it was expected that the mean amount of wheat produced per farm would be greater than 24.0 tonnes. In order to test whether this was true, a scientist recorded the amounts of wheat produced by a random sample of 50 farms last summer. He found that the value of the sample mean was 25.8 tonnes.
Stating a necessary assumption, carry out the test at the 1% significance level. [6]

9709 P61 - Jun 2023 - Q7 - 14 marks
The number of accidents per week at a certain factory has a Poisson distribution. In the past the mean has been 1.9 accidents per week. Last year, the manager gave all his employees a new booklet on safety. He decides to test, at the 5% significance level, whether the mean number of accidents has been reduced. He notes the number of accidents during 4 randomly chosen weeks this year.
(a) State suitable null and alternative hypotheses for the test. [1]
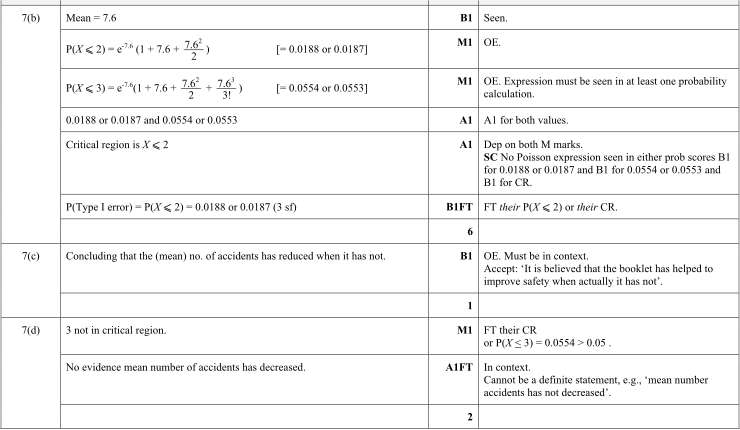
(b) Find the critical region for the test and state the probability of a Type I error. [6]
(c) State what is meant by a Type I error in this context. [1]
(d) During the 4 randomly chosen weeks there are a total of 3 accidents. State the conclusion that the manager should reach. Give a reason for your answer. [2]
(e) Assuming that the mean remains 1.9 accidents per week, use a suitable approximation to calculate the probability that there will be more than 100 accidents during a 52-week period. [4]


9709 P62 - Jun 2023 - Q3 - 8 marks
The masses, in kilograms, of newborn babies in country A are represented by the random variable \(X\), with mean \(\mu\) and variance \(\sigma^2\). The masses of a random sample of 500 newborn babies in this country were found and the results are summarised below. \[n=500,\qquad\sum x=1625,\qquad\sum x^2=5663.5.\]
(a) Calculate unbiased estimates of \(\mu\) and \(\sigma^2\). [3]
A researcher wishes to test whether the mean mass of newborn babies in a neighbouring country, B, is different from that in country A. He chooses a random sample of 60 newborn babies in country B and finds that their sample mean mass is 2.95 kg.
Assume that your unbiased estimates in part (a) are the correct values for \(\mu\) and \(\sigma^2\). Assume also that the variance of the masses of newborn babies in country B is the same as in country A.
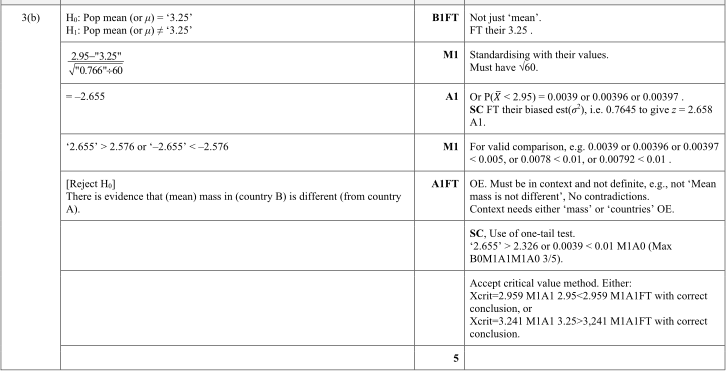
(b) Carry out the test at the 1% significance level. [5]

9709 P62 - Jun 2023 - Q6 - 5 marks
When a child completes an online exercise called a Mathlit, they might be awarded a medal. The publishers claim that the probability that a randomly chosen child who completes a Mathlit will be awarded a medal is \(\frac13\). Asha wishes to test this claim. She decides that if she is awarded no medals while completing 10 Mathlits, she will conclude that the true probability is less than \(\frac13\).
(a) Use a binomial distribution to find the probability of a Type I error. [2]
The true probability of being awarded a medal is denoted by \(p\).
(b) Given that the probability of a Type II error is 0.8926, find the value of \(p\). [3]

9709 P63 - Jun 2023 - Q5 - 9 marks
Last year the mean time for pizza deliveries from Pete’s Pizza Pit was 32.4 minutes. This year the time, \(t\) minutes, for pizza deliveries from Pete’s Pizza Pit was recorded for a random sample of 50 deliveries. The results were as follows. \[n=50,\qquad\sum t=1700,\qquad\sum t^2=59050.\]
(a) Find unbiased estimates of the population mean and variance. [3]
(b) Test, at the 2% significance level, whether the mean delivery time has changed since last year. [5]
(c) Under what circumstances would it not be necessary to use the Central Limit Theorem in answering (b)? [1]


9709 P63 - Jun 2023 - Q8 - 11 marks
A new light was installed on a certain footpath. A town councillor decided to use a hypothesis test to investigate whether the number of people using the path in the evening had increased.
Before the light was installed, the mean number of people using the path during any 20-minute period during the evening was 1.01. After the light was installed, the total number, n, of people using the path during 3 randomly chosen 20-minute periods during the evening was noted.
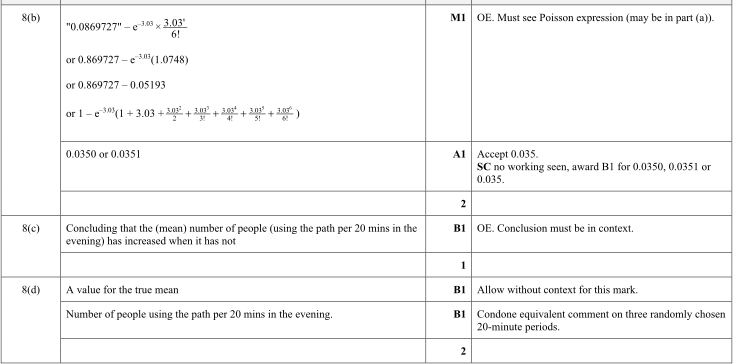
(a) Given that the value of n was 6, use a Poisson distribution to carry out the test at the 5% significance level. [6]
(b) Later a similar test, at the 5% significance level, was carried out using another 3 randomly chosen 20-minute periods during the evening. Find the probability of a Type I error. [2]
(c) State what is meant by a Type I error in this context. [1]
(d) State, in context, what further information would be needed in order to find the probability of a Type II error. Do not carry out any further calculation. [2]

9709 P62 - Mar 2023 - Q4 - 5 marks
The number of accidents per 3-month period on a certain road has the distribution \(\operatorname{Po}(\lambda)\). In the past the value of \(\lambda\) has been 5.7. Following some changes to the road, the council carries out a hypothesis test to determine whether the value of \(\lambda\) has decreased. If there are fewer than 3 accidents in a randomly chosen 3-month period, the council will conclude that the value of \(\lambda\) has decreased.
(a) Find the probability of a Type I error. [2]
(b) Find the probability of a Type II error if the mean number of accidents per 3-month period is now actually 0.9. [3]

9709 P62 - Mar 2023 - Q6 - 9 marks
Last year, the mean time taken by students at a school to complete a certain test was 25 minutes. Akash believes that the mean time taken by this year’s students was less than 25 minutes. In order to test this belief, he takes a large random sample of this year’s students and he notes the time taken by each student. He carries out a test, at the 2.5% significance level, for the population mean time, \(\mu\) minutes. Akash uses the null hypothesis \(H_0:\mu=25\).
(a) Give a reason why Akash should use a one-tailed test. [1]
Akash finds that the value of the test statistic is \(z=-2.02\).
(b) Explain what conclusion he should draw. [2]
In a different one-tailed hypothesis test the \(z\)-value was found to be 2.14.
(c) Given that this value would lead to a rejection of the null hypothesis at the \(\alpha\%\) significance level, find the set of possible values of \(\alpha\). [3]
The population mean time taken by students at another school to complete a test last year was \(m\) minutes. Sorin carries out a one-tailed test to determine whether the population mean this year is less than \(m\), using a random sample of 100 students. He assumes that the population standard deviation of the times is 3.9 minutes. The sample mean is 24.8 minutes, and this result just leads to the rejection of the null hypothesis at the 5% significance level.
(d) Find the value of \(m\). [3]


9709 P61 - Nov 2022 - Q2 - 8 marks
A spinner has five sectors, each printed with a different colour. Susma and Sanjay both wish to test whether the spinner is biased so that it lands on red on fewer spins than it would if it were fair. Susma spins the spinner 40 times. She finds that it lands on red exactly 4 times.
(a) Use a binomial distribution to carry out the test at the 5% significance level. [5]
Sanjay also spins the spinner 40 times. He finds that it lands on red \(r\) times.
(b) Use a binomial distribution to find the largest value of \(r\) that lies in the rejection region for the test at the 5% significance level. [3]


9709 P61 - Nov 2022 - Q7 - 10 marks
In the past Laxmi’s time, in minutes, for her journey to college had mean 32.5 and standard deviation 3.1. After a change in her route, Laxmi wishes to test whether the mean time has decreased. She notes her journey times for a random sample of 50 journeys and she finds that the sample mean is 31.8 minutes. You should assume that the standard deviation is unchanged.
(a) Carry out a hypothesis test, at the 8% significance level, of whether Laxmi’s mean journey time has decreased. [5]
Later Laxmi carries out a similar test with the same hypotheses, at the 8% significance level, using another random sample of size 50.
(b) Given that the population mean is now 31.5, find the probability of a Type II error. [5]

9709 P62 - Nov 2022 - Q2 - 5 marks
In the past, the mean length of a particular variety of worm has been 10.3 cm, with standard deviation 2.6 cm. Following a change in the climate, it is thought that the mean length of this variety of worm has decreased. The lengths of a random sample of 100 worms of this variety are found and the mean of this sample is found to be 9.8 cm.
Assuming that the standard deviation remains at 2.6 cm, carry out a test at the 2% significance level of whether the mean length has decreased. [5]

9709 P62 - Nov 2022 - Q4 - 8 marks
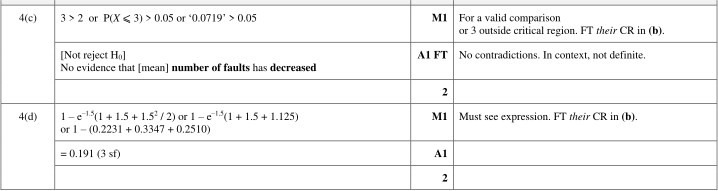
The number of faults in cloth made on a certain machine has a Poisson distribution with mean 2.4 per \(10\text{ m}^2\). An adjustment is made to the machine. It is required to test at the 5% significance level whether the mean number of faults has decreased. A randomly selected \(30\text{ m}^2\) of cloth is checked and the number of faults is found.
(a) State suitable null and alternative hypotheses for the test. [1]
(b) Find the probability of a Type I error. [3]
Exactly 3 faults are found in the randomly selected \(30\text{ m}^2\) of cloth.
(c) Carry out the test at the 5% significance level. [2]
Later a similar test was carried out at the 5% significance level, using another randomly selected \(30\text{ m}^2\) of cloth.
(d) Given that the number of faults actually has a Poisson distribution with mean 0.5 per \(10\text{ m}^2\), find the probability of a Type II error. [2]

9709 P61 - Jun 2022 - Q2 - 5 marks
Arvind uses an ordinary fair 6-sided die to play a game. He believes he has a system to predict the score when the die is thrown. Before each throw of the die, he writes down what he thinks the score will be. He claims that he can write the correct score more often than he would if he were just guessing. His friend Laxmi tests his claim by asking him to write down the score before each of 15 throws of the die. Arvind writes the correct score on exactly 5 out of 15 throws.
Test Arvind’s claim at the 10% significance level. [5]

9709 P61 - Jun 2022 - Q7 - 6 marks
In the past, the mean time for Jenny’s morning run was 28.2 minutes. She does some extra training and she wishes to test whether her mean time has been reduced. After the training Jenny takes a random sample of 40 morning runs. She decides that if the sample mean run time is less than 27 minutes she will conclude that the training has been effective. You may assume that, after the training, Jenny’s run time has a standard deviation of 4.0 minutes.
(a) State suitable null and alternative hypotheses for Jenny’s test. [1]
(b) Find the probability that Jenny will make a Type I error. [3]
Jenny found that the sample mean run time was 27.2 minutes.
(c) Explain briefly whether it is possible for her to make a Type I error or a Type II error or both. [2]

9709 P62 - Jun 2022 - Q2 - 5 marks
In the past, the mean height of plants of a particular species has been 2.3 m. A random sample of 60 plants of this species was treated with fertiliser and the mean height of these 60 plants was found to be 2.4 m. Assume that the standard deviation of the heights of plants treated with fertiliser is 0.4 m.
Carry out a test at the 2.5% significance level of whether the mean height of plants treated with fertiliser is greater than 2.3 m. [5]

9709 P62 - Jun 2022 - Q4 - 11 marks
The number of cars arriving at a certain road junction on a weekday morning has a Poisson distribution with mean 4.6 per minute. Traffic lights are installed at the junction and a council officer wishes to test at the 2% significance level whether there are now fewer cars arriving. He notes the number of cars arriving during a randomly chosen 2-minute period.
(a) State suitable null and alternative hypotheses for the test. [1]
(b) Find the critical region for the test. [4]
The officer notes that, during a randomly chosen 2-minute period on a weekday morning, exactly 5 cars arrive at the junction.
(c) Carry out the test. [2]
(d) State, with a reason, whether it is possible that a Type I error has been made in carrying out the test in part (c). [1]
The number of cars arriving at another junction on a weekday morning also has a Poisson distribution with mean 4.6 per minute.
(e) Use a suitable approximating distribution to find the probability that more than 300 cars will arrive at this junction in an hour. [3]


9709 P63 - Jun 2022 - Q2 - 6 marks
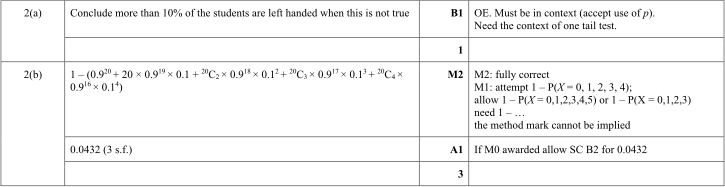
Anton believes that 10% of students at his college are left-handed. Aliya believes that this is an underestimate. She plans to carry out a hypothesis test of the null hypothesis \(p=0.1\) against the alternative hypothesis \(p>0.1\), where \(p\) is the actual proportion of students at the college that are left-handed. She chooses a random sample of 20 students from the college. She will reject the null hypothesis if at least 5 of these students are left-handed.
(a) Explain what is meant by a Type I error in this context. [1]
(b) Find the probability of a Type I error in the test. [3]
(c) Given that the true value of \(p\) is 0.3, find the probability of a Type II error in the test. [2]

9709 P63 - Jun 2022 - Q3 - 9 marks
Batteries of type A are known to have a mean life of 150 hours. It is required to test whether a new type of battery, type B, has a shorter mean life than type A batteries.
(a) Give a reason for using a sample rather than the whole population in carrying out this test. [1]
A random sample of 120 type B batteries are tested and it is found that their mean life is 147 hours, and an unbiased estimate of the population variance is \(225\text{ hours}^2\).
(b) Test, at the 2% significance level, whether type B batteries have a shorter mean life than type A batteries. [5]
(c) Calculate a 94% confidence interval for the population mean life of type B batteries. [3]


9709 P62 - Mar 2022 - Q2 - 5 marks
Harry has a five-sided spinner with sectors coloured blue, green, red, yellow and black. Harry thinks the spinner may be biased. He plans to carry out a hypothesis test with the following hypotheses.
\[H_0:P(\text{spinner lands on blue})=\frac15,\qquad H_1:P(\text{spinner lands on blue})\ne\frac15.\]
Harry spins the spinner 300 times. It lands on blue on 45 spins.
Use a suitable approximation to carry out Harry’s test at the 5% significance level. [5]

9709 P62 - Mar 2022 - Q4 - 6 marks
In the past the time, in minutes, taken by students to complete a certain challenge had mean 25.5 and standard deviation 5.2. A new challenge is devised and it is expected that students will take, on average, less than 25.5 minutes to complete this challenge. A random sample of 40 students is chosen and their mean time for the new challenge is found to be 23.7 minutes.
(a) Assuming that the standard deviation of the time for the new challenge is 5.2 minutes, test at the 1% significance level whether the population mean time for the new challenge is less than 25.5 minutes. [5]
(b) State, with a reason, whether it is possible that a Type I error was made in the test in part (a). [1]

9709 P61 - Nov 2021 - Q5 - 9 marks
(a) The proportion of people having a particular medical condition is 1 in 100 000. A random sample of 2500 people is obtained. The number of people in the sample having the condition is denoted by \(X\).
(a(i)) State, with a justification, a suitable approximating distribution for \(X\), giving the values of any parameters. [2]
(a(ii)) Use the approximating distribution to calculate \(P(X>0)\). [2]
(b) The percentage of people having a different medical condition is thought to be 30%. A researcher suspects that the true percentage is less than 30%. In a medical trial a random sample of 28 people was selected and 4 people were found to have this condition.
(b) Use a binomial distribution to test the researcher’s suspicion at the 2% significance level. [5]


9709 P61 - Nov 2021 - Q7 - 10 marks
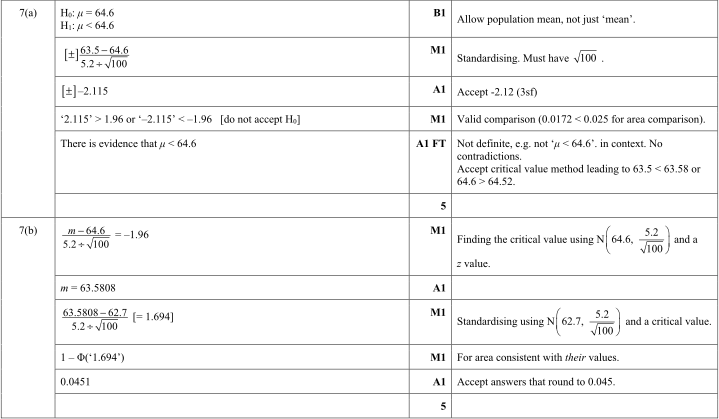
The masses, in grams, of apples from a certain farm have mean \(\mu\) and standard deviation 5.2. The farmer says that the value of \(\mu\) is 64.6. A quality control inspector claims that the value of \(\mu\) is actually less than 64.6. In order to test his claim he chooses a random sample of 100 apples from the farm.
(a) The mean mass of the 100 apples is found to be 63.5 g.
(a) Carry out the test at the 2.5% significance level. [5]
(b) Later another test of the same hypotheses at the 2.5% significance level, with another random sample of 100 apples from the same farm, is carried out.
(b) Given that the value of \(\mu\) is in fact 62.7, calculate the probability of a Type II error. [5]
9709 P62 - Nov 2021 - Q4 - 7 marks
A certain kind of firework is supposed to last for 30 seconds, on average, after it is lit. An inspector suspects that the fireworks actually last a shorter time than this, on average. He takes a random sample of 100 fireworks of this kind. Each firework in the sample is lit and the time it lasts is noted.
(a) Give a reason why it is necessary to take a sample rather than testing all the fireworks of this kind. [1]
It is given that the population standard deviation of the times that fireworks of this kind last is 5 seconds.
(b) The mean time lasted by the 100 fireworks in the sample is found to be 29 seconds.
(b) Test the inspector’s suspicion at the 1% significance level. [5]
(c) State with a reason whether the Central Limit theorem was needed in the solution to part (b). [1]

9709 P62 - Nov 2021 - Q6 - 10 marks
A machine is supposed to produce random digits. Bob thinks that the machine is not fair and that the probability of producing the digit 0 is less than \(1/10\). In order to test his suspicion he notes the number of times the digit 0 occurs in 30 digits produced by the machine. He carries out a test at the 10% significance level.
(a) State suitable null and alternative hypotheses. [1]
(b) Find the rejection region for the test. [4]
(c) State the probability of a Type I error. [1]
It is now given that the machine actually produces a 0 once in every 40 digits, on average.
(d) Find the probability of a Type II error. [3]
(e) Explain the meaning of a Type II error in this context. [1]

9709 P61 - Jun 2021 - Q8 - 11 marks
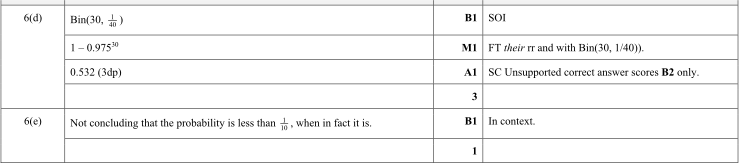
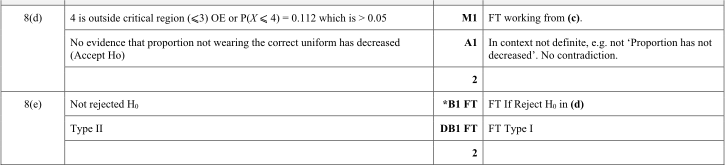
At a certain large school it was found that the proportion of students not wearing correct uniform was 0.15. The school sent a letter to parents asking them to ensure that their children wear the correct uniform. The school now wishes to test whether the proportion not wearing correct uniform has been reduced.
(a) It is suggested that a random sample of the students in Grade 12 should be used for the test.
(a) Give a reason why this would not be an appropriate sample. [1]
A suitable sample of 50 students is selected and the number not wearing correct uniform is noted. This figure is used to carry out a test at the 5% significance level.
(b) State suitable null and alternative hypotheses. [1]
(c) Use a binomial distribution to find the probability of a Type I error. You must justify your answer fully. [5]
(d) In fact 4 students out of the 50 are not wearing correct uniform.
(d) State the conclusion of the test, explaining your answer. [2]
(e) State, with a reason, which of the errors, Type I or Type II, may have been made. [2]

9709 P62 - Jun 2021 - Q1 - 6 marks
In a game, a ball is thrown and lands in one of 4 slots, labelled A, B, C and D. Raju wishes to test whether the probability that the ball will land in slot A is \(1/4\).
(a) State suitable null and alternative hypotheses for Raju’s test. [1]
The ball is thrown 100 times and it lands in slot A 15 times.
(b) Use a suitable approximating distribution to carry out the test at the 2% significance level. [5]

9709 P62 - Jun 2021 - Q5 - 6 marks
The time, in minutes, spent by customers at a particular gym has the distribution \(N(\mu,38.2)\). In the past the value of \(\mu\) has been 42.4. Following the installation of some new equipment management wishes to test whether the value of \(\mu\) has changed.
(a) State what is meant by a Type I error in this context. [1]
(b) The mean time for a sample of 20 customers is found to be 45.6 minutes.
(b) Test at the 2.5% significance level whether the value of \(\mu\) has changed. [5]

9709 P63 - Jun 2021 - Q2 - 8 marks
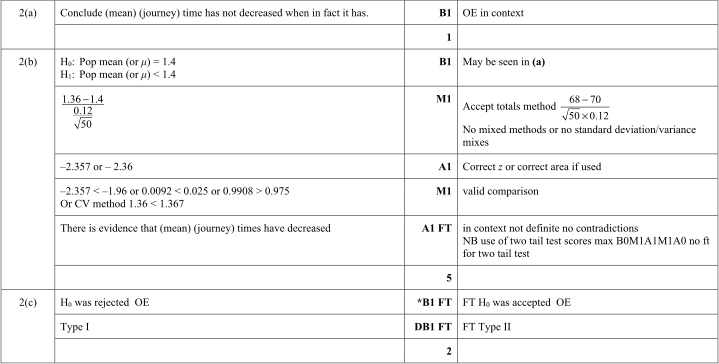
In the past, the time, in hours, for a particular train journey has had mean 1.40 and standard deviation 0.12. Following the introduction of some new signals, it is required to test whether the mean journey time has decreased.
(a) State what is meant by a Type II error in this context. [1]
(b) The mean time for a random sample of 50 journeys is found to be 1.36 hours.
(b) Assuming that the standard deviation of journey times is still 0.12 hours, test at the 2.5% significance level whether the population mean journey time has decreased. [5]
(c) State, with a reason, which of the errors, Type I or Type II, might have been made in the test in part (b). [2]
9709 P63 - Jun 2021 - Q3 - 6 marks
The local council claims that the average number of accidents per year on a particular road is 0.8. Jane claims that the true average is greater than 0.8. She looks at the records for a random sample of 3 recent years and finds that the total number of accidents during those 3 years was 5.
(a) Assume that the number of accidents per year follows a Poisson distribution.
(a(i)) State null and alternative hypotheses for a test of Jane’s claim. [1]
(a(ii)) Test at the 5% significance level whether Jane’s claim is justified. [4]
(b) Jane finds that the number of accidents per year has been gradually increasing over recent years.
(b) State how this might affect the validity of the test carried out in part (a)(ii). [1]

9709 P62 - Mar 2021 - Q3 - 4 marks
An architect wishes to investigate whether the buildings in a certain city are higher, on average, than buildings in other cities. He takes a large random sample of buildings from the city and finds the mean height of the buildings in the sample. He calculates the value of the test statistic, \(z\), and finds that \(z=2.41\).
(a) Explain briefly whether he should use a one-tail test or a two-tail test. [1]
(b) Carry out the test at the 1% significance level. [3]

9709 P62 - Mar 2021 - Q6 - 10 marks
It is known that 8% of adults in a certain town own a Chantor car. After an advertising campaign, a car dealer wishes to investigate whether this proportion has increased. He chooses a random sample of 25 adults from the town and notes how many of them own a Chantor car.
(a) He finds that 4 of the 25 adults own a Chantor car.
(a) Carry out a hypothesis test at the 5% significance level. [5]
(b) Explain which of the errors, Type I or Type II, might have been made in carrying out the test in part (a). [2]
Later, the car dealer takes another random sample of 25 adults from the town and carries out a similar hypothesis test at the 5% significance level.
(c) Find the probability of a Type I error. [3]

9709 P61 - Nov 2020 - Q5 - 13 marks
The number of absences per week by workers at a factory has the distribution \(\operatorname{Po}(2.1)\).
(a) Find the standard deviation of the number of absences per week. [1]
(b) Find the probability that the number of absences in a 2-week period is at least 2. [3]
(c) Find the probability that the number of absences in a 3-week period is more than 4 and less than 8. [2]
Following a change in working conditions, the management wished to test whether the mean number of absences has decreased. They found that, in a randomly chosen 3-week period, there were exactly 2 absences.
(d) Carry out the test at the 10% significance level. [5]
(e) State, with a reason, which of the errors, Type I or Type II, might have been made in carrying out the test in part (d). [2]


9709 P61 - Nov 2020 - Q6 - 12 marks
The time, in minutes, for Anjan’s journey to work on Mondays has mean 38.4 and standard deviation 6.9.
(a) Find the probability that Anjan’s mean journey time for a random sample of 30 Mondays is between 38 and 40 minutes. [5]
Anjan wishes to test whether his mean journey time is different on Tuesdays. He chooses a random sample of 30 Tuesdays and finds that his mean journey time for these 30 Tuesdays is 40.2 minutes. Assume that the standard deviation for his journey time on Tuesdays is 6.9 minutes.
(b(i)) State, with a reason, whether Anjan should use a one-tail or a two-tail test. [1]
(b(ii)) Carry out the test at the 10% significance level. [5]
(b(iii)) Explain whether it was necessary to use the Central Limit theorem in part (b)(ii). [1]


9709 P62 - Nov 2020 - Q4 - 8 marks
The areas, \(X\text{ cm}^2\), of petals of a certain kind of flower have mean \(\mu\text{ cm}^2\). In the past it has been found that \(\mu=8.9\). Following a change in the climate, a botanist claims that the mean is no longer 8.9. The areas of a random sample of 200 petals from this kind of flower are measured, and the results are summarised as \[\sum x=1850,\qquad\sum x^2=17850.\]
Test the botanist’s claim at the 2.5% significance level. [8]

9709 P62 - Nov 2020 - Q6 - 9 marks
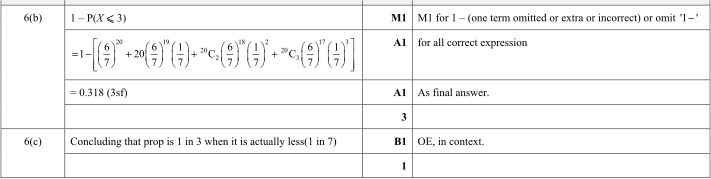
A biscuit manufacturer claims that, on average, 1 in 3 packets of biscuits contain a prize offer. Gerry suspects that the proportion of packets containing the prize offer is less than 1 in 3. To test the manufacturer’s claim, he buys 20 randomly selected packets. Exactly 2 contain the prize offer.
(a) Carry out the test at the 10% significance level. [5]
Maria also suspects that the proportion is less than 1 in 3. She also tests at the 10% significance level using 20 randomly selected packets. She will reject the manufacturer’s claim if 3 or fewer packets contain the prize offer.
(b) Find the probability of a Type II error in Maria’s test if the true proportion of packets containing the prize offer is 1 in 7. [3]
(c) Explain what is meant by a Type II error in this context. [1]

9709 P61 - Jun 2020 - Q2 - 7 marks
In the past the yield of a certain crop, in tonnes per hectare, had mean 0.56 and standard deviation 0.08. Following the introduction of a new fertilizer, the farmer intends to test at the 2.5% significance level whether the mean yield has increased. He finds that the mean yield over 10 years is 0.61 tonnes per hectare.
(a) State two assumptions that are necessary for the test. [2]
(b) Carry out the test. [5]

9709 P61 - Jun 2020 - Q4 - 6 marks
A fair spinner has five sides numbered 1, 2, 3, 4, 5. The score on one spin is denoted by \(X\).
(a) Show that \(\operatorname{Var}(X)=2\). [1]
Fiona has another spinner, also with five sides numbered 1, 2, 3, 4, 5. She suspects that it is biased so that the expected score is less than 3. To test her suspicion, she plans to spin her spinner 40 times. If the mean score is less than 2.6 she will conclude that her spinner is biased in this way.
(b) Find the probability of a Type I error. [4]
(c) State what is meant by a Type II error in this context. [1]

9709 P62 - Jun 2020 - Q2 - 6 marks
A shop obtains apples from a certain farm. It has been found that 5% of apples from this farm are Grade A. Following a change in growing conditions, the shop management plan to test whether the proportion of Grade A apples has increased. They select 25 apples at random. If more than 3 are Grade A they will conclude that the proportion has increased.
(a) State suitable null and alternative hypotheses. [1]
(b) Find the probability of a Type I error. [3]
In fact 2 of the 25 apples were Grade A.
(c) Which of the errors, Type I or Type II, is possible? Justify your answer. [2]

9709 P62 - Jun 2020 - Q4 - 12 marks
The score on one spin of a 5-sided spinner is denoted by \(X\), with probability distribution as shown.
| \(x\) | 0 | 1 | 2 | 3 | 4 |
|---|---|---|---|---|---|
| \(\mathrm P(X=x)\) | 0.1 | 0.2 | 0.4 | 0.2 | 0.1 |
(a) Show that \(\operatorname{Var}(X)=1.2\). [2]
The spinner is spun 200 times. The scores are noted and their mean, \(\bar X\), is found.
(b) Given that \(\mathrm P(\bar X>a)=0.1\), find \(a\). [4]
(c) Explain whether it was necessary to use the Central Limit theorem in your answer to part (b). [1]
Johann has another, similar, spinner. He suspects that it is biased so that the mean score is less than 2. He spins it 200 times and finds that the mean score is 1.86.
(d) Given that the variance of the score on one spin of this spinner is also 1.2, test Johann’s suspicion at the 5% significance level. [5]

9709 P63 - Jun 2020 - Q3 - 6 marks
The number of customers visiting a shop between 9.00 and 10.00 am has distribution \(\operatorname{Po}(\lambda)\). In the past \(\lambda=5.2\). Following new advertising, the manager wishes to test whether \(\lambda\) has increased. A random sample of 20 days has a total of 125 customers visiting between these times.
Use an approximating distribution to test at the 2.5% significance level whether \(\lambda\) has increased. [6]

9709 P63 - Jun 2020 - Q7 - 9 marks
A market researcher is investigating the time customers spend at an information desk. He plans to choose a sample of 50 customers on a particular day. He considers choosing the first 50 customers who visit the desk.
(a) Explain why this method is unsuitable. [1]
The times, in minutes, may be assumed to have mean \(\mu\) and variance 4.8. In the past \(\mu=6.0\). The researcher wishes to test at the 2% significance level whether this is still true. He chooses a random sample of 50 customers and records their times.
(b) State the probability of a Type I error and explain what a Type I error means in this context. [2]
(c) Given that the sample mean is 6.8 minutes, carry out the test. [5]
(d) Give a reason why it was necessary to use the Central Limit theorem in part (c). [1]


9709 P62 - Mar 2020 - Q3 - 8 marks
In the past, Freda’s mean time for a particular daily journey was 39.2 minutes. Following the introduction of a one-way system, she wishes to test whether the mean journey time has decreased. For 40 randomly chosen journeys, with times \(t\) minutes, \[n=40,\qquad\sum t=1504,\qquad\sum t^2=57760.\]
(a) Calculate unbiased estimates of the population mean and variance of the new journey time. [3]
(b) Test, at the 5% significance level, whether the population mean time has decreased. [5]

9709 P62 - Mar 2020 - Q7 - 8 marks
A national survey shows that 95% of Year 12 students use social media. Arvin suspects that the percentage at his college is lower. He chooses a random sample of 20 students at his college and records how many use social media. He tests at the 2% significance level.
(a) Find the rejection region. [4]
(b) Find the probability of a Type I error. [1]
Jimmy believes that the true percentage at Arvin’s college is 70%.
(c) Assuming Jimmy is correct, find the probability of a Type II error. [3]

