9709 P13 - Nov 2023 - Q8A - 2 marks
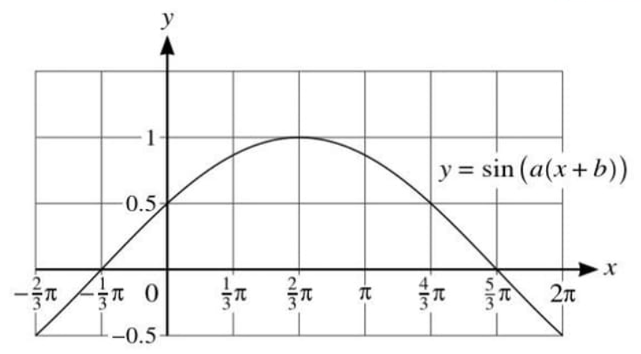
The diagram shows part of the graph of \(y = \sin(a(x + b))\), where \(a\) and \(b\) are positive constants. The graph is plotted with the x-axis ranging from \(-\frac{2}{3}\pi\) to \(2\pi\) and the y-axis ranging from -1 to 1. State the value of \(a\) and one possible value of \(b\).
9709 P13 - Jun 2022 - Q2 - 3 marks
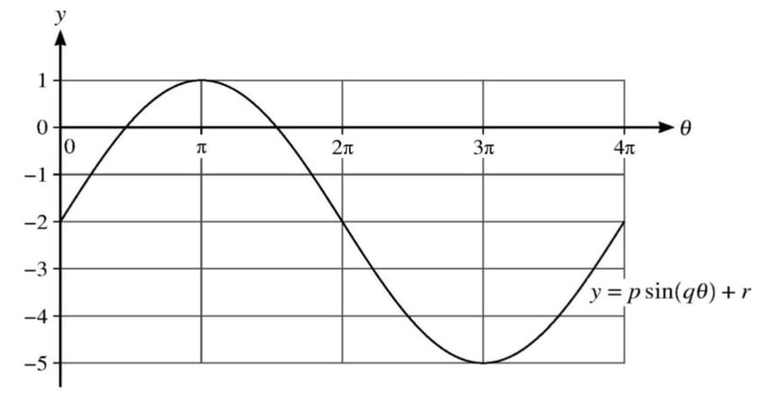
The diagram shows part of the curve with equation \(y = p \sin(q\theta) + r\), where \(p, q\) and \(r\) are constants.
(a) State the value of \(p\).
(b) State the value of \(q\).
(c) State the value of \(r\).
9709 P11 - Nov 2021 - Q5 - 5 marks
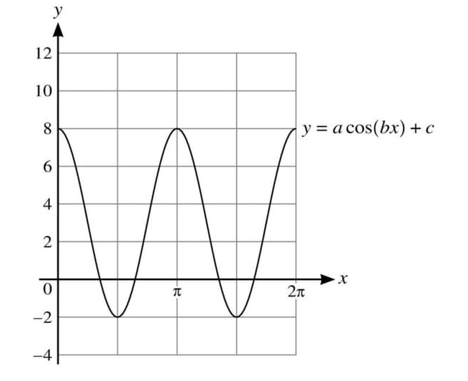
The diagram shows part of the graph of \(y = a \cos(bx) + c\).
(a) Find the values of the positive integers \(a\), \(b\) and \(c\).
(b) For these values of \(a\), \(b\) and \(c\), use the given diagram to determine the number of solutions in the interval \(0 \leq x \leq 2\pi\) for each of the following equations.
(i) \(a \cos(bx) + c = \frac{6}{\pi} x\)
(ii) \(a \cos(bx) + c = 6 - \frac{6}{\pi} x\)
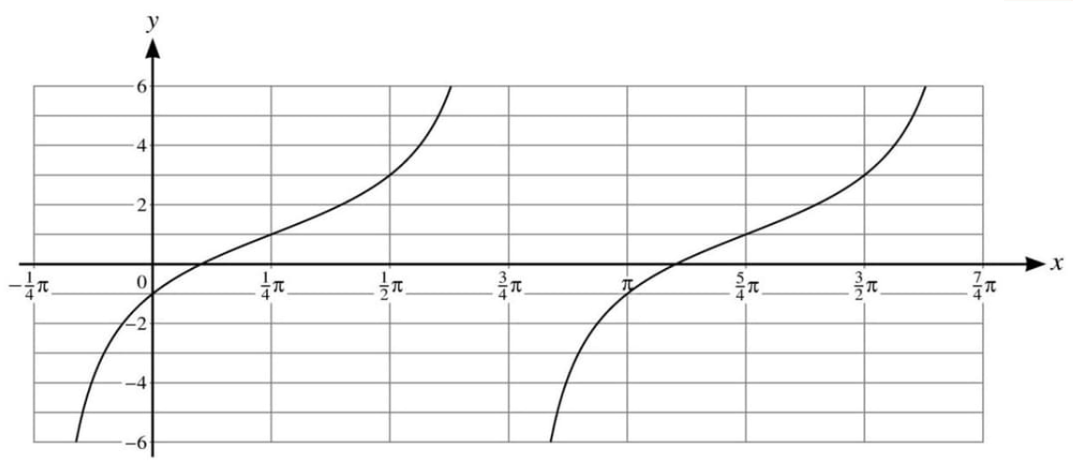
9709 P11 - Jun 2021 - Q4 - 3 marks
The diagram shows part of the graph of \(y = a \tan(x - b) + c\).
Given that \(0 < b < \pi\), state the values of the constants \(a\), \(b\), and \(c\).
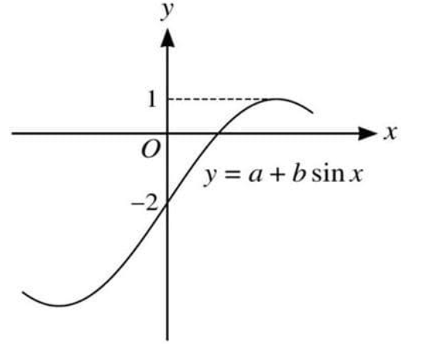
9709 P11 - Nov 2017 - Q7A - 2 marks
The diagram shows part of the graph of \(y = a + b \sin x\). Find the values of the constants \(a\) and \(b\).
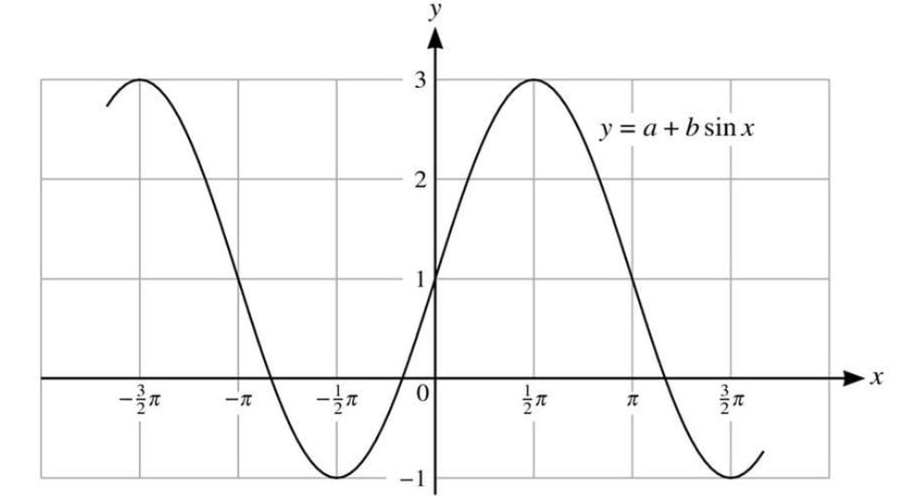
9709 P11 - Jun 2014 - Q1 - 2 marks
The diagram shows part of the graph of \(y = a + b \sin x\). State the values of the constants \(a\) and \(b\).
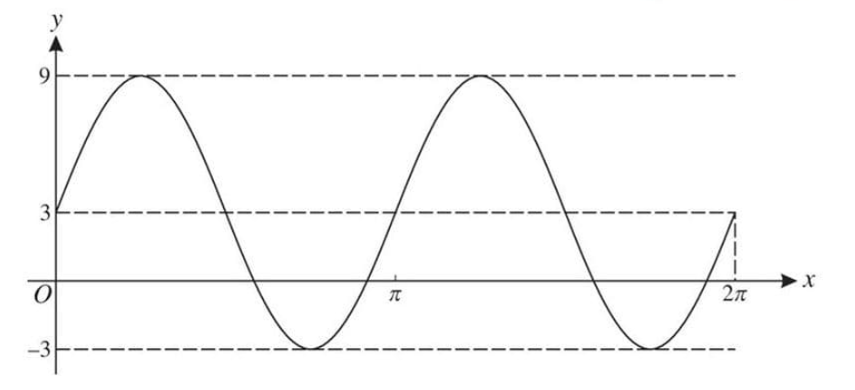
9709 P1 - Jun 2009 - Q4 - 6 marks
The diagram shows the graph of \(y = a \sin(bx) + c\) for \(0 \leq x \leq 2\pi\).
(i) Find the values of \(a, b\) and \(c\).
(ii) Find the smallest value of \(x\) in the interval \(0 \leq x \leq 2\pi\) for which \(y = 0\).
9709 P12 - Nov 2020 - Q11
A curve has equation \(y = 3 \cos 2x + 2\) for \(0 \leq x \leq \pi\).
(a) State the greatest and least values of \(y\).
(b) Sketch the graph of \(y = 3 \cos 2x + 2\) for \(0 \leq x \leq \pi\).
(c) By considering the straight line \(y = kx\), where \(k\) is a constant, state the number of solutions of the equation \(3 \cos 2x + 2 = kx\) for \(0 \leq x \leq \pi\) in each of the following cases.
(i) \(k = -3\)
(ii) \(k = 1\)
(iii) \(k = 3\)
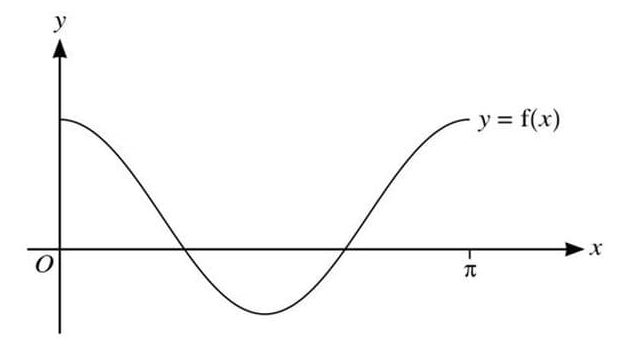
9709 P1 - Jun 2007 - Q8 - 8 marks
The function f is defined by f(x) = a + b cos 2x, for 0 ≤ x ≤ π. It is given that f(0) = -1 and f(\(\frac{1}{2}\pi\)) = 7.
- Find the values of a and b.
- Find the x-coordinates of the points where the curve y = f(x) intersects the x-axis.
- Sketch the graph of y = f(x).
9709 P1 - Nov 2004 - Q4 - 5 marks
(i) Sketch and label, on the same diagram, the graphs of \(y = 2 \sin x\) and \(y = \cos 2x\), for the interval \(0 \leq x \leq \pi\).
(ii) Hence state the number of solutions of the equation \(2 \sin x = \cos 2x\) in the interval \(0 \leq x \leq \pi\).
9709 P1 - Jun 2003 - Q6 - 5 marks
(i) Sketch the graph of the curve \(y = 3 \sin x\), for \(-\pi \leq x \leq \pi\).
The straight line \(y = kx\), where \(k\) is a constant, passes through the maximum point of this curve for \(-\pi \leq x \leq \pi\).
(ii) Find the value of \(k\) in terms of \(\pi\).
(iii) State the coordinates of the other point, apart from the origin, where the line and the curve intersect.
9709 P1 - Jun 2002 - Q6 - 7 marks
The function \(f\), where \(f(x) = a \sin x + b\), is defined for the domain \(0 \leq x \leq 2\pi\). Given that \(f\left(\frac{1}{2}\pi\right) = 2\) and that \(f\left(\frac{3}{2}\pi\right) = -8\),
(i) find the values of \(a\) and \(b\),
(ii) find the values of \(x\) for which \(f(x) = 0\), giving your answers in radians correct to 2 decimal places,
(iii) sketch the graph of \(y = f(x)\).
9709 P12 - Nov 2018 - Q4 - 6 marks
Functions \(f\) and \(g\) are defined by
\(f : x \mapsto 2 - 3 \cos x\) for \(0 \leq x \leq 2\pi\),
\(g : x \mapsto \frac{1}{2} x\) for \(0 \leq x \leq 2\pi\).
(i) Solve the equation \(fg(x) = 1\).
(ii) Sketch the graph of \(y = f(x)\).
9709 P12 - Jun 2018 - Q10 - 8 marks
(i) Solve the equation \(2 \cos x + 3 \sin x = 0\), for \(0^\circ \leq x \leq 360^\circ\).
(ii) Sketch, on the same diagram, the graphs of \(y = 2 \cos x\) and \(y = -3 \sin x\) for \(0^\circ \leq x \leq 360^\circ\).
(iii) Use your answers to parts (i) and (ii) to find the set of values of \(x\) for \(0^\circ \leq x \leq 360^\circ\) for which \(2 \cos x + 3 \sin x > 0\).
9709 P13 - Jun 2013 - Q5 - 6 marks
(i) Sketch, on the same diagram, the curves \(y = \sin 2x\) and \(y = \cos x - 1\) for \(0 \leq x \leq 2\pi\).
(ii) Hence state the number of solutions, in the interval \(0 \leq x \leq 2\pi\), of the equations
(a) \(2 \sin 2x + 1 = 0\),
(b) \(\sin 2x - \cos x + 1 = 0\).
9709 P12 - Nov 2011 - Q5 - 7 marks
(i) Sketch, on the same diagram, the graphs of \(y = \sin x\) and \(y = \cos 2x\) for \(0^\circ \leq x \leq 180^\circ\).
(ii) Verify that \(x = 30^\circ\) is a root of the equation \(\sin x = \cos 2x\), and state the other root of this equation for which \(0^\circ \leq x \leq 180^\circ\).
(iii) Hence state the set of values of \(x\), for \(0^\circ \leq x \leq 180^\circ\), for which \(\sin x < \cos 2x\).
9709 P11 - Nov 2011 - Q3 - 5 marks
(i) Sketch, on a single diagram, the graphs of \(y = \cos 2\theta\) and \(y = \frac{1}{2}\) for \(0 \leq \theta \leq 2\pi\).
(ii) Write down the number of roots of the equation \(2\cos 2\theta - 1 = 0\) in the interval \(0 \leq \theta \leq 2\pi\).
(iii) Deduce the number of roots of the equation \(2\cos 2\theta - 1 = 0\) in the interval \(10\pi \leq \theta \leq 20\pi\).
9709 P13 - Nov 2010 - Q4 - 4 marks
(i) Sketch the curve \(y = 2 \sin x\) for \(0 \leq x \leq 2\pi\).
(ii) By adding a suitable straight line to your sketch, determine the number of real roots of the equation \(2\pi \sin x = \pi - x\). State the equation of the straight line.
Problem #536
The equation of a curve is \(y = 3 \cos 2x\). The equation of a line is \(x + 2y = \pi\). On the same diagram, sketch the curve and the line for \(0 \leq x \leq \pi\).
Problem #537
The function \(f\) is such that \(f(x) = a - b \cos x\) for \(0^\circ \leq x \leq 360^\circ\), where \(a\) and \(b\) are positive constants. The maximum value of \(f(x)\) is 10 and the minimum value is \(-2\).
- Find the values of \(a\) and \(b\).
- Solve the equation \(f(x) = 0\).
- Sketch the graph of \(y = f(x)\).
9709 P13 - Nov 2023 - Q8B - 3 marks
Another curve, with equation \(y = f(x)\), has a single stationary point at the point \((p, q)\), where \(p\) and \(q\) are constants. This curve is transformed to a curve with equation
\(y = -3f\left(\frac{1}{4}(x + 8)\right).\)
For the transformed curve, find the coordinates of the stationary point, giving your answer in terms of \(p\) and \(q\).
9709 P12 - Jun 2023 - Q8D - 6 marks
Describe fully a sequence of three transformations which can be combined to transform the graph of \(y = \sin x\) for \(0 \leq x \leq \frac{1}{2}\pi\) to the graph of \(y = f(x)\), where \(f(x) = 3 + 2 \sin \frac{1}{4}x\), making clear the order in which the transformations are applied.
9709 P11 - Jun 2022 - Q8A - 5 marks
The curve \(y = \sin x\) is transformed to the curve \(y = 4 \sin\left(\frac{1}{2}x - 30^\circ\right)\).
Describe fully a sequence of transformations that have been combined, making clear the order in which the transformations are applied.
9709 P12 - Jun 2021 - Q2B - 2 marks
The curve \(y = \\sin 2x - 5x\) is reflected in the \(y\)-axis and then stretched by scale factor \(\frac{1}{3}\) in the \(x\)-direction.
Write down the equation of the transformed curve.
9709 P12 - Nov 2020 - Q11DE - 4 marks
Functions f, g and h are defined for \(x \in \mathbb{R}\) by
\(f(x) = 3 \cos 2x + 2\),
\(g(x) = f(2x) + 4\),
\(h(x) = 2f\left(x + \frac{1}{2}\pi\right)\).
(d) Describe fully a sequence of transformations that maps the graph of \(y = f(x)\) on to \(y = g(x)\). [2]
(e) Describe fully a sequence of transformations that maps the graph of \(y = f(x)\) on to \(y = h(x)\). [2]
9709 P11 - Nov 2020 - Q4 - 3 marks
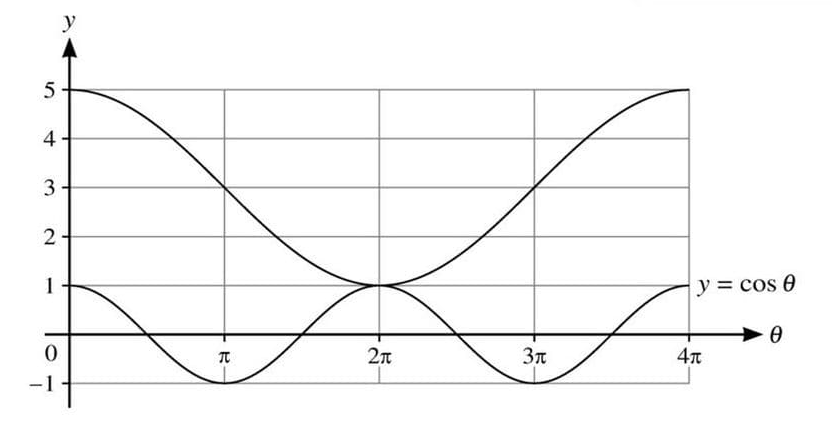
In the diagram, the lower curve has equation \(y = \cos \theta\). The upper curve shows the result of applying a combination of transformations to \(y = \cos \theta\).
Find, in terms of a cosine function, the equation of the upper curve.
Problem #558
Functions f and g are such that
\(f(x) = 2 - 3 \sin 2x \quad \text{for} \; 0 \leq x \leq \pi,\)
\(g(x) = -2f(x) \quad \text{for} \; 0 \leq x \leq \pi.\)
(a) State the ranges of f and g.
The diagram below shows the graph of \(y = f(x)\).
(b) Sketch, on this diagram, the graph of \(y = g(x)\).
The function h is such that
\(h(x) = g(x + \pi) \quad \text{for} \; -\pi \leq x \leq 0.\)
(c) Describe fully a sequence of transformations that maps the curve \(y = f(x)\) on to \(y = h(x)\).

Problem #559
The diagram shows the graph of \(y = f(x)\), where \(f(x) = \frac{3}{2} \cos 2x + \frac{1}{2}\) for \(0 \leq x \leq \pi\).
(a) State the range of \(f\).
A function \(g\) is such that \(g(x) = f(x) + k\), where \(k\) is a positive constant. The x-axis is a tangent to the curve \(y = g(x)\).
(b) State the value of \(k\) and hence describe fully the transformation that maps the curve \(y = f(x)\) on to \(y = g(x)\).
(c) State the equation of the curve which is the reflection of \(y = f(x)\) in the x-axis. Give your answer in the form \(y = a \cos 2x + b\), where \(a\) and \(b\) are constants.