9231 P21 - Nov 2018 - Q10 - 12 marks
For a random sample of 10 observations of pairs of values \((x, y)\), the equation of the regression line of \(y\) on \(x\) is \(y=1.1664+0.4604 x\). It is given that
\[\Sigma x^{2}=1419.98 \quad \text { and } \quad \Sigma y^{2}=439.68 .\]
The mean value of \(y\) is 6.24 .
(i) Find the equation of the regression line of \(x\) on \(y\).
(ii) Find the product moment correlation coefficient.
(iii) Test at the \(5 \%\) significance level whether there is evidence of positive correlation between the two variables.

9231 P21 - Nov 2019 - Q9 - 10 marks
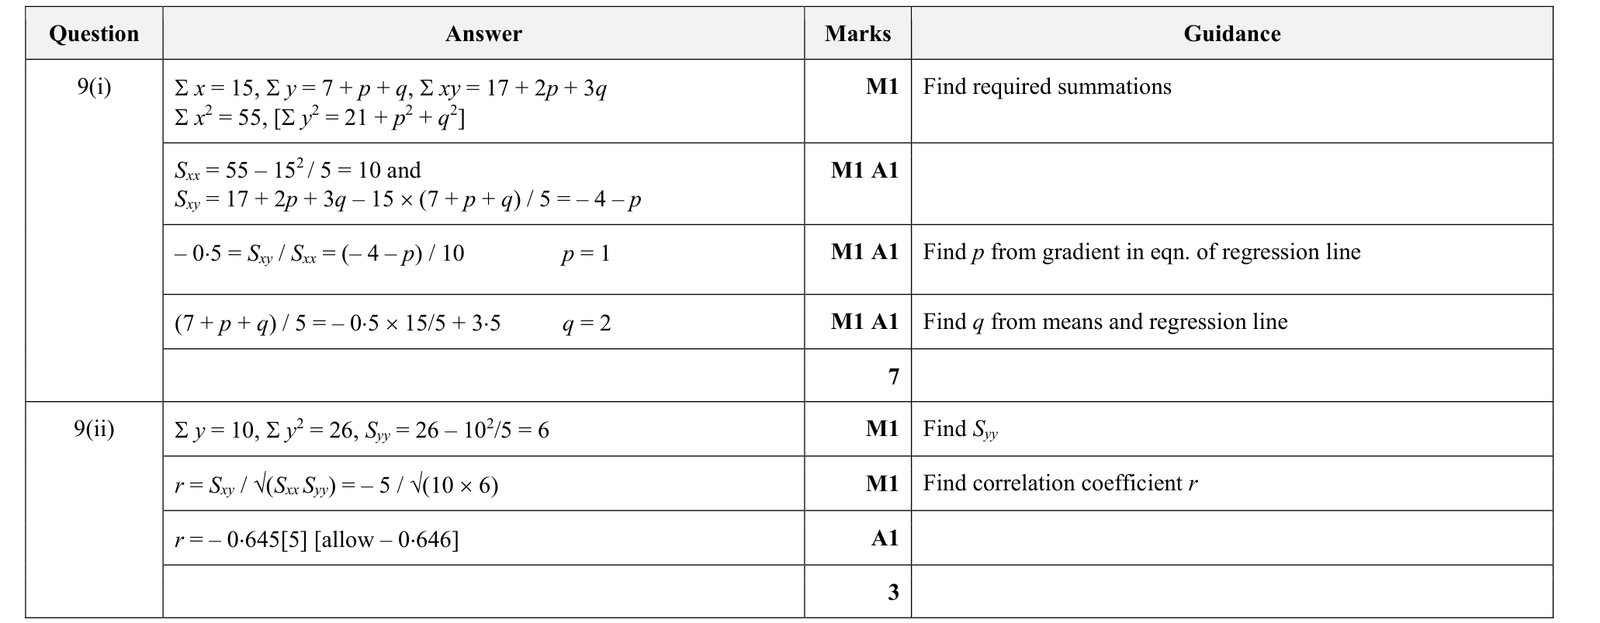
A random sample of five pairs of values of \(x\) and \(y\) is taken from a bivariate distribution. The values are shown in the following table, where \(p\) and \(q\) are constants.
| \(x\) | 1 | 2 | 3 | 4 | 5 |
|---|---|---|---|---|---|
| \(y\) | 4 | \(p\) | \(q\) | 2 | 1 |
The equation of the regression line of \(y\) on \(x\) is \(y=-0.5x+3.5\).
(i) Find the values of \(p\) and \(q\).
(ii) Find the value of the product moment correlation coefficient.
9231 P23 - Jun 2019 - Q10 - 12 marks
The means and variances for a random sample of 8 pairs of values of \(x\) and \(y\) taken from a bivariate distribution are given in the following table.
| Mean | Variance | |
|---|---|---|
| \(x\) | 3.3125 | 3.3086 |
| \(y\) | 6.7375 | 7.9473 |
The product moment correlation coefficient for the sample is \(0.5815\), correct to 4 decimal places.
(i) Find the equation of the regression line of \(y\) on \(x\).
(ii) Test at the \(5\%\) significance level whether there is evidence of positive correlation between \(x\) and \(y\).
(iii) Calculate an estimate of \(y\) when \(x=6.0\) and comment on the reliability of your estimate.

9231 P21 - Jun 2019 - Q10 - 11 marks
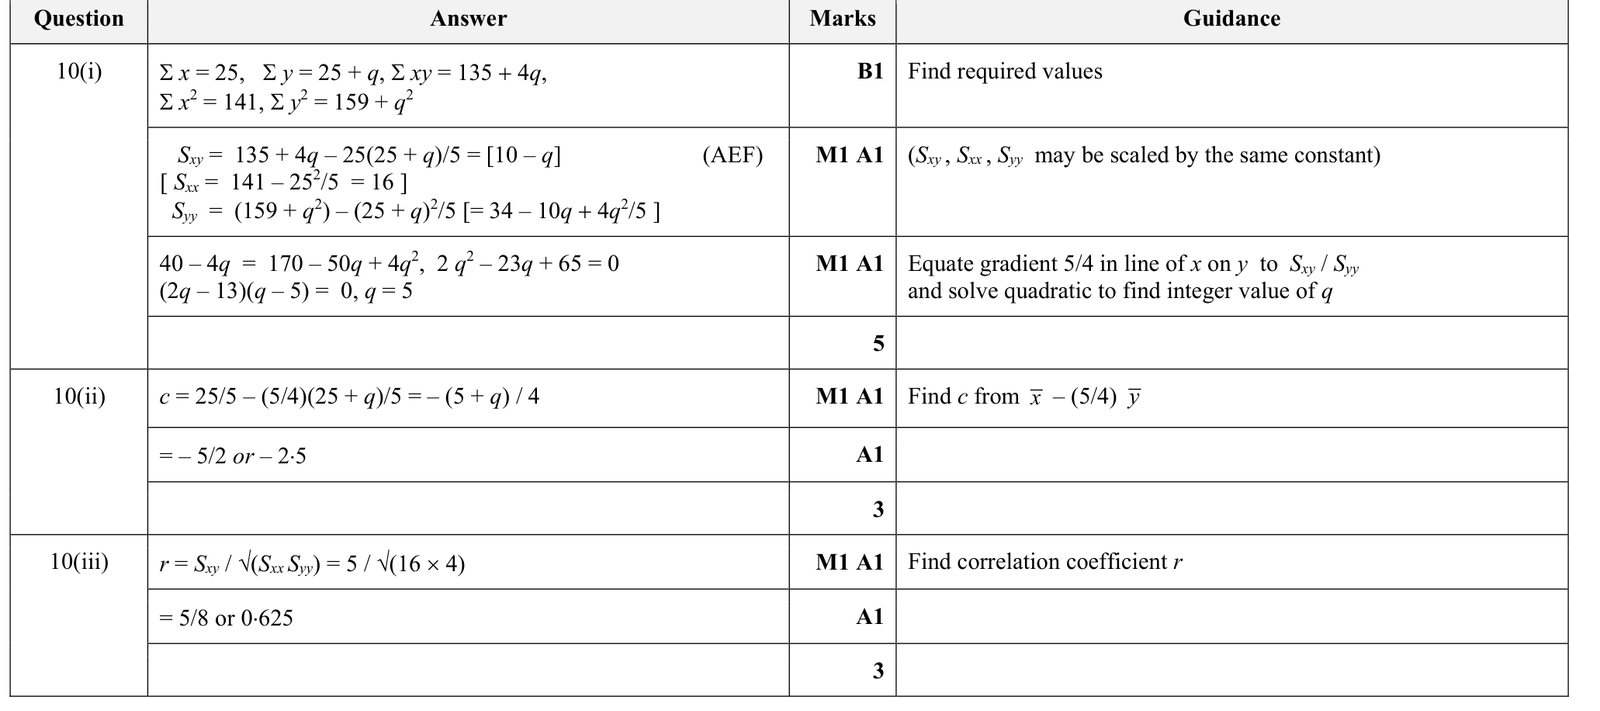
The values from a random sample of five pairs \((x,y)\) taken from a bivariate distribution are shown below.
| \(x\) | 3 | 4 | 4 | 6 | 8 |
|---|---|---|---|---|---|
| \(y\) | 5 | 7 | \(q\) | 6 | 7 |
The equation of the regression line of \(x\) on \(y\) is given by \(x=\dfrac{5}{4}y+c\).
(i) Given that \(q\) is an integer, find its value.
(ii) Find the value of \(c\).
(iii) Find the value of the product moment correlation coefficient.
9231 P22 - Nov 2018 - Q9 - 11 marks
For a random sample of 5 observations of pairs of values \((x, y)\), the equation of the regression line of \(y\) on \(x\) is \(y=4.2+c x\) and the equation of the regression line of \(x\) on \(y\) is \(x=10.8+d y\), where \(c\) and \(d\) are constants. The product moment correlation coefficient is -0.7214 and the mean value of \(x\) is 7.018 .
(i) Test at the 5\% significance level whether there is evidence of non-zero correlation between the variables.
(ii) Find the values of \(c\) and \(d\).
(iii) Use an appropriate regression line to estimate the value of \(x\) when \(y=3.5\), and comment on the reliability of your estimate.

9231 P21 - Jun 2017 - Q10 - 11 marks
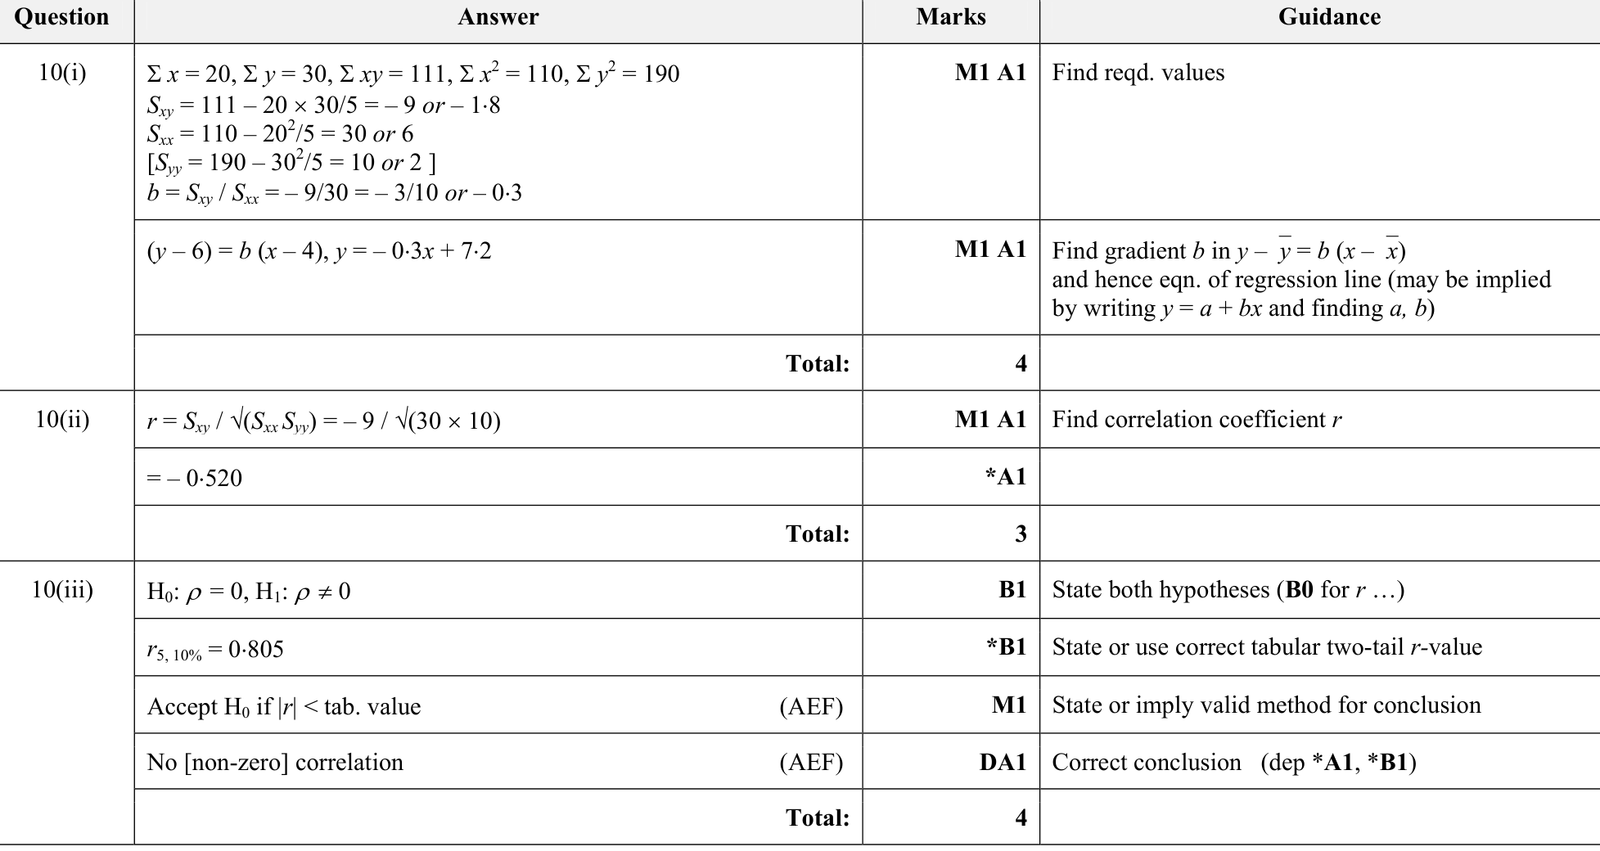
A random sample of 5 pairs of values \((x,y)\) is given in the following table.
| \(x\) | 1 | 2 | 4 | 5 | 8 |
|---|---|---|---|---|---|
| \(y\) | 7 | 5 | 8 | 6 | 4 |
(i) Find, showing all necessary working, the equation of the regression line of \(y\) on \(x\).
(ii) Find, showing all necessary working, the value of the product moment correlation coefficient for this sample.
(iii) Test, at the \(10\%\) significance level, whether there is evidence of non-zero correlation between the variables.
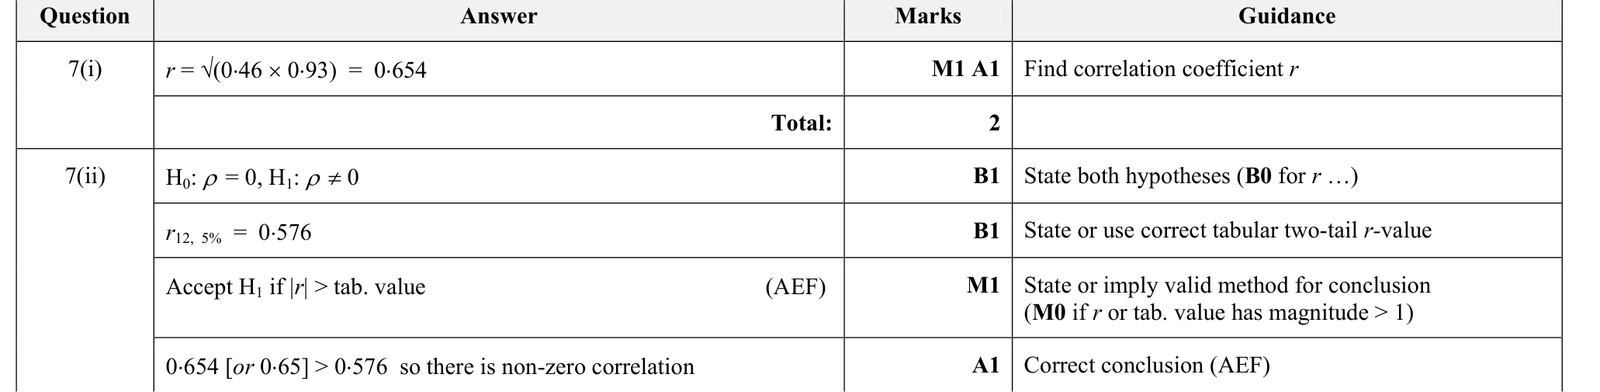
9231 P23 - Jun 2017 - Q7 - 6 marks
A random sample of twelve pairs of values of \(x\) and \(y\) is taken from a bivariate distribution. The equations of the regression lines of \(y\) on \(x\) and of \(x\) on \(y\) are respectively
\[y=0.46 x+1.62 \quad \text { and } \quad x=0.93 y+8.24\]
(i) Find the value of the product moment correlation coefficient for this sample.
(ii) Using a 5\% significance level, test whether there is non-zero correlation between the variables.
9231 P21 - Nov 2017 - Q9 - 9 marks
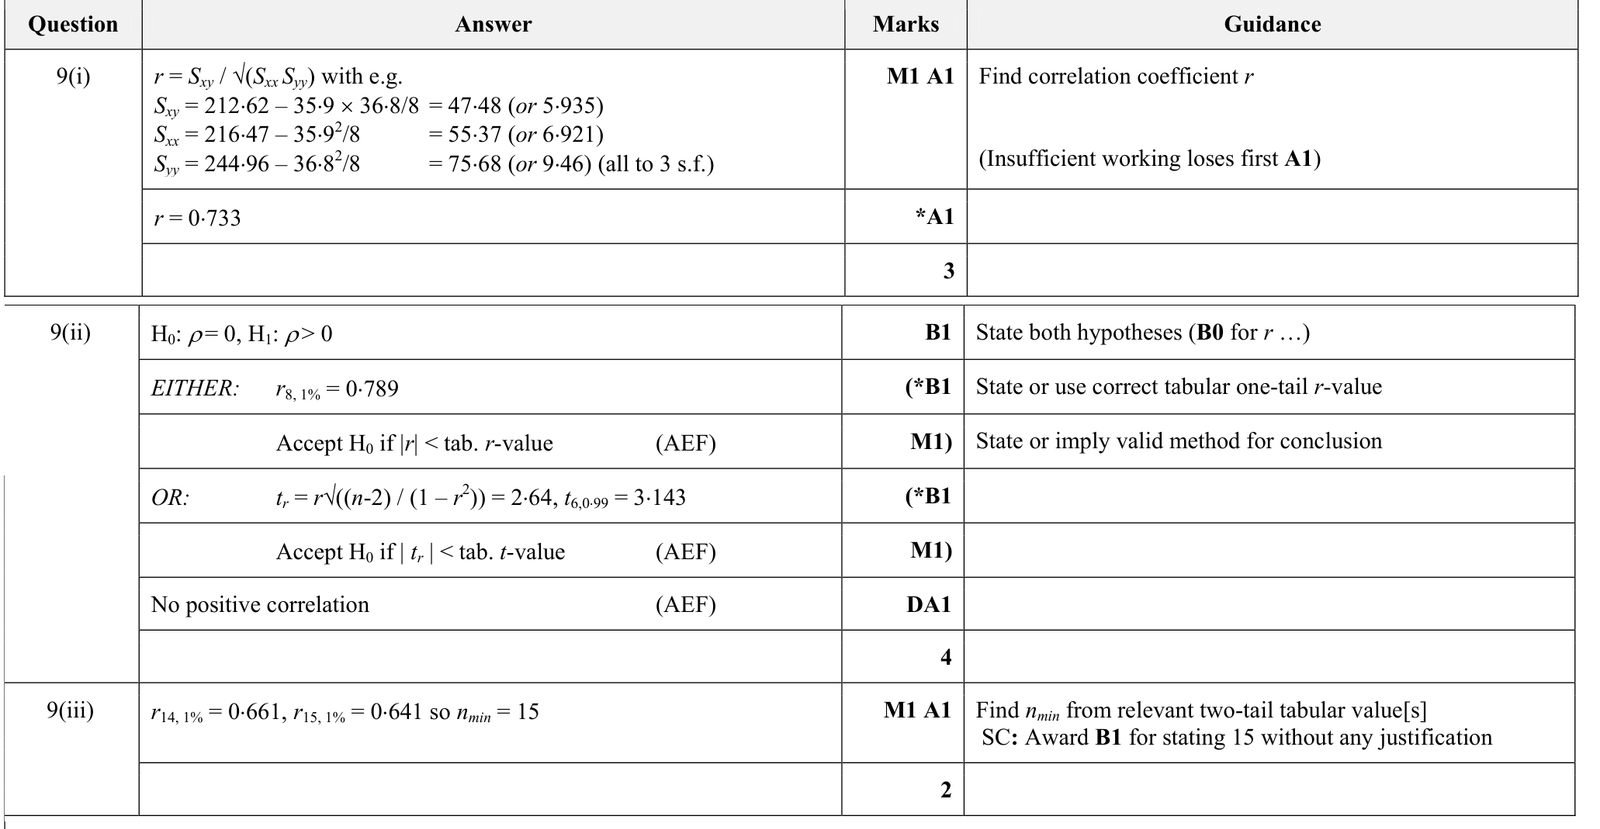
The land areas \(x\) (in suitable units) and populations \(y\) (in millions) for a sample of 8 randomly chosen cities are given in the following table.
| Land area \((x)\) | 1.0 | 4.5 | 2.4 | 1.6 | 3.8 | 8.6 | 7.5 | 6.5 |
|---|---|---|---|---|---|---|---|---|
| Population \((y)\) | 0.8 | 8.4 | 4.2 | 1.6 | 2.2 | 10.2 | 4.2 | 5.2 |
\[ \left[\sum x=35.9,\quad \sum x^{2}=216.47,\quad \sum y=36.8,\quad \sum y^{2}=244.96,\quad \sum xy=212.62\right] \]
(i) Find, showing all necessary working, the value of the product moment correlation coefficient for this sample.
(ii) Using a \(1\%\) significance level, test whether there is positive correlation between land area and population of cities.
The land areas and populations for another randomly chosen sample of cities, this time of size \(n\), give a product moment correlation coefficient of \(0.651\). Using a test at the \(1\%\) significance level, there is evidence of non-zero correlation between the variables.
(iii) Find the least possible value of \(n\), justifying your answer.
9231 P21 - Jun 2018 - Q11O - 12 marks
Question 11 OR alternative.
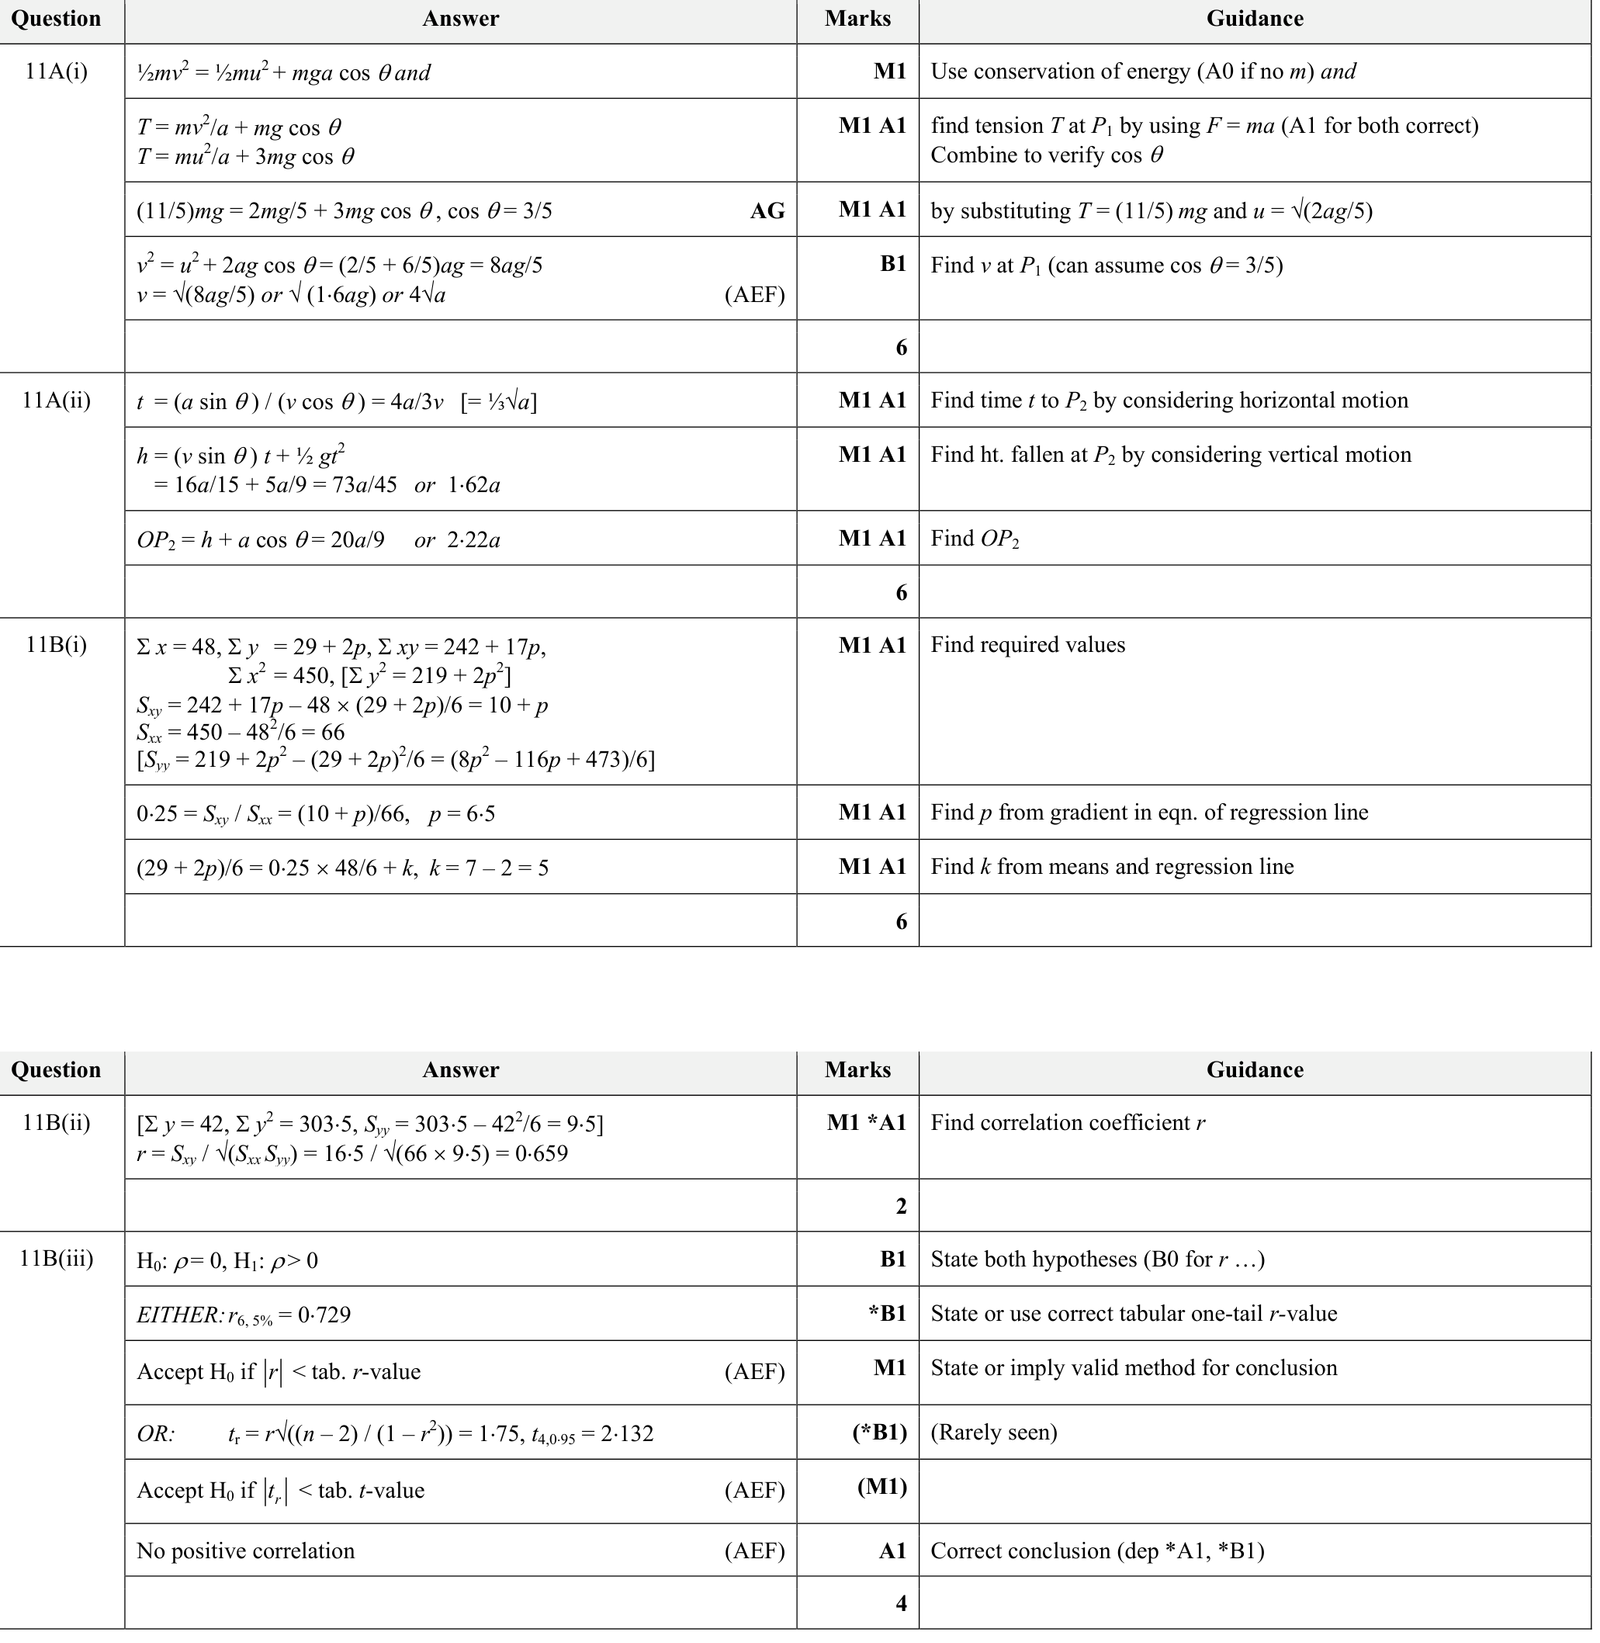
The regression line of \(y\) on \(x\), obtained from a random sample of 6 pairs of values of \(x\) and \(y\), has equation
\[ y=0.25x+k, \]
where \(k\) is a constant. The values from the sample are shown in the following table.
| \(x\) | 4 | 5 | 7 | 8 | 10 | 14 |
|---|---|---|---|---|---|---|
| \(y\) | 5 | 8 | \(p\) | 7 | \(p\) | 9 |
(i) Find the value of \(p\) and the value of \(k\).
(ii) Find the product moment correlation coefficient for the data.
(iii) Test, at the \(5\%\) significance level, whether there is evidence of positive correlation between the variables.
9231 P23 - Jun 2018 - Q6 - 6 marks
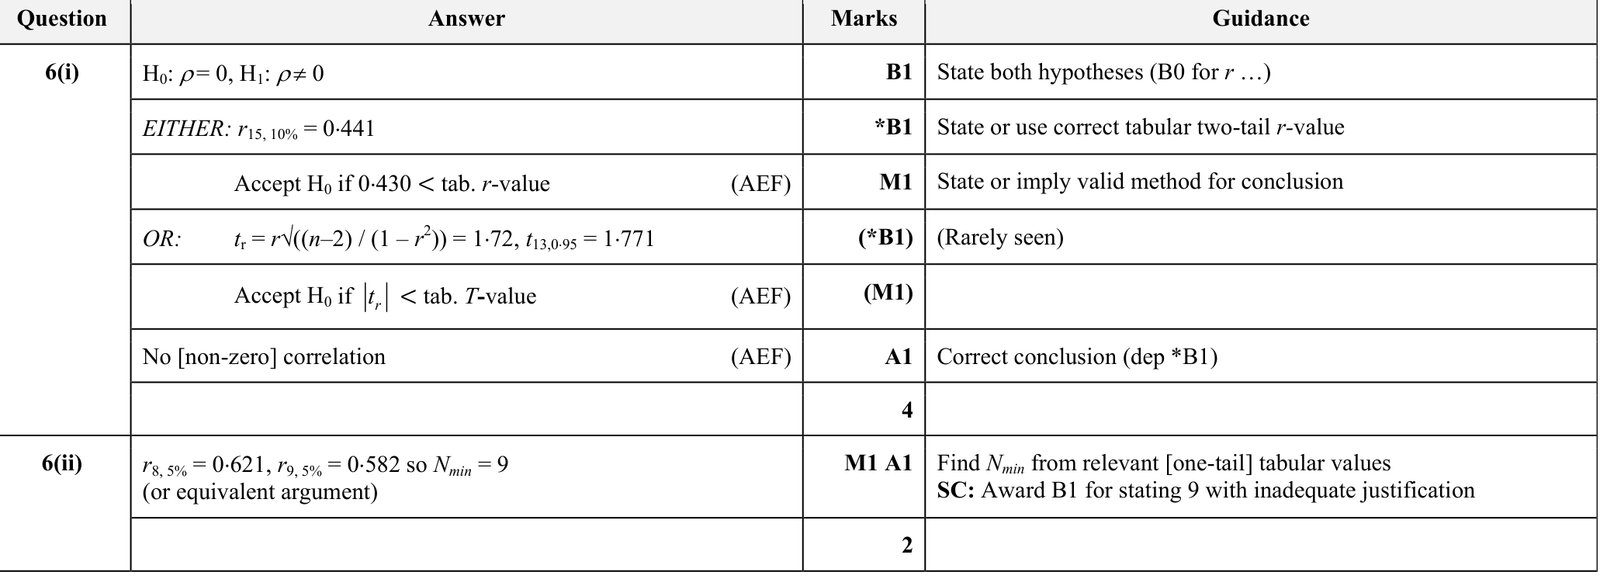
A random sample of 15 observations of pairs of values of two variables gives a product moment correlation coefficient of 0.430 .
(i) Test at the \(10 \%\) significance level whether there is evidence of non-zero correlation between the variables.
A second random sample of \(N\) observations gives a product moment correlation coefficient of 0.615 . Using a \(5 \%\) significance level, there is evidence of positive correlation between the variables.
(ii) Find the least possible value of \(N\), justifying your answer.
9231 P23 - Jun 2018 - Q8 - 9 marks
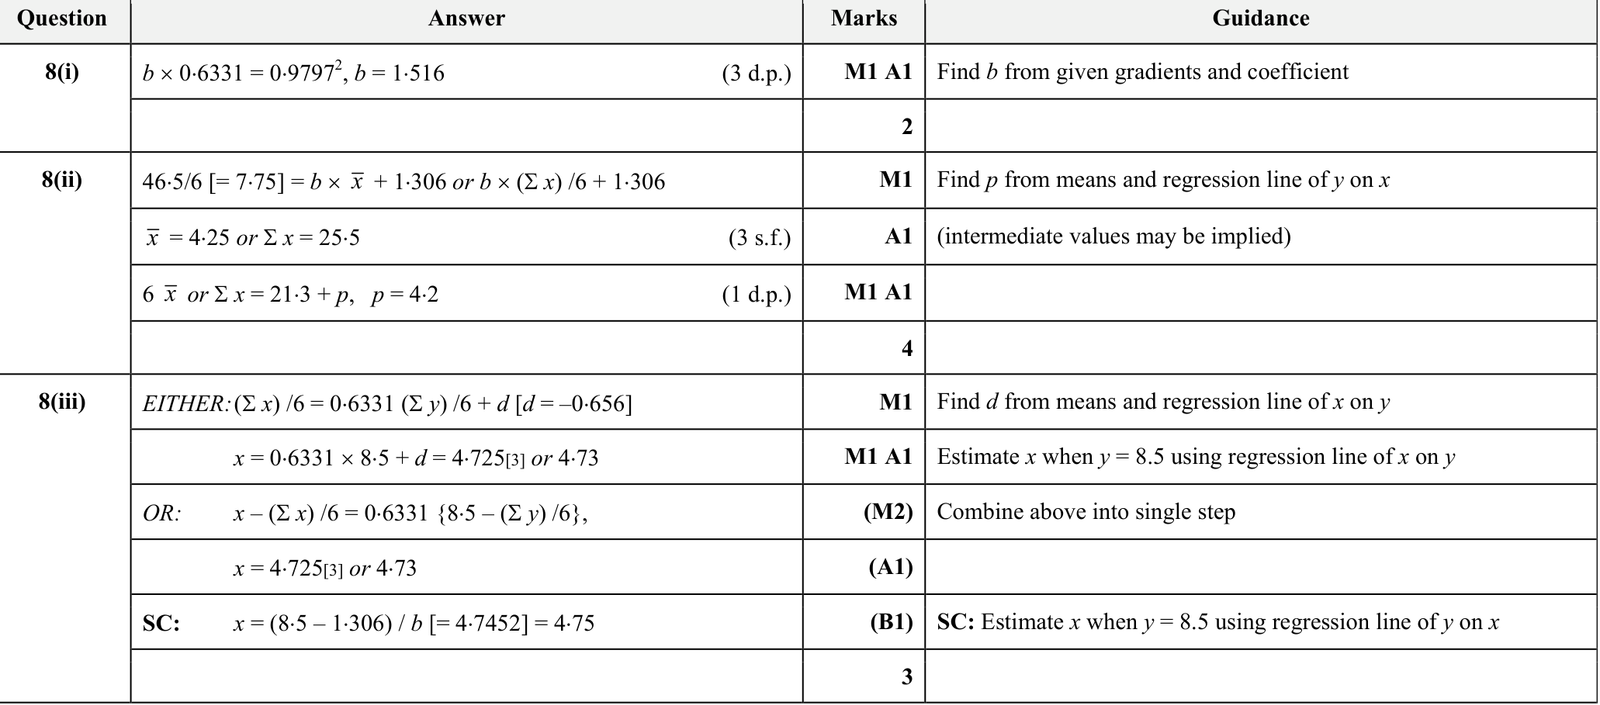
For a random sample of 6 observations of pairs of values \((x,y)\), the equation of the regression line of \(y\) on \(x\) is \(y=bx+1.306\), where \(b\) is a constant. The corresponding equation of the regression line of \(x\) on \(y\) is \(x=0.6331y+d\), where \(d\) is a constant. The values of \(x\) from the sample are
| 2.3 | 2.8 | 3.7 | \(p\) | 6.1 | 6.4 |
and the sum of the values of \(y\) is \(46.5\). The product moment correlation coefficient is \(0.9797\).
(i) Find the value of \(b\), correct to 3 decimal places.
(ii) Find the value of \(p\).
(iii) Use the equation of the regression line of \(x\) on \(y\) to estimate the value of \(x\) when \(y=8.5\).
9231 P41 - Nov 2020 - Q4 - 8 marks
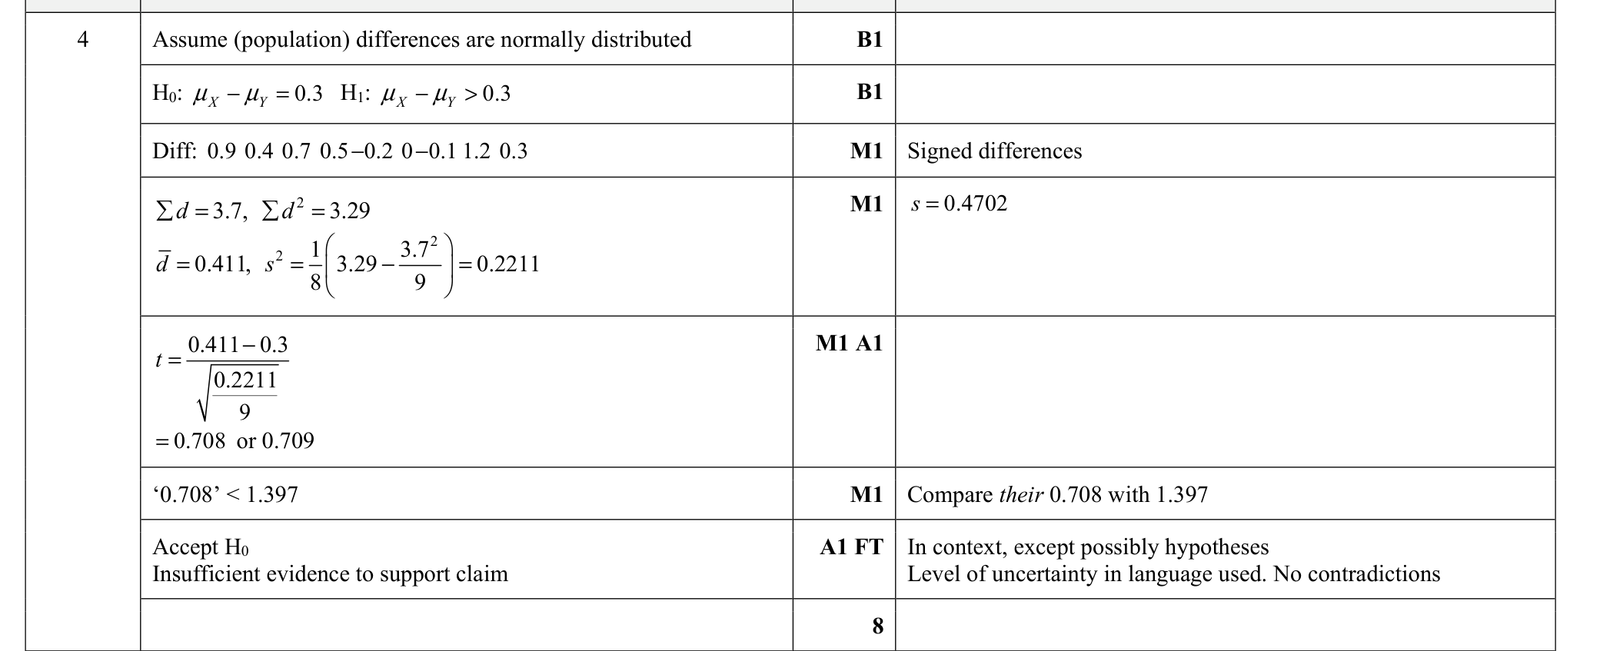
Members of the Sprints athletics club have been taking part in an intense training scheme, aimed at reducing their times taken to run 400 m . For a random sample of 9 athletes from the club, the times taken, in seconds, before and after the training scheme are given in the following table.
Athlete | \(A\) | \(B\) | \(C\) | \(D\) | \(E\) | \(F\) | \(G\) | \(H\) | \(I\) |
|---|---|---|---|---|---|---|---|---|---|
Time before | 48.8 | 48.2 | 50.3 | 49.6 | 49.4 | 48.9 | 47.6 | 50.3 | 48.4 |
Time after | 47.9 | 47.8 | 49.6 | 49.1 | 49.6 | 48.9 | 47.7 | 49.1 | 48.1 |
The organiser of the training scheme claims that on average an athlete's time will be reduced by at least 0.3 seconds.
Test at the 10\% significance level whether the organiser's claim is justified, stating any assumption that you make.
9231 P42 - Nov 2020 - Q1 - 5 marks
The heights of the members of a large sports club are normally distributed. A random sample of 11 members of the club is chosen and their heights, \(x \mathrm{~cm}\), are measured. The results are summarised as follows, where \(\bar{x}\) denotes the sample mean of \(x\).
\(\bar{x}=176.2 \quad \sum(x-\bar{x})^{2}=313.1\)
Test, at the \(5 \%\) significance level, the null hypothesis that the population mean height for members of this club is equal to 172.5 cm against the alternative hypothesis that the mean differs from 172.5 cm .

9231 P41 - Nov 2024 - Q6 - 8 marks
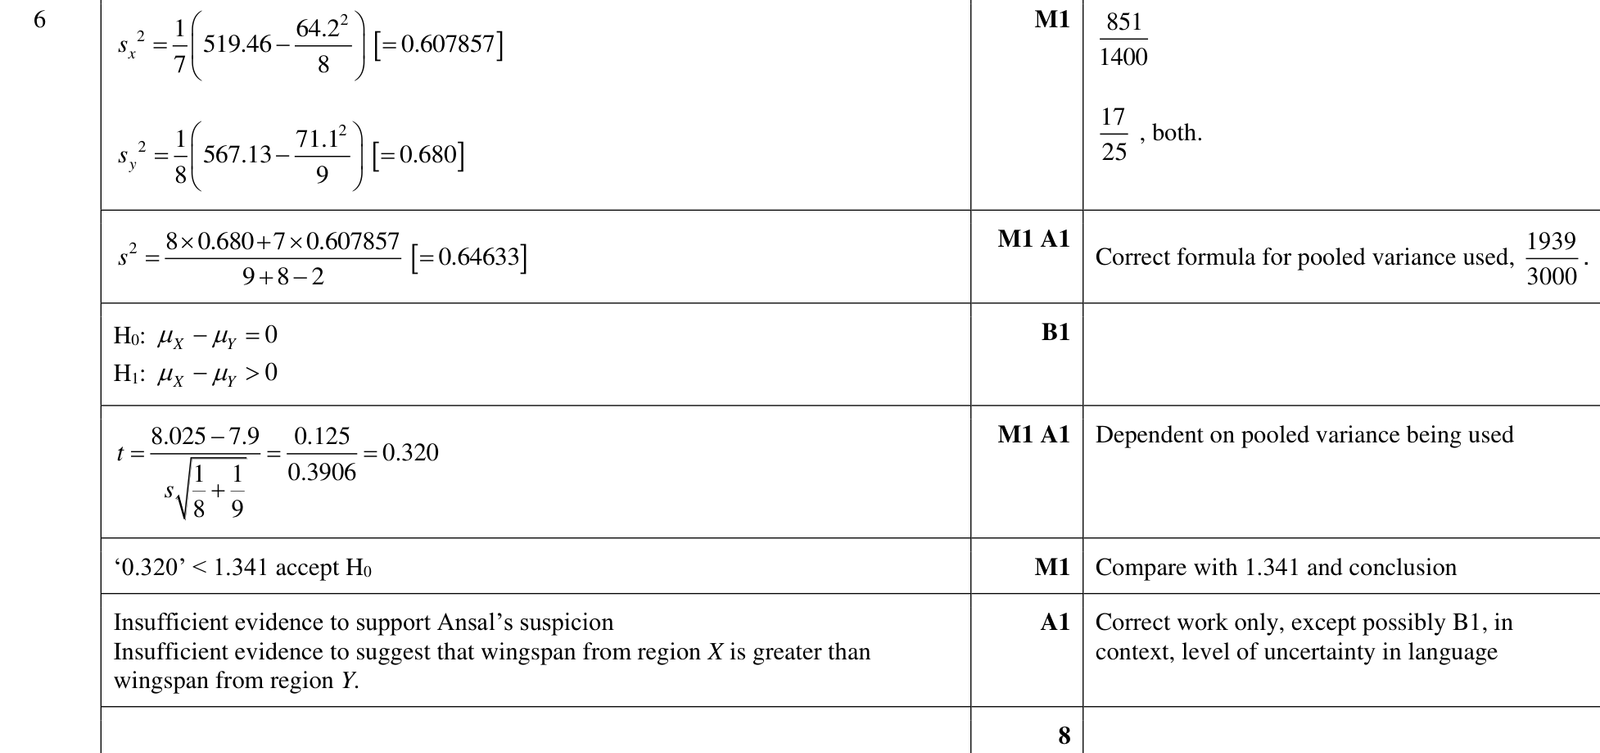
Ansal is investigating the wingspans of Monarch butterflies in two different regions, \(X\) and \(Y\). He takes a random sample of 8 Monarch butterflies from region \(X\) and records their wingspans, \(x \mathrm{~cm}\). His results are as follows.
| 8.2 | 7.0 | 7.3 | 8.8 | 7.8 | 8.5 | 9.2 | 7.4 |
Ansal also takes a random sample of 9 Monarch butterflies from region \(Y\) and records their wingspans, \(y \mathrm{~cm}\). His results are summarised as follows.
\(\sum y=71.10 \quad \sum y^{2}=567.13\)
Ansal suspects that the mean wingspan of Monarch butterflies from region \(X\) is greater than the mean wingspan of Monarch butterflies from region \(Y\). It is known that the wingspans of Monarch butterflies in regions \(X\) and \(Y\) are normally distributed with equal population variances.
Test, at the 10\% significance level, whether Ansal's suspicion is supported by the data.
9231 P42 - Nov 2024 - Q5 - 9 marks
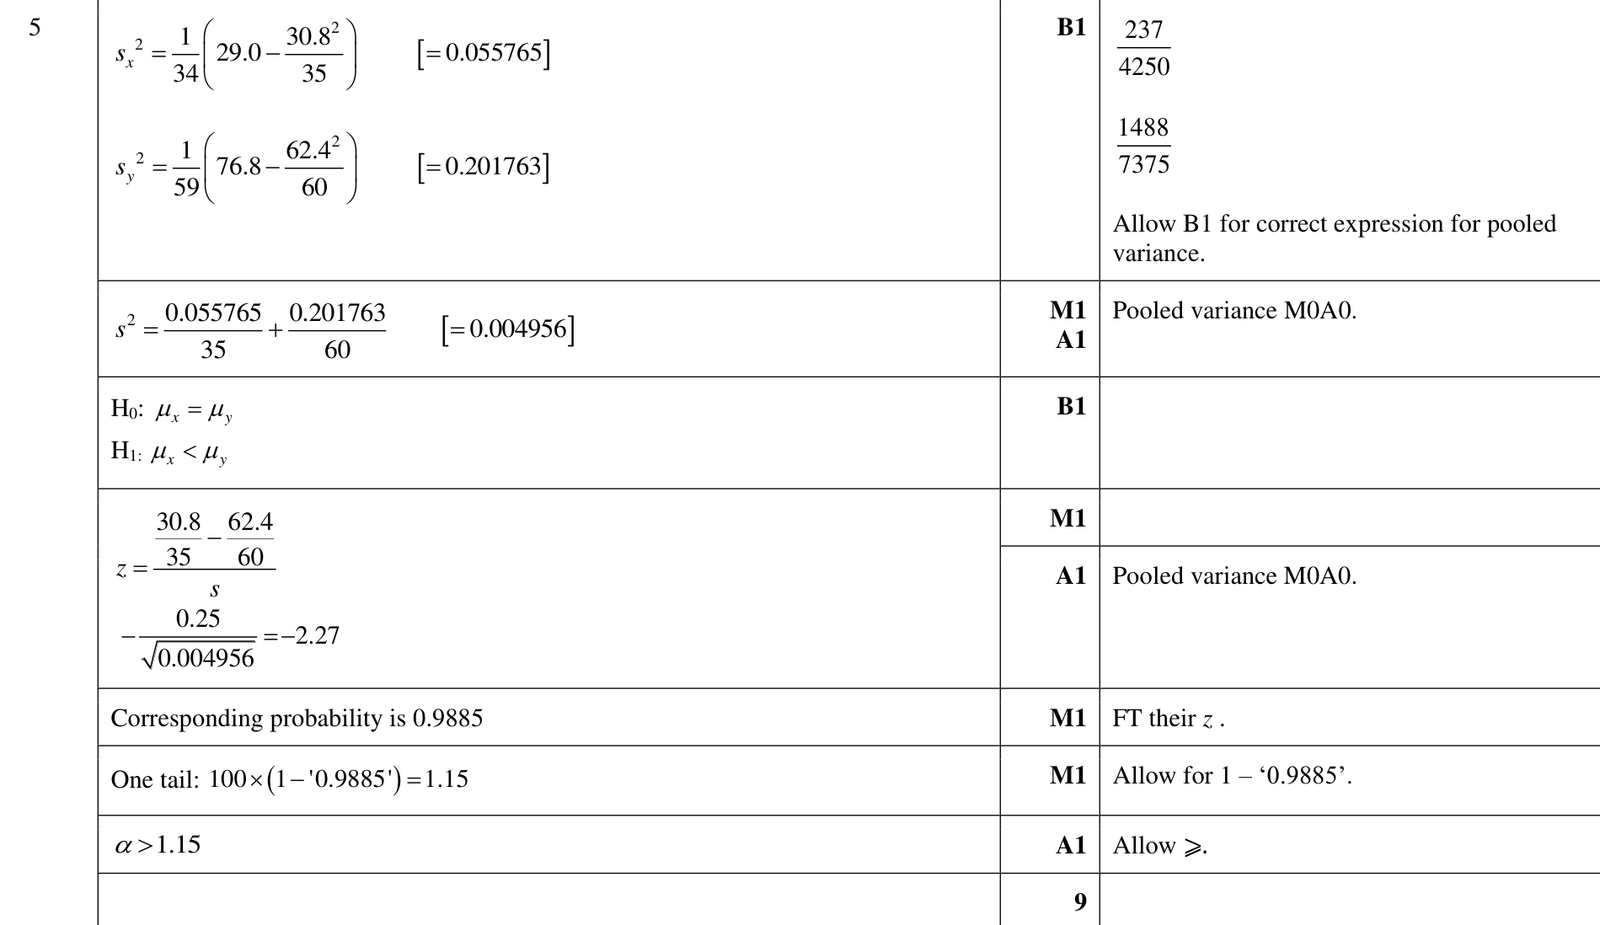
Dev owns a small company which produces bottles of juice. He uses two machines, \(X\) and \(Y\), to fill empty bottles with juice. Dev is investigating the volumes of juice in the bottles. He chooses a random sample of 35 bottles filled by machine \(X\) and a random sample of 60 bottles filled by machine \(Y\). The volumes of juice, \(x\) and \(y\) respectively, measured in suitable units, are summarised by
\(\sum x=30.8, \quad \sum x^{2}=29.0, \quad \sum y=62.4, \quad \sum y^{2}=76.8 .\)
Dev claims that the mean volume of juice in bottles filled by machine \(Y\) is greater than the mean volume of juice in bottles filled by machine \(X\). A test at the \(\alpha \%\) significance level suggests that there is sufficient evidence to support Dev's claim.
Find the set of possible values of \(\alpha\).
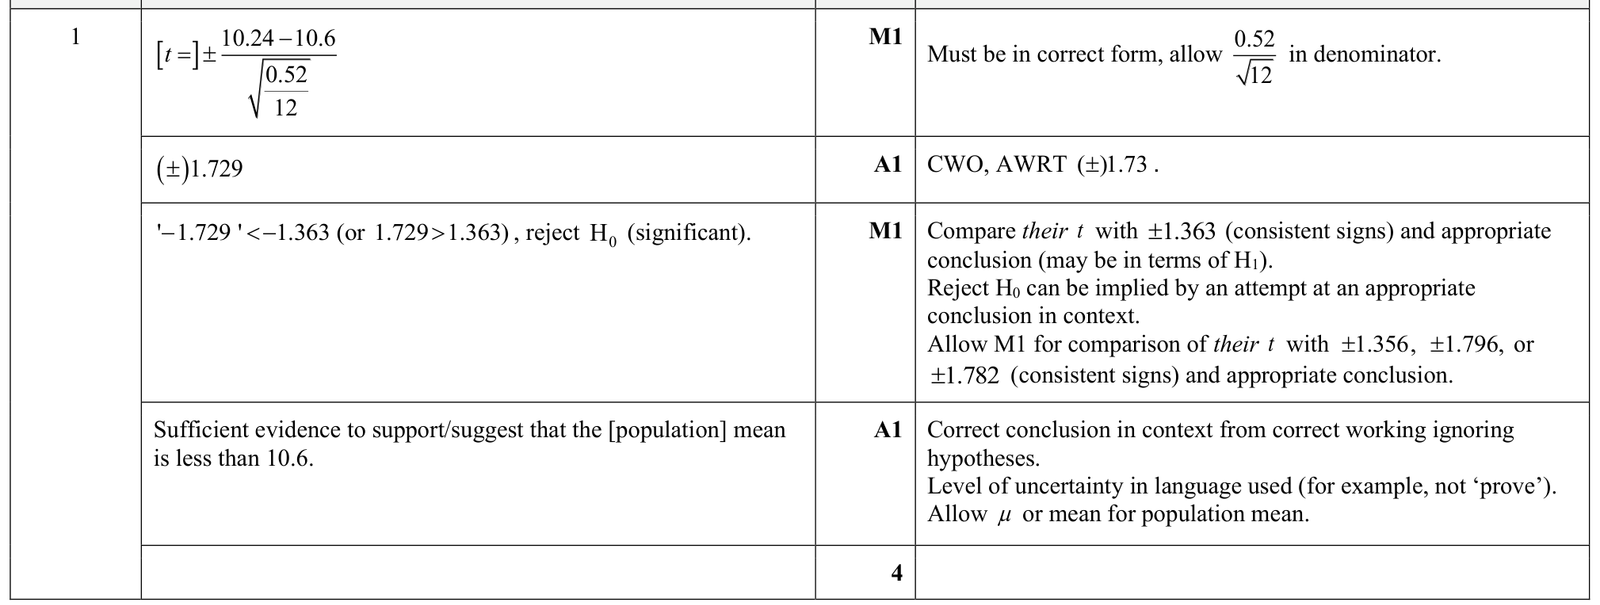
9231 P44 - Jun 2025 - Q1 - 4 marks
A random sample of 12 observations of a normal random variable is taken. The results give unbiased estimates for the population mean and variance as 10.24 and 0.52 respectively.
Test, at the \(10 \%\) significance level, the null hypothesis that the population mean is 10.6 against the alternative hypothesis that the population mean is less than 10.6.
9231 P44 - Jun 2025 - Q3 - 7 marks
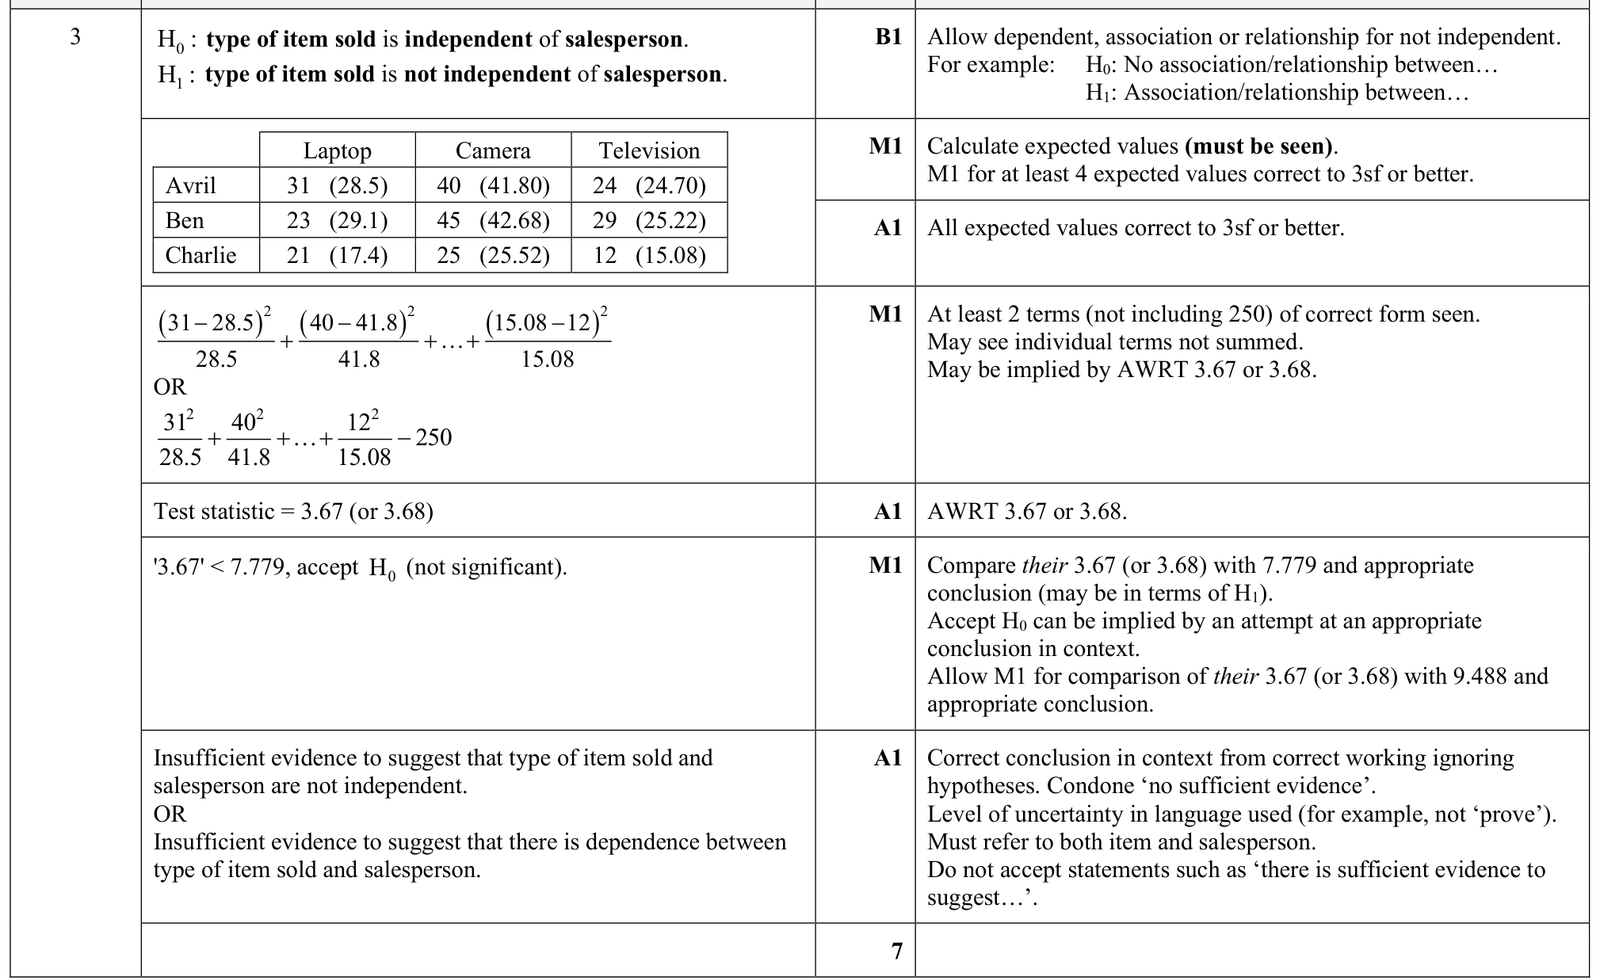
A shop selling electrical goods has a team of three salespeople: Avril, Ben and Charlie. The manager wishes to investigate whether the salespeople are equally successful at selling particular types of items. The following table gives a record of a random sample of 250 sales of laptops, cameras and televisions, with the number sold by each of the three salespeople.
| Laptop | Camera | Television | |
|---|---|---|---|
| Avril | 31 | 40 | 24 |
| Ben | 23 | 45 | 29 |
| Charlie | 21 | 25 | 12 |
Test, at the \(10 \%\) significance level, whether there is independence between the type of item sold and the salesperson.