9231 P23 - Jun 2019 - Q8 - 8 marks
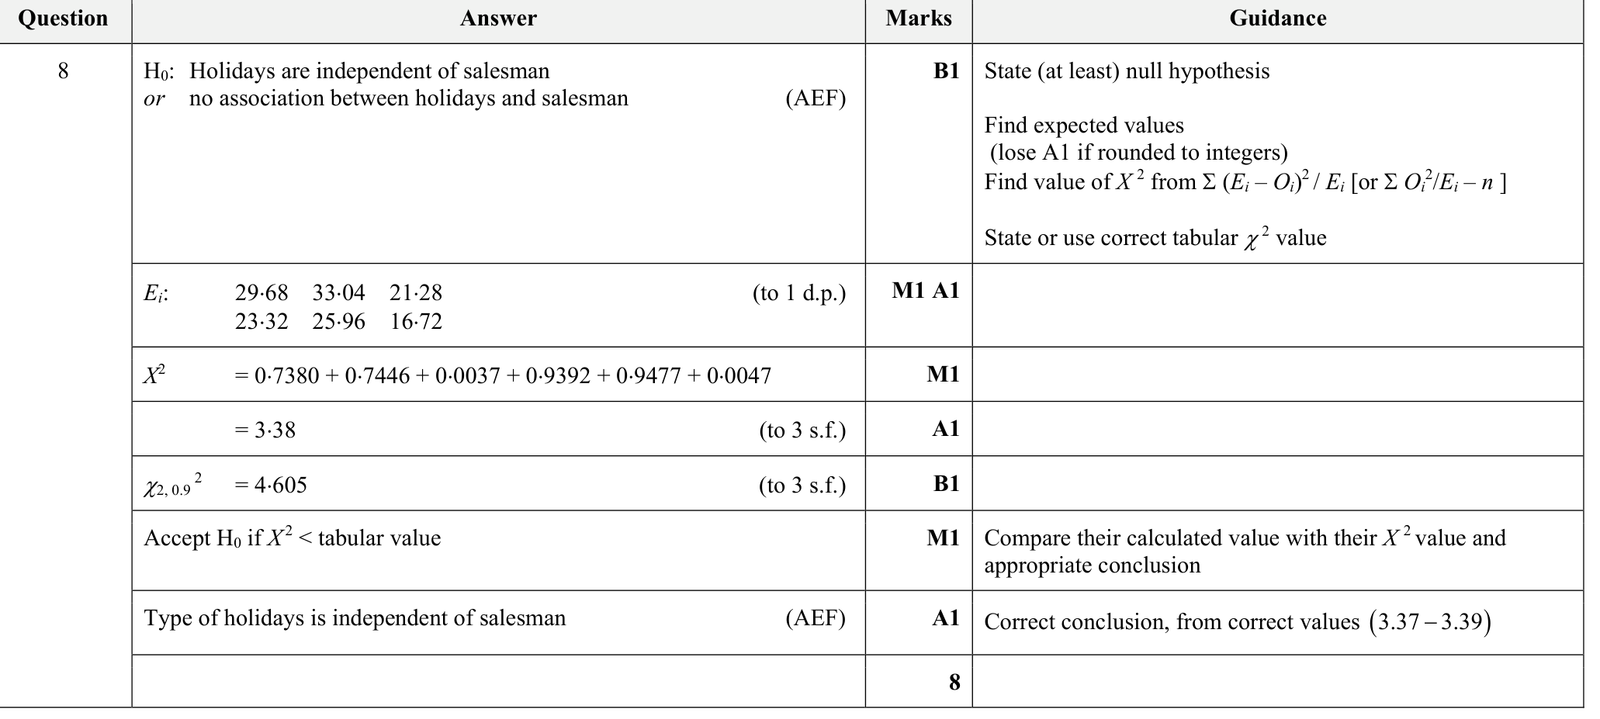
Two salesmen, \(A\) and \(B\), work at a company that arranges different types of holidays: self-catering, hotel and cruise. The table shows, for a random sample of 150 holidays, the number of each type arranged by each salesman.
| Type of holiday | ||||
|---|---|---|---|---|
| Self-catering | Hotel | Cruise | ||
| Salesman | \(A\) | 25 | 38 | 21 |
| \(B\) | 28 | 21 | 17 | |
Test at the \(10\%\) significance level whether the type of holiday arranged is independent of the salesman.
9231 P21 - Nov 2017 - Q8 - 8 marks
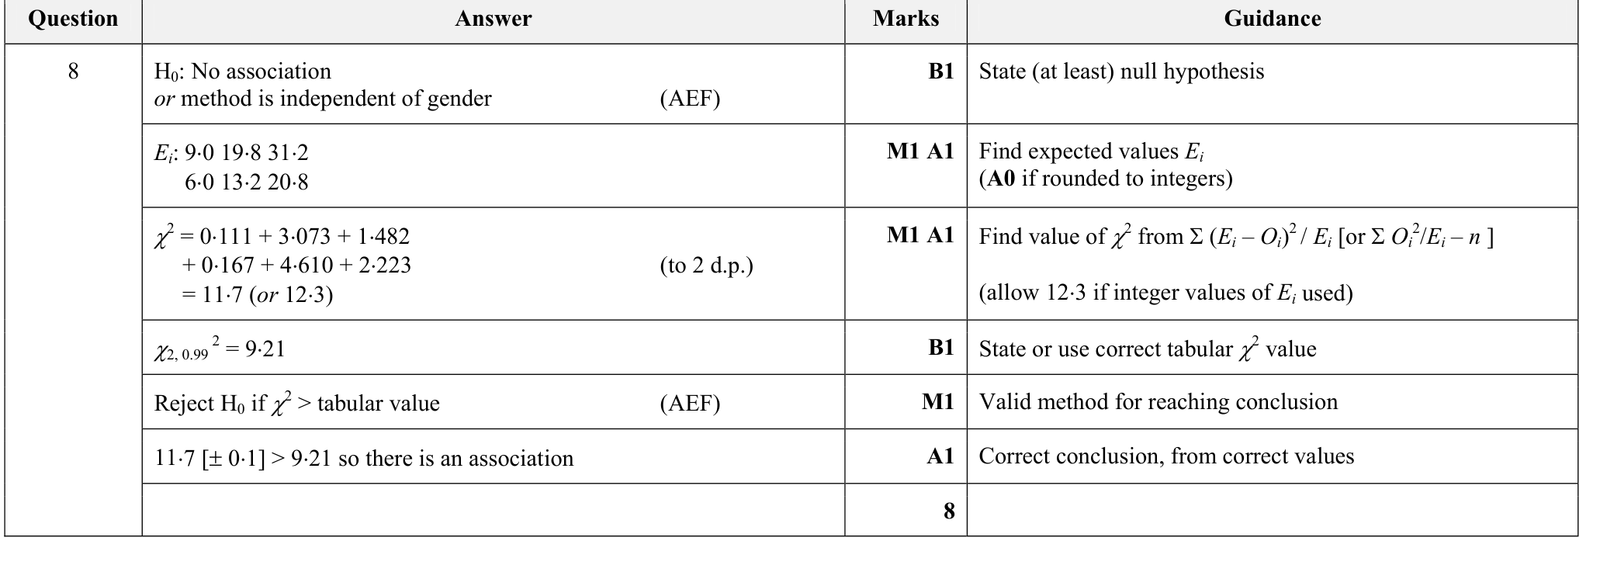
Members of a Statistics club are voting to elect a new president of the club. Members must choose to vote either by post or by text or by email. The method of voting chosen by a random sample of 60 male members and 40 female members is given in the following table.
| Method of voting | ||||
|---|---|---|---|---|
| Post | Text | |||
| Gender | Male | 10 | 12 | 38 |
| Female | 5 | 21 | 14 | |
Test, at the \(1\%\) significance level, whether there is an association between method of voting and gender.
9231 P21 - Jun 2018 - Q8 - 8 marks
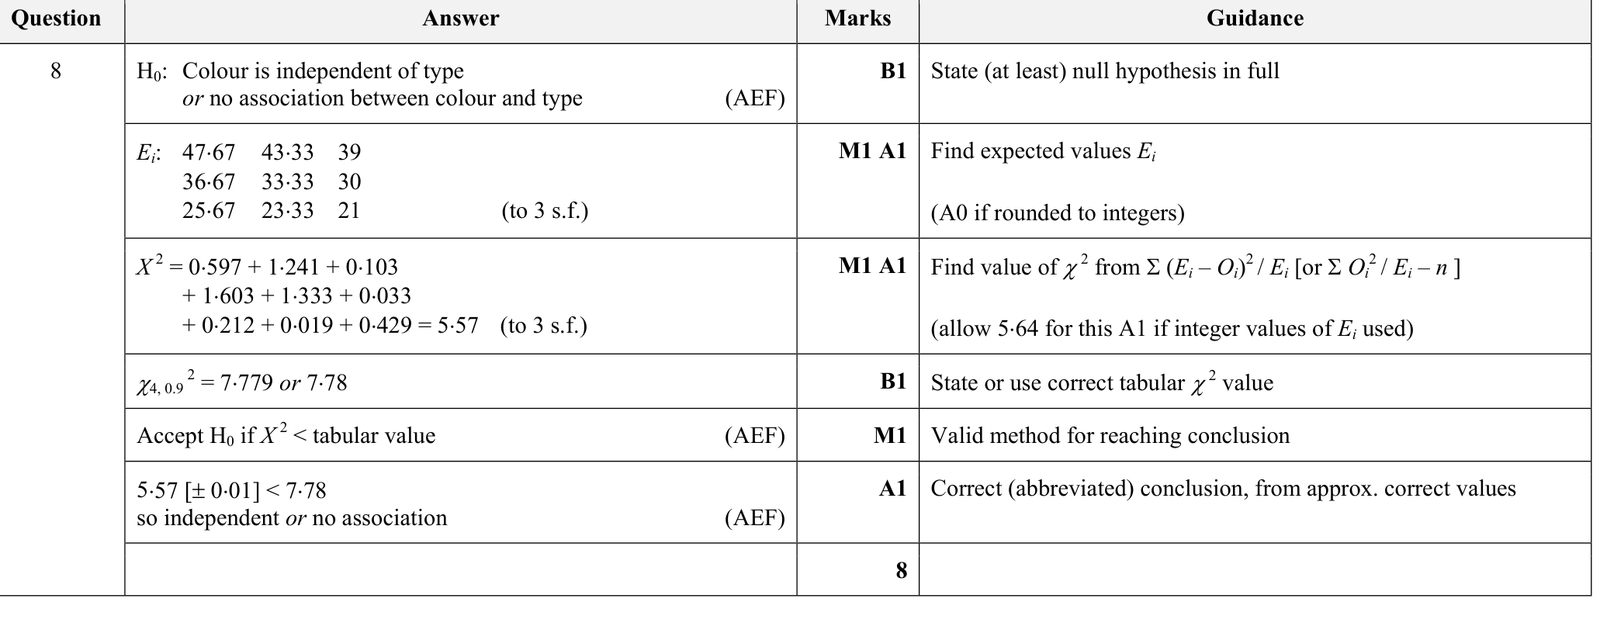
A manufacturer produces three types of car: hatchbacks, saloons and estates. Each type of car is available in one of three colours: silver, blue and red. The manufacturer wants to know whether the popularity of the colour of the car is related to the type of car. A random sample of 300 cars chosen by customers gives the information summarised in the following table.
| Colour of car | ||||
|---|---|---|---|---|
| Silver | Blue | Red | ||
| Type of car | Hatchback | 53 | 36 | 41 |
| Saloon | 29 | 40 | 31 | |
| Estate | 28 | 24 | 18 | |
Test at the \(10\%\) significance level whether the colour of car chosen by customers is independent of the type of car.
9231 P44 - Nov 2025 - Q5 - 7 marks
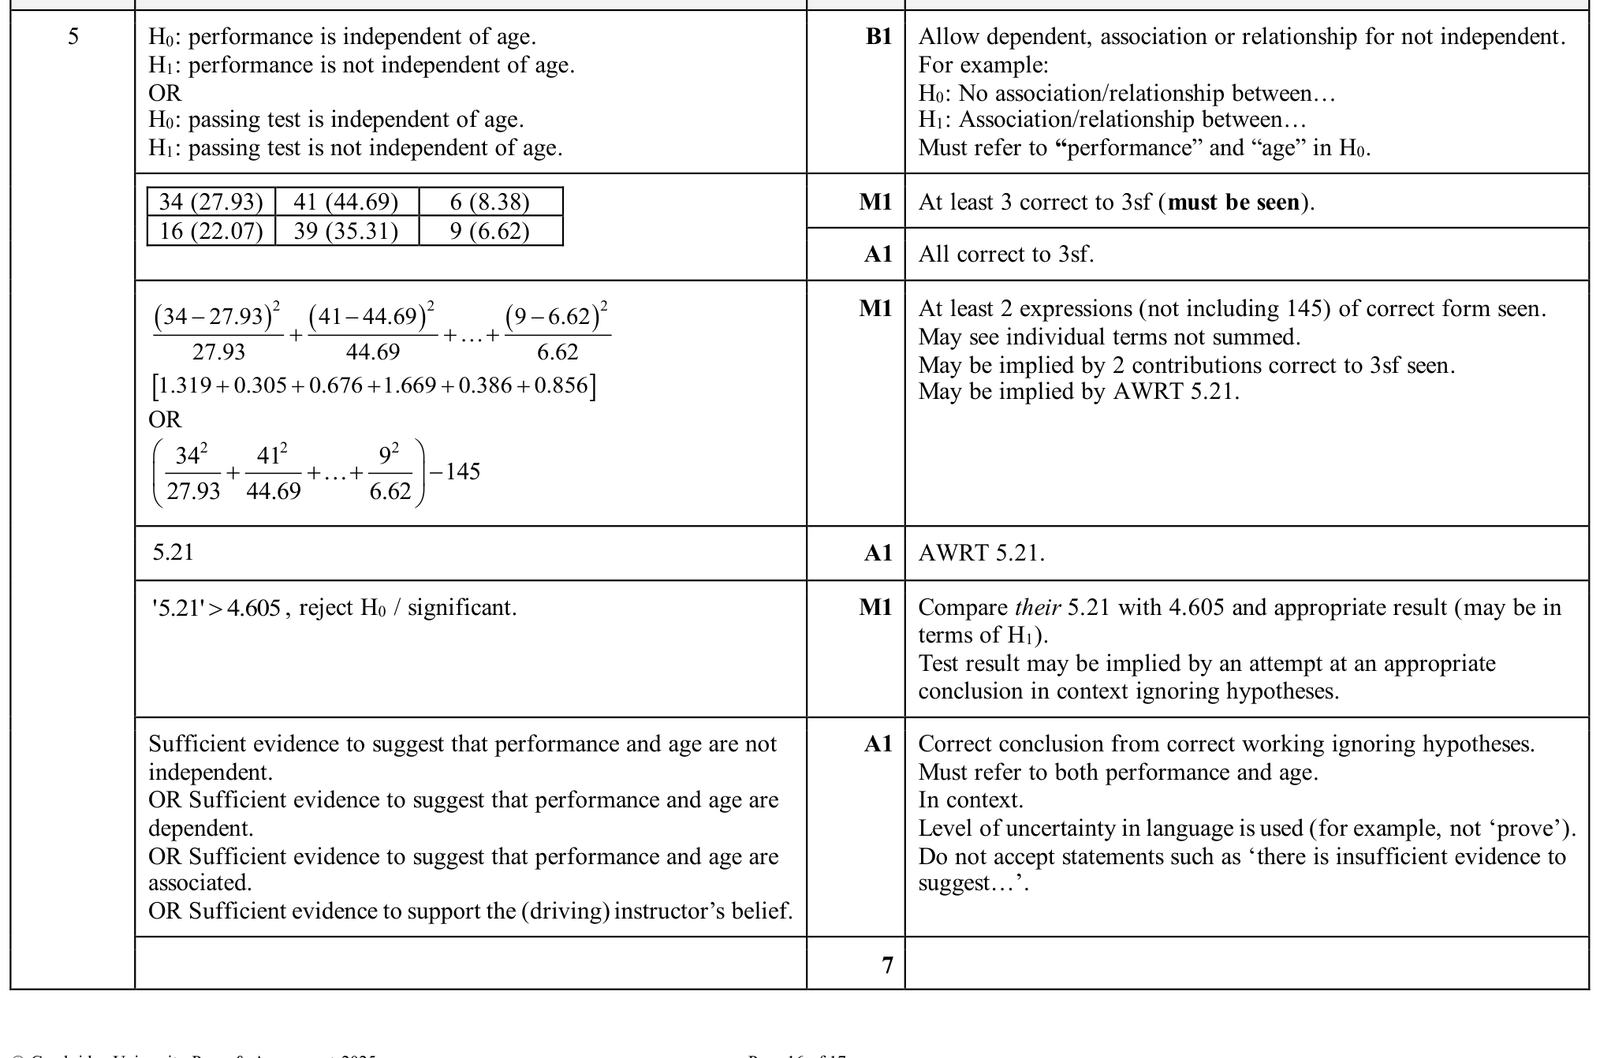
A driving instructor believes that the performance (pass or fail) of students when taking a driving test is associated with their age. The following table summarises the number of students who pass and who fail, and the ages in years of the students taking the test, over a period of three years.
| Age of student | ||||
|---|---|---|---|---|
| under 20 | 20-40 | over 40 | total | |
| pass | 34 | 41 | 6 | 81 |
| fail | 16 | 39 | 9 | 64 |
| total | 50 | 80 | 15 | 145 |
Test, at the 10% significance level, whether performance is independent of age of student.
9231 P41 - Jun 2024 - Q5 - 8 marks
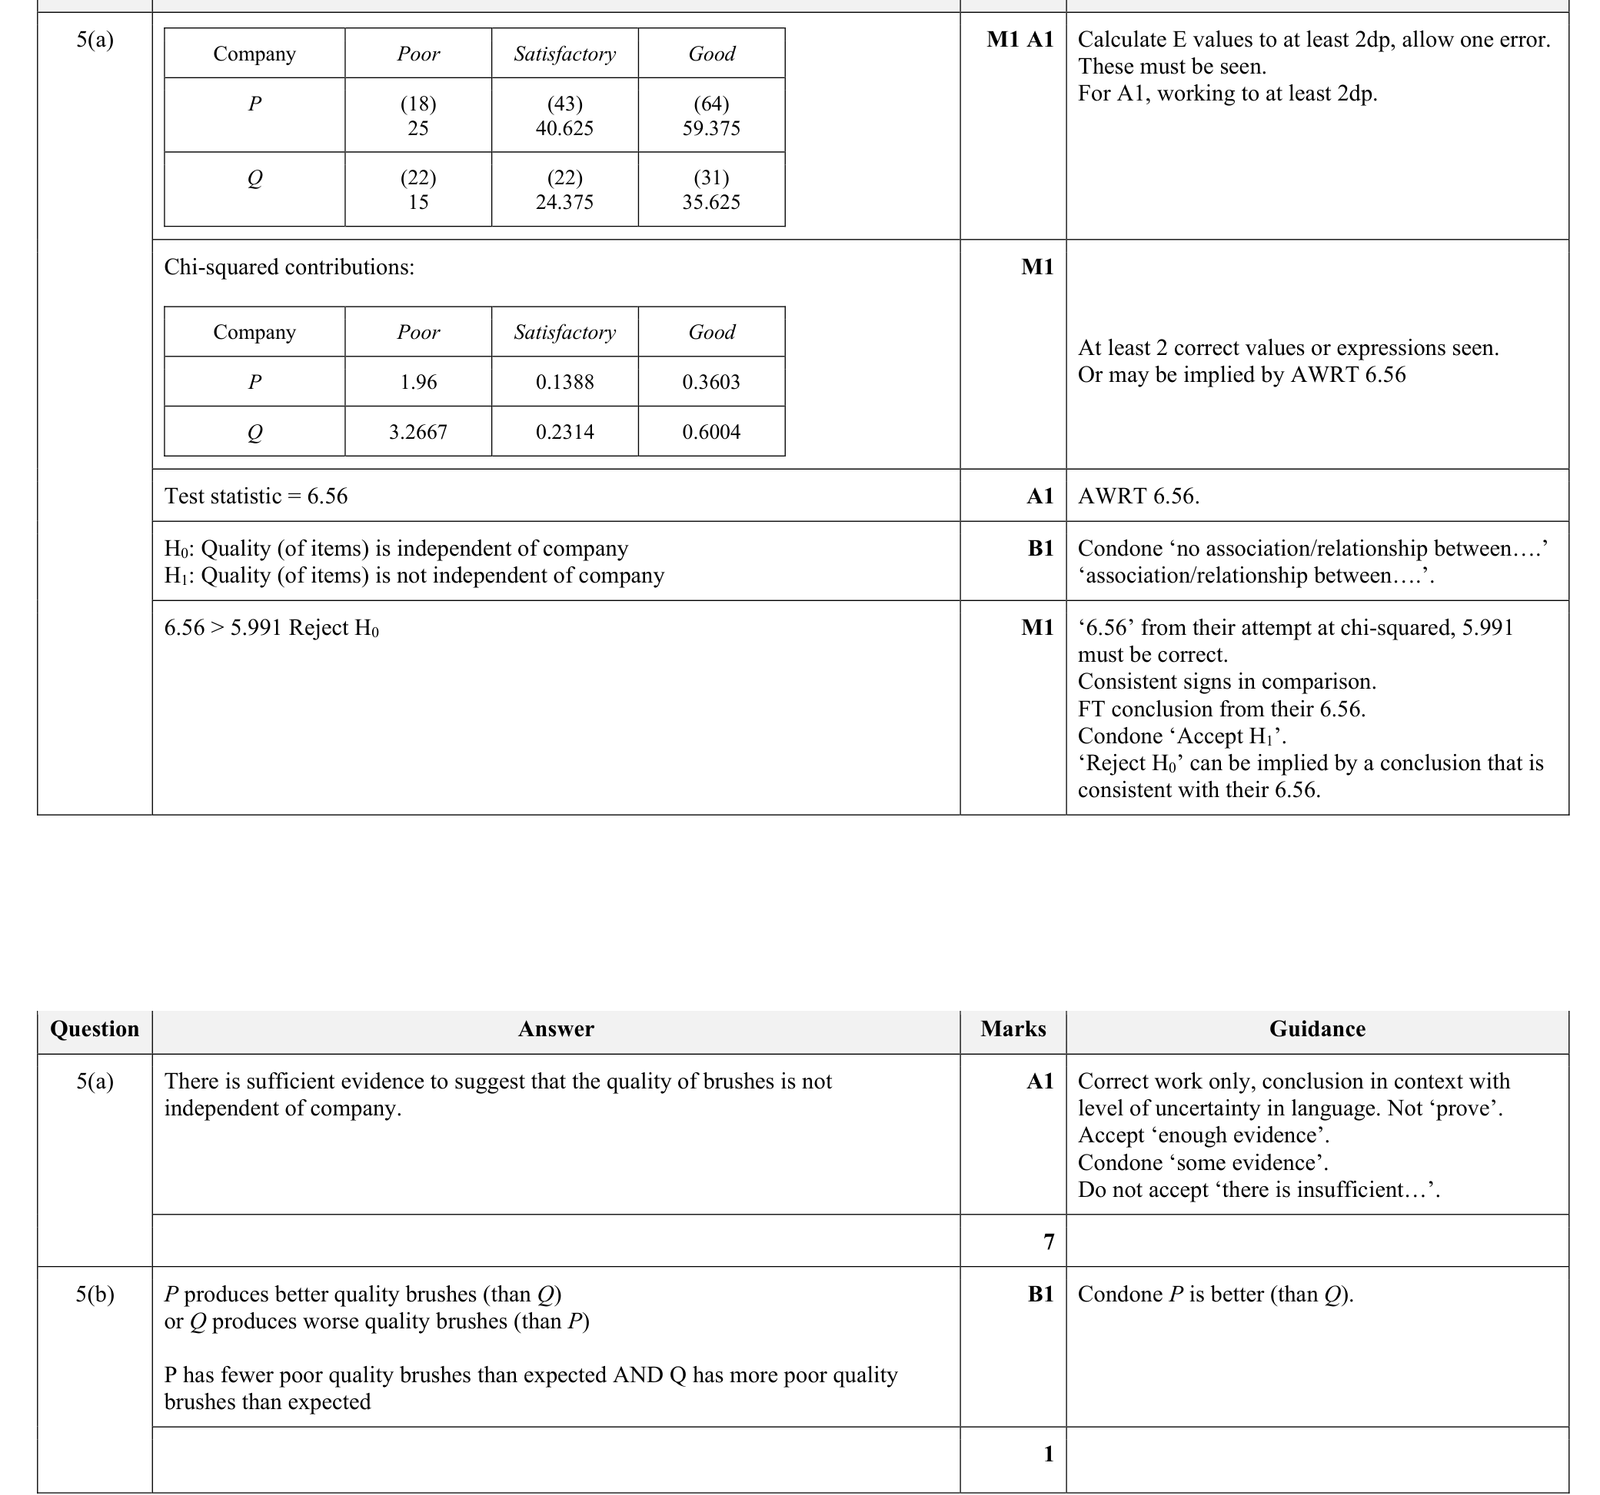
Two companies, \(P\) and \(Q\), produce a certain type of paint brush. An independent examiner rates the quality of the brushes produced as poor, satisfactory or good. He takes a random sample of brushes from each company. The examiner's ratings are summarised in the table.
Company | Poor | Satisfactory | Good |
|---|---|---|---|
\(P\) | 18 | 43 | 64 |
\(Q\) | 22 | 22 | 31 |
(a) Test, at the \(5 \%\) significance level, whether quality of brushes is independent of company.
(b) Compare the quality of the brushes produced by the two companies.
9231 P43 - Jun 2024 - Q3 - 7 marks
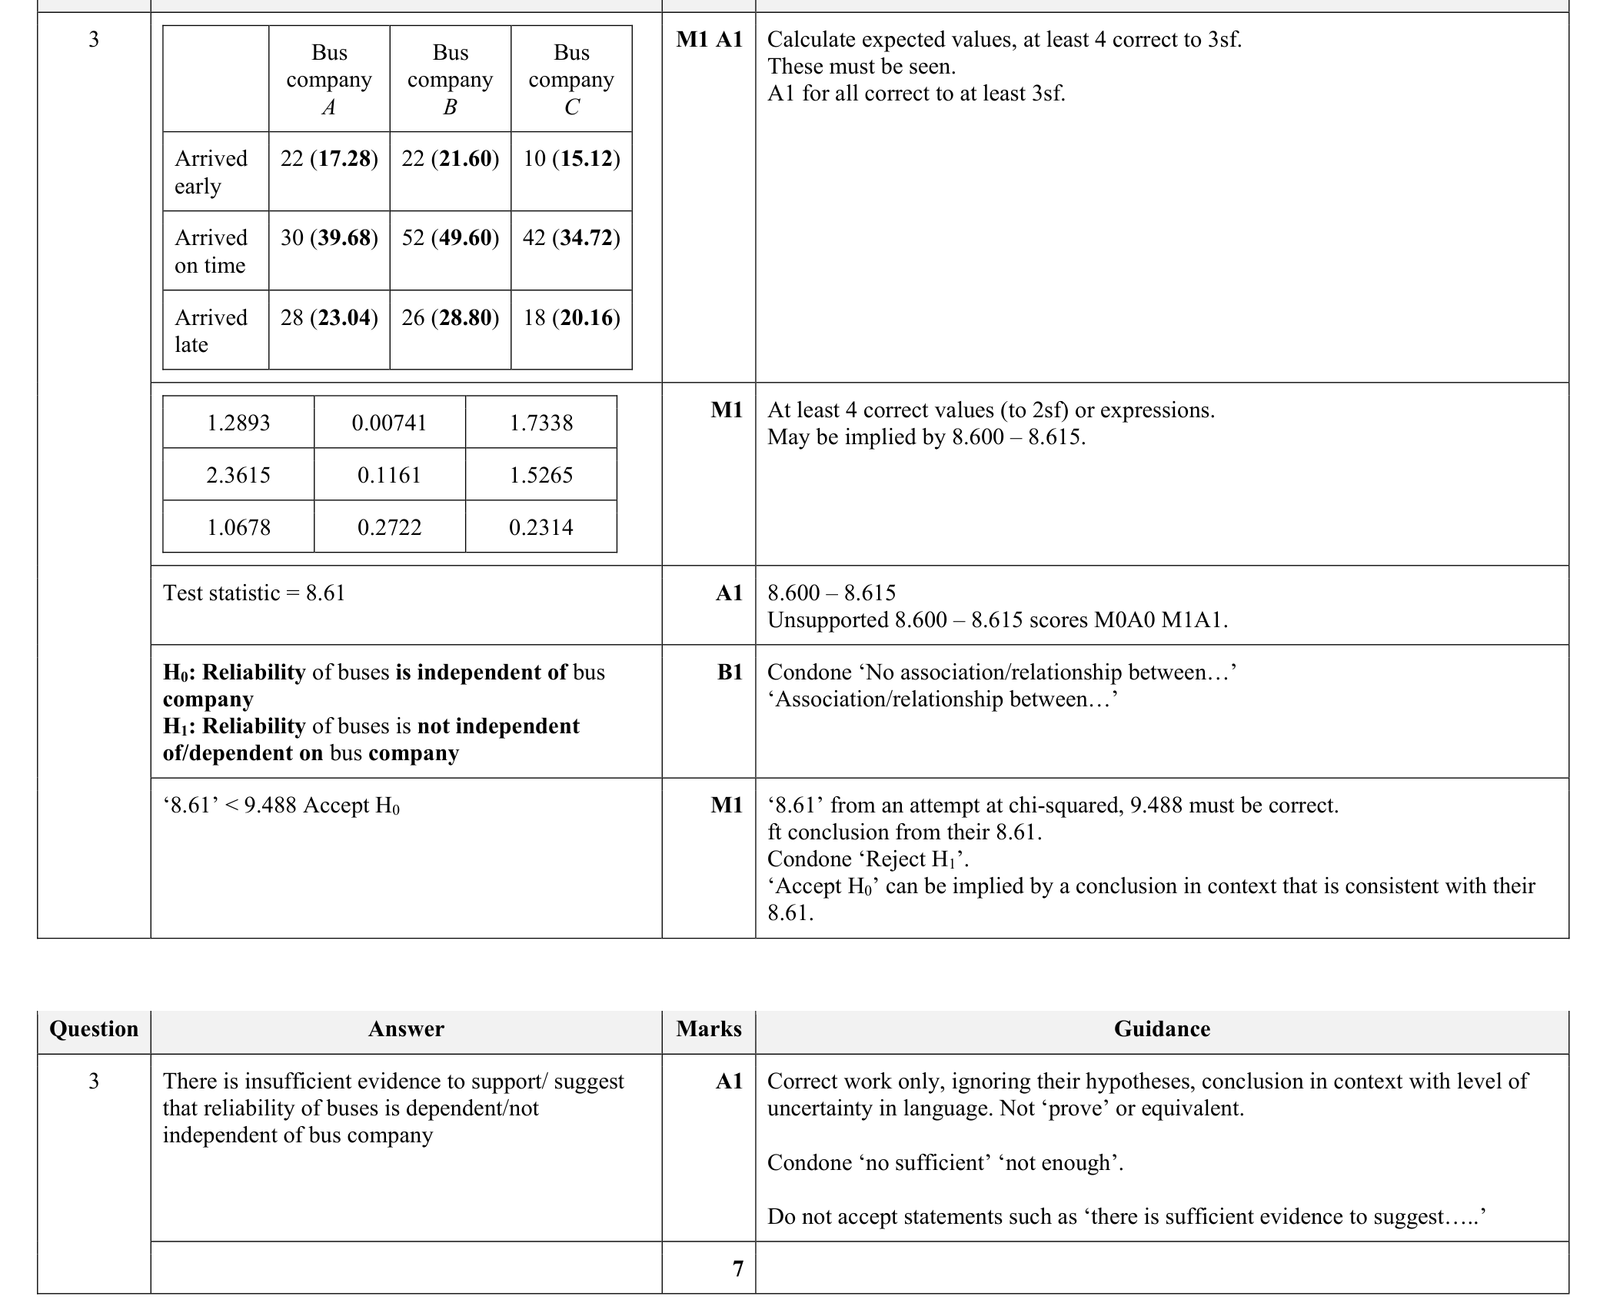
There are three bus companies in a city. The council is investigating whether the buses reliably arrive at their destination on time. The results from random samples of buses from each company are summarised in the following table.
Test, at the \(5 \%\) significance level, whether the reliability of buses is independent of bus company.
9231 P43 - Jun 2023 - Q6 - 10 marks
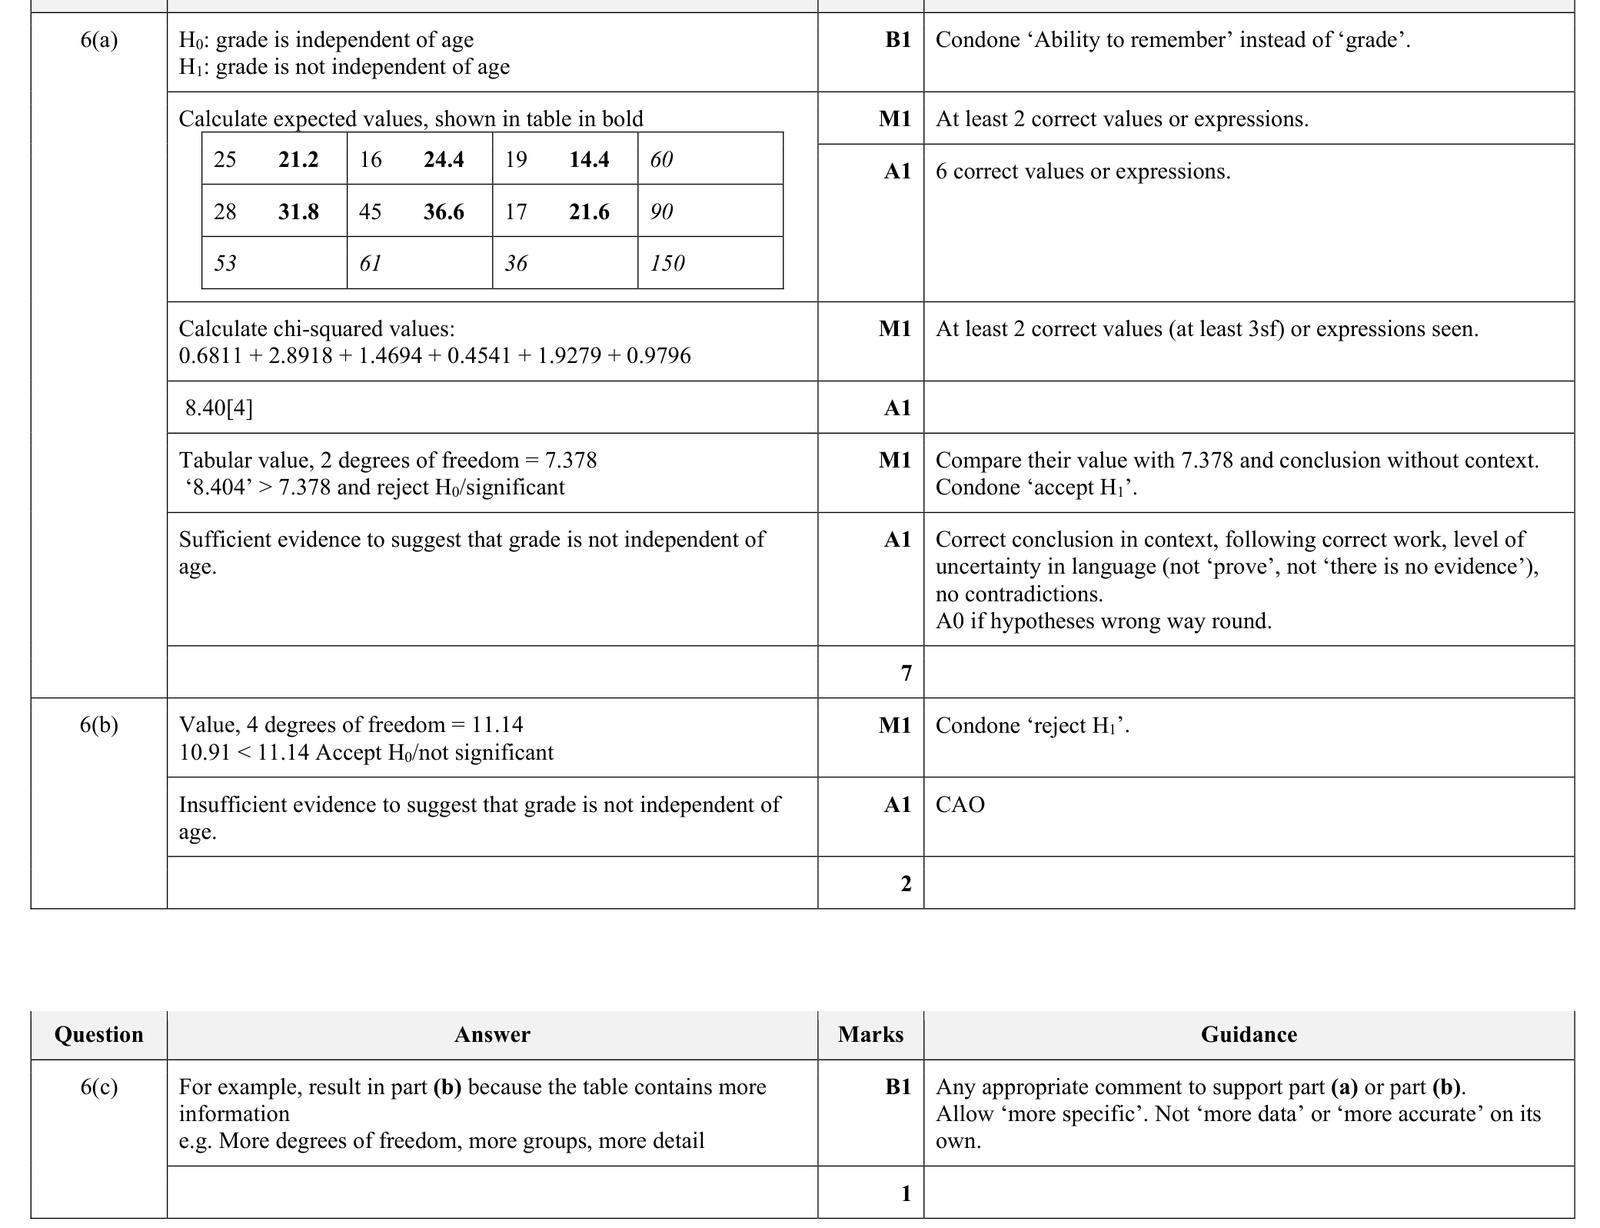
A scientist is investigating whether the ability to remember depends on age. A random sample of 150 students in different age groups is chosen. Each student is shown a set of 20 objects for thirty seconds and then asked to list as many as they can remember. The students are graded \(A\) or \(B\) according to how many objects they remembered correctly: grade \(A\) for 16 or more correct and grade \(B\) for fewer than 16 correct. The results are shown in the table.
\cline { 2 - 4 } | Age of students | ||
|---|---|---|---|
\cline { 2 - 4 } | \(11-12\) years | \(13-14\) years | \(15-16\) years |
Grade \(A\) | 25 | 16 | 19 |
Grade \(B\) | 28 | 45 | 17 |
(a) Carry out a \(\chi^{2}\)-test at the \(2.5 \%\) significance level to test whether grade is independent of age of student.
The scientist decides instead to use three grades: grade \(A\) for 16 or more correct, grade \(B\) for 10 to 15 correct and grade \(C\) for fewer than 10 correct. The results are shown in the following table.
With this second set of data, the test statistic is calculated as 10.91 .
(b) Complete the \(\chi^{2}\)-test at the \(2.5 \%\) significance level for this second set of data.
(c) State, with a reason, whether you would prefer to use the result from part (a) or part (b) to investigate whether the ability to remember depends on age.
9231 P41 - Nov 2023 - Q2 - 7 marks
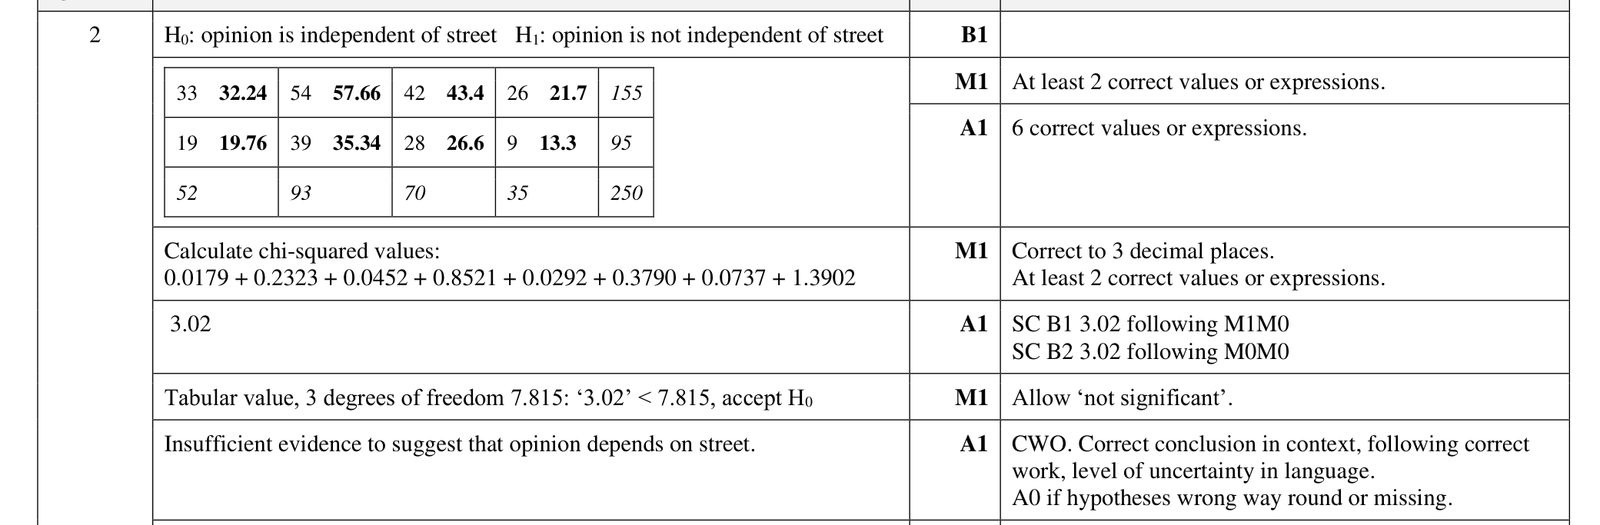
A town council has published its plans for redeveloping the town centre and residents are being asked whether they approve or disapprove. A random sample of 250 responses has been selected from residents in the four main streets in the town: North, East, South and West Streets. The results are shown in the table.
| Opinion | North Street | East Street | South Street | West Street |
|---|---|---|---|---|
| Approve | 33 | 54 | 42 | 26 |
| Disapprove | 19 | 39 | 28 | 9 |
Test, at the \(5\%\) significance level, whether the opinions of the residents are independent of the streets on which they live.
9231 P43 - Jun 2022 - Q2 - 7 marks
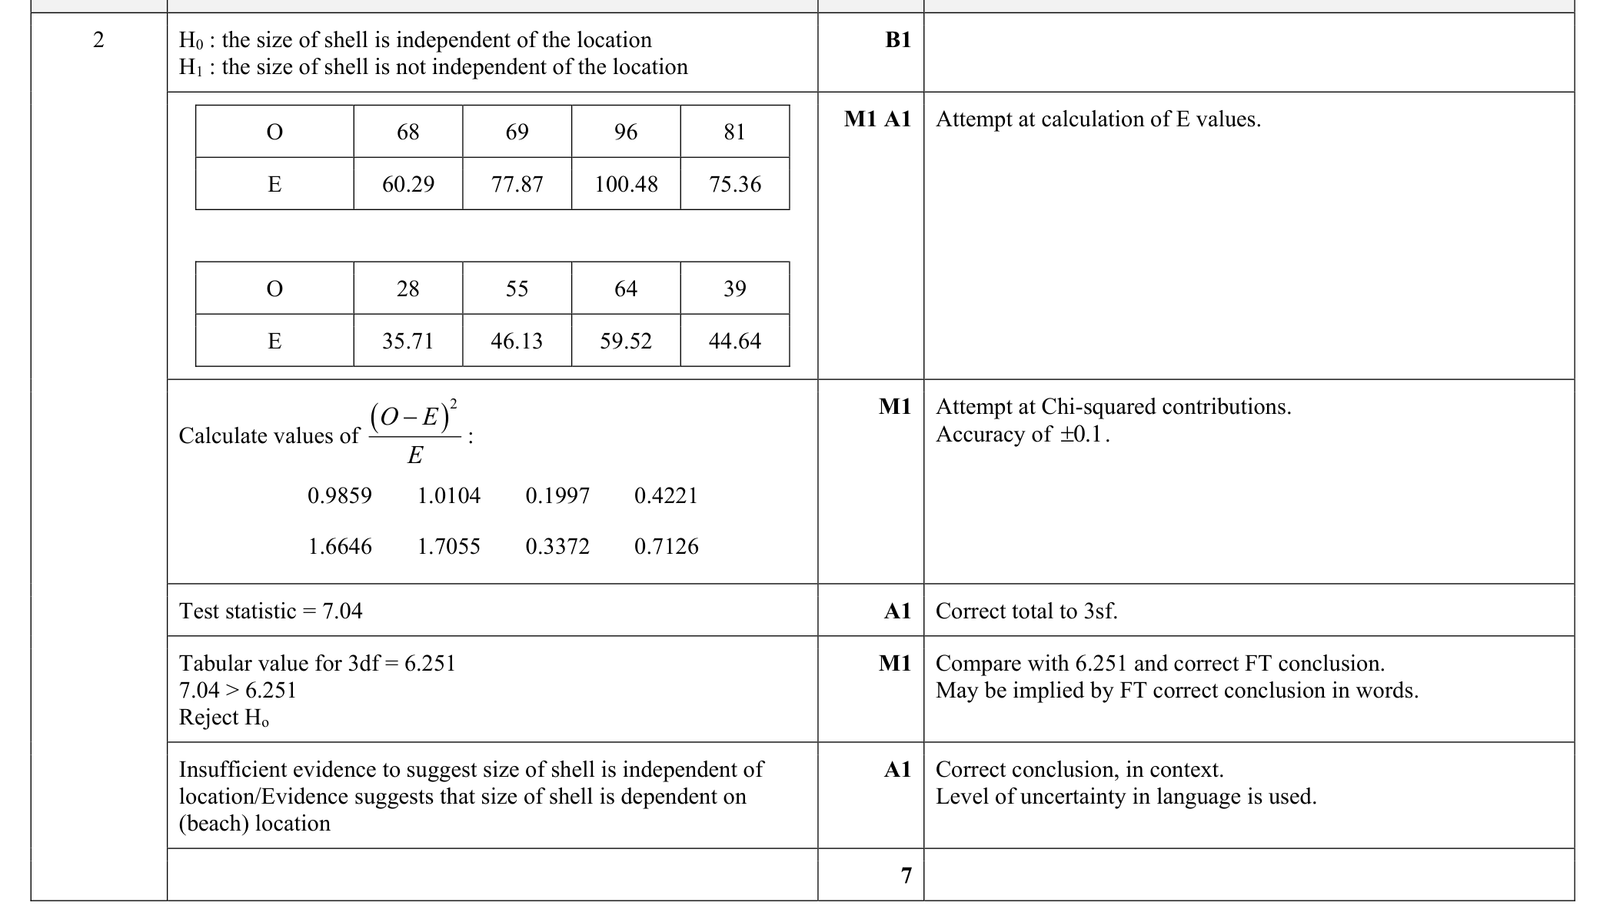
A scientist is investigating the size of shells at various beach locations. She selects four beach locations and takes a random sample of shells from each of these beaches. She classifies each shell as large or small. Her results are summarised in the following table.
| Beach location | ||||||
|---|---|---|---|---|---|---|
| A | B | C | D | Total | ||
| Size of shell | Large | 68 | 69 | 96 | 81 | 314 |
| Small | 28 | 55 | 64 | 39 | 186 | |
| Total | 96 | 124 | 160 | 120 | 500 | |
Test, at the 10% significance level, whether the size of shell is independent of the beach location.
9231 P42 - Nov 2022 - Q2 - 7 marks
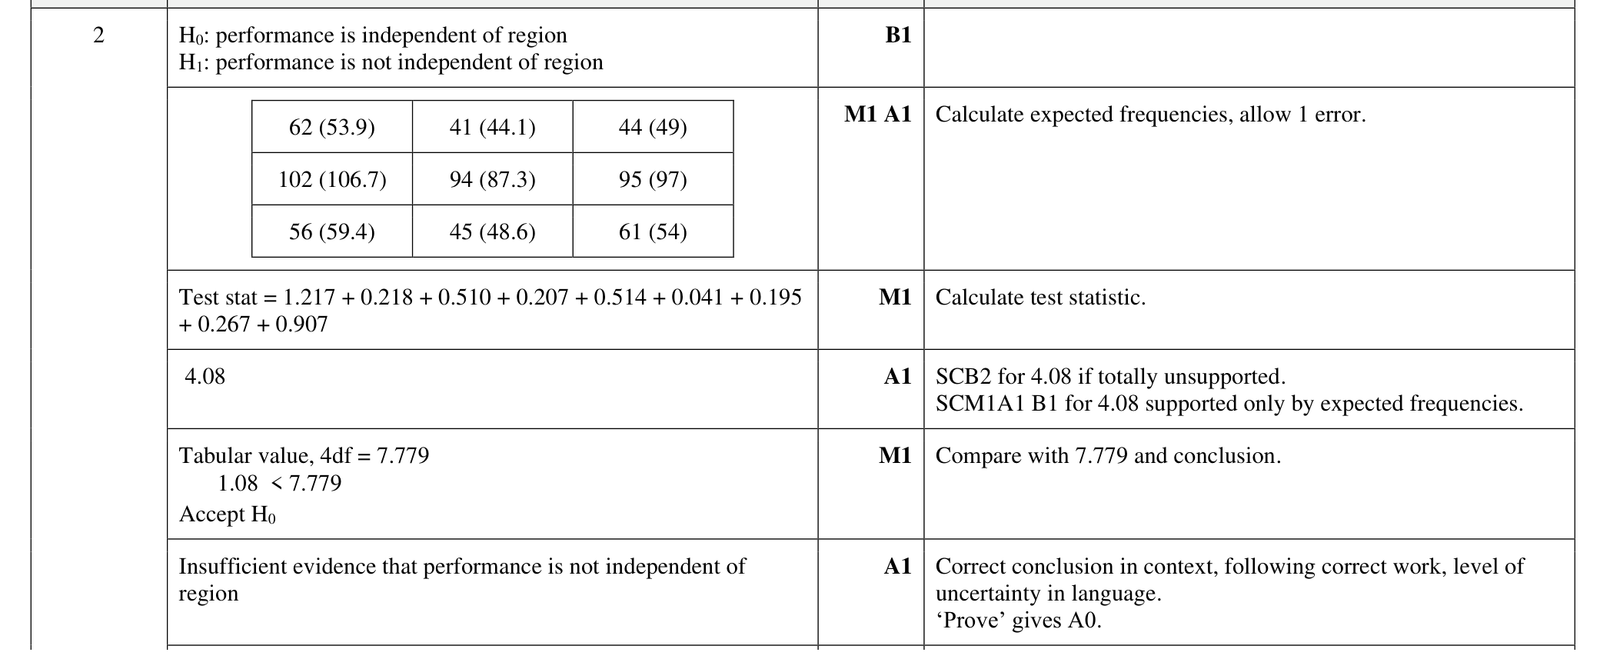
In the colleges in three regions of a particular country, students are given individual targets to achieve. Their performance is measured against their individual target and graded as above target, on target or below target. For a random sample of students from each of the three regions, the observed frequencies are summarised in the following table.
| Performance | A | B | C | Total | |
|---|---|---|---|---|---|
| Performance | Above target | 62 | 41 | 44 | 147 |
| On target | 102 | 94 | 95 | 291 | |
| Below target | 56 | 45 | 61 | 162 | |
| Total | 220 | 180 | 200 | 600 | |
Test, at the 10% significance level, whether performance is independent of region.
9231 P41 - Jun 2021 - Q2 - 7 marks
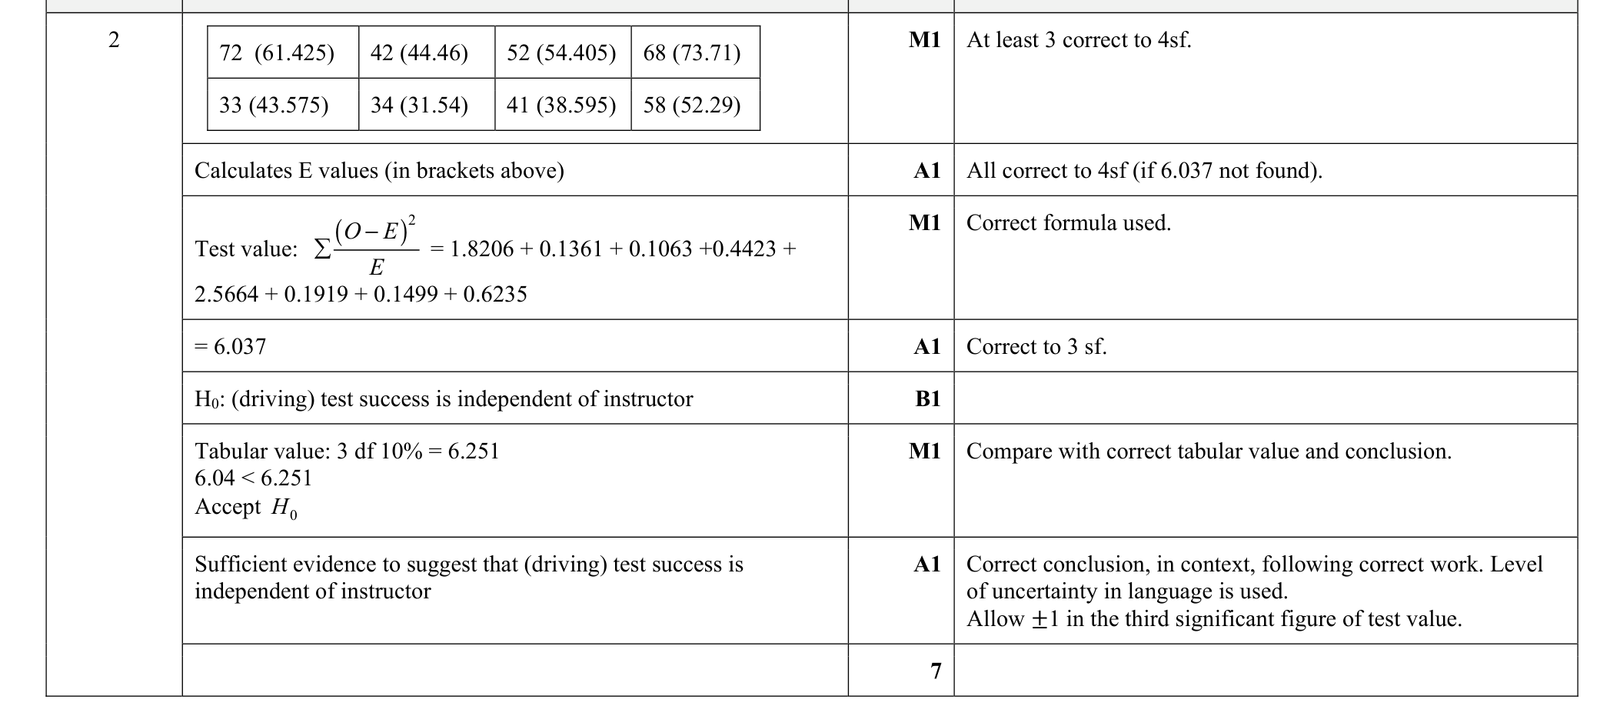
A driving school employs four instructors to prepare people for their driving test. The allocation of people to instructors is random. For each of the instructors, the following table gives the number of people who passed and the number who failed their driving test last year.
| Instructor 1 | Instructor 2 | Instructor 3 | Instructor 4 | |
|---|---|---|---|---|
| Passed | 72 | 42 | 52 | 68 |
| Failed | 33 | 34 | 41 | 58 |
Test at the 10% significance level whether success in the driving test is independent of the instructor.
9231 P41 - Jun 2020 - Q1 - 6 marks
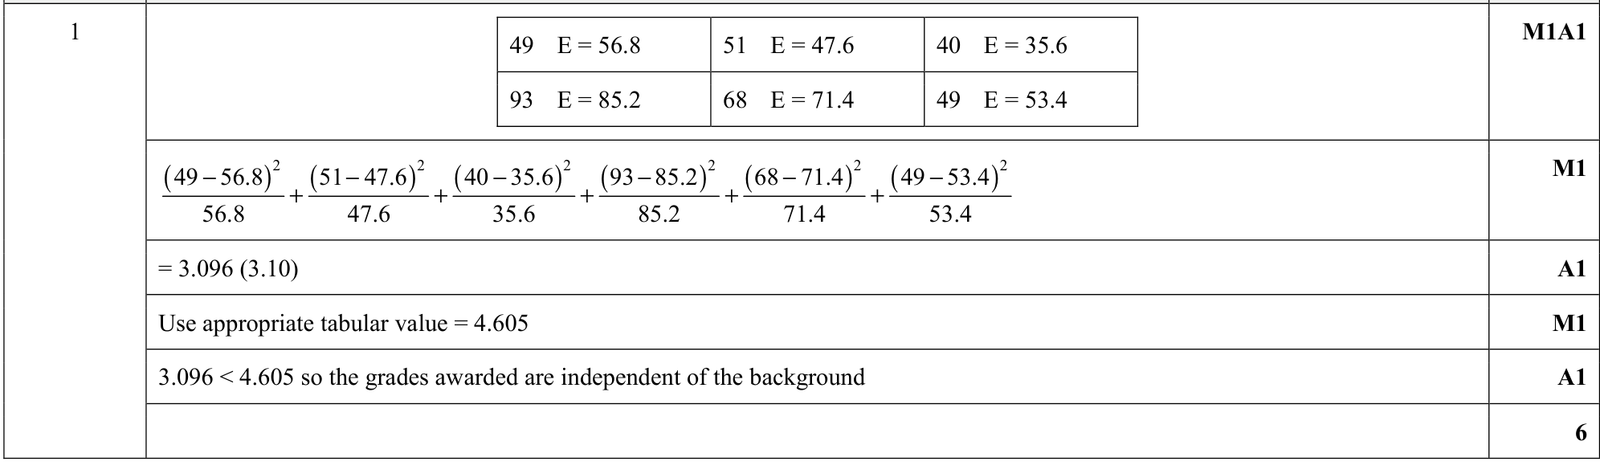
Two randomly selected groups of students, with similar ranges of abilities, take the same examination in different rooms. One group of 140 students takes the examination with background music playing. The other group of 210 students takes the examination in silence. Each student is awarded a grade for their performance in the examination and the numbers from each group gaining each grade are shown in the following table.
| Grade awarded | |||
|---|---|---|---|
| A | B | C | |
| Background music | 49 | 51 | 40 |
| Silence | 93 | 68 | 49 |
Test at the 10% significance level whether grades awarded are independent of whether background music is playing during the examination.
9231 P43 - Jun 2020 - Q1 - 6 marks
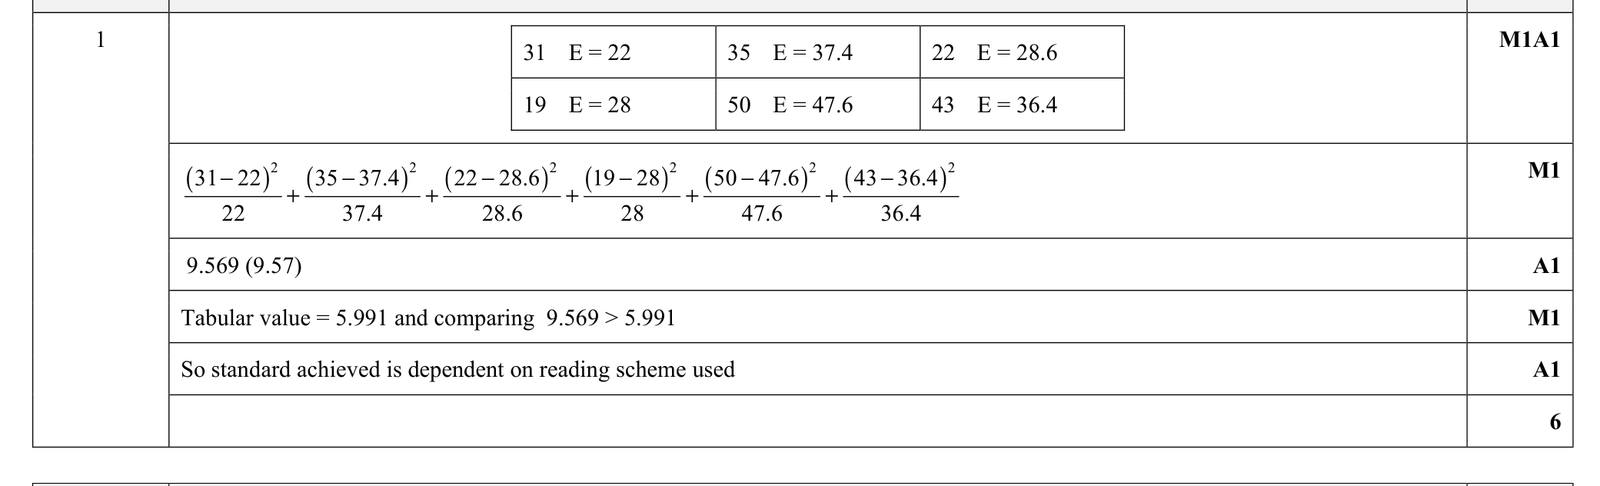
Young children are learning to read using two different reading schemes, \(A\) and \(B\). The standards achieved are measured against the national average standard achieved and classified as above average, average or below average. For two randomly chosen groups of young children, the numbers in each category are shown in the table.
| Standard achieved | |||
|---|---|---|---|
| Above average | Average | Below average | |
| Scheme \(A\) | 31 | 35 | 22 |
| Scheme \(B\) | 19 | 50 | 43 |
Test at the \(5\%\) significance level whether standard achieved is independent of the reading scheme used.