9231 P21 - Nov 2018 - Q11O - 12 marks
Question 11 OR alternative.
A machine is used to produce metal rods. When the machine is working efficiently, the lengths, \(x\ \mathrm{cm}\), of the rods have a normal distribution with mean \(150\ \mathrm{cm}\) and standard deviation \(1.2\ \mathrm{cm}\). The machine is checked regularly by taking random samples of \(200\) rods. The latest results are shown in the following table.
| Interval | \(146 \leq x < 147\) | \(147 \leq x < 148\) | \(148 \leq x < 149\) | \(149 \leq x < 150\) | \(150 \leq x < 151\) | \(151 \leq x < 152\) | \(152 \leq x < 153\) | \(153 \leq x < 154\) |
|---|---|---|---|---|---|---|---|---|
| Observed frequency | 1 | 2 | 23 | 52 | 69 | 36 | 15 | 2 |
As a first check, the sample is used to calculate an estimate for the mean.
(i) Show that an estimate for the mean from this sample is close to \(150\ \mathrm{cm}\).
As a second check, the results are tested for goodness of fit of the normal distribution with mean \(150\ \mathrm{cm}\) and standard deviation \(1.2\ \mathrm{cm}\). The relevant expected frequencies are shown in the following table.
| Interval | \(x < 147\) | \(147 \leq x < 148\) | \(148 \leq x < 149\) | \(149 \leq x < 150\) | \(150 \leq x < 151\) | \(151 \leq x < 152\) | \(152 \leq x < 153\) | \(153 \leq x\) |
|---|---|---|---|---|---|---|---|---|
| Observed frequency | 1 | 2 | 23 | 52 | 69 | 36 | 15 | 2 |
| Expected frequency | 1.24 | 8.32 | 30.94 | 59.50 | 59.50 | 30.94 | 8.32 | 1.24 |
(ii) Show how the expected frequency for \(151 \leq x < 152\) is obtained.
(iii) Test, at the \(5\%\) significance level, the goodness of fit of the normal distribution to the results.

9231 P21 - Jun 2019 - Q9 - 10 marks
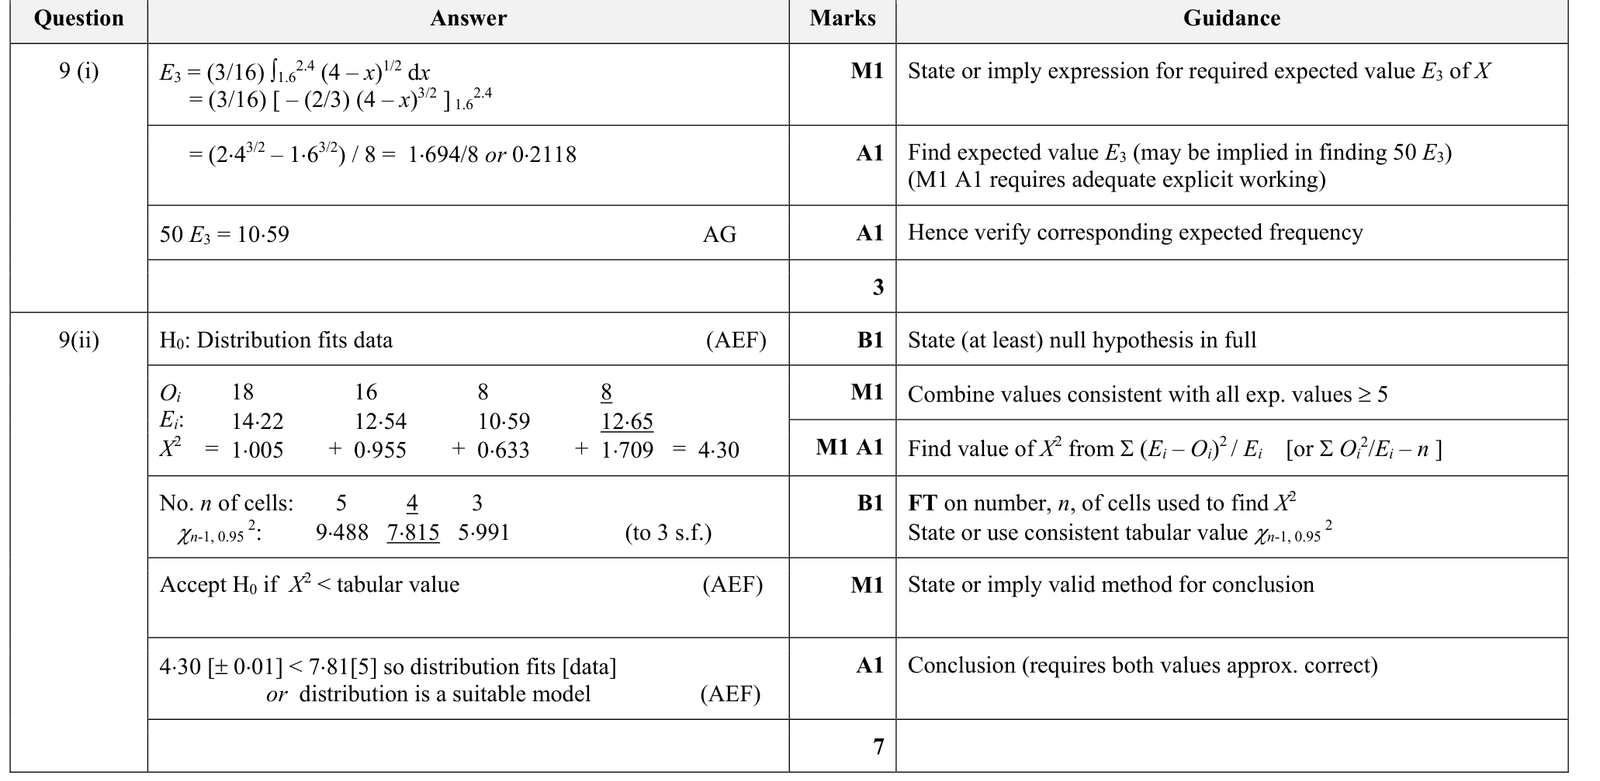
A random sample of 50 observations of the continuous random variable \(X\) was taken and the values are summarised in the following table.
| Interval | \(0 \leqslant x < 0.8\) | \(0.8 \leqslant x < 1.6\) | \(1.6 \leqslant x < 2.4\) | \(2.4 \leqslant x < 3.2\) | \(3.2 \leqslant x < 4\) |
|---|---|---|---|---|---|
| Observed frequency | 18 | 16 | 8 | 6 | 2 |
It is required to test the goodness of fit of the distribution with probability density function \(f\) given by
\[ f(x)= \begin{cases} \dfrac{3}{16}(4-x)^{\frac12}, & 0 \leqslant x < 4,\\[4pt] 0, & \text{otherwise}. \end{cases} \]
The relevant expected frequencies, correct to 2 decimal places, are given in the following table.
| Interval | \(0 \leqslant x < 0.8\) | \(0.8 \leqslant x < 1.6\) | \(1.6 \leqslant x < 2.4\) | \(2.4 \leqslant x < 3.2\) | \(3.2 \leqslant x < 4\) |
|---|---|---|---|---|---|
| Expected frequency | 14.22 | 12.54 | 10.59 | 8.18 | 4.47 |
(i) Show how the expected frequency for \(1.6 \leqslant x < 2.4\) is obtained.
(ii) Carry out a goodness of fit test at the \(5\%\) significance level.
9231 P41 - Jun 2023 - Q3 - 9 marks
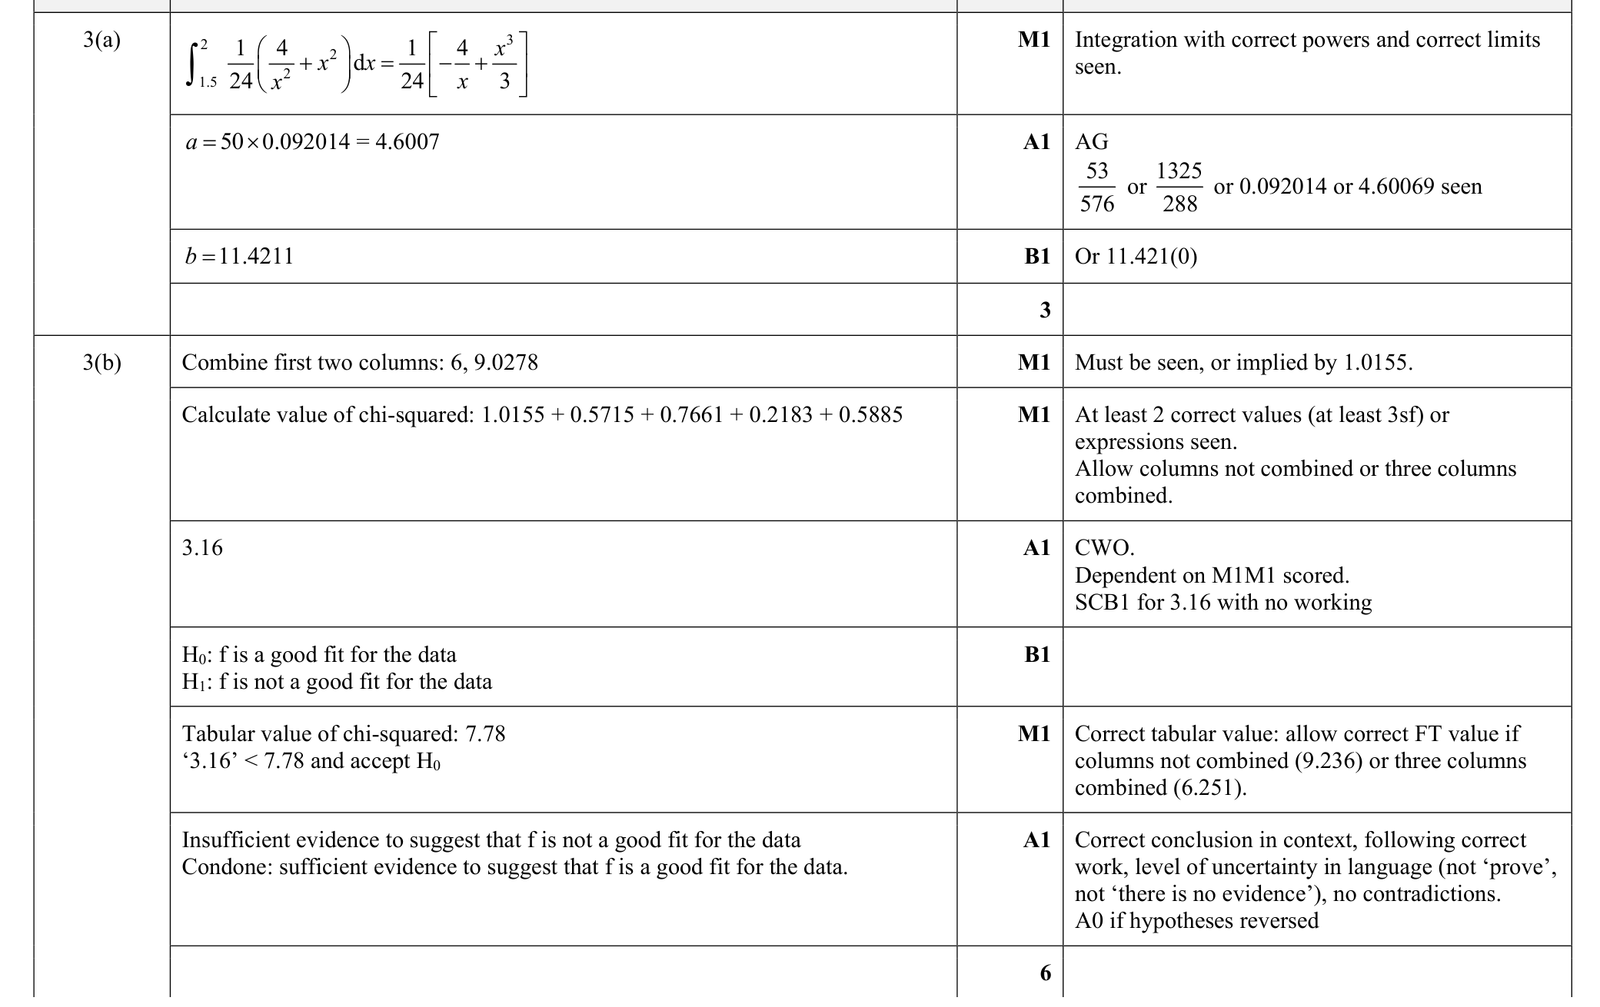
A random sample of 50 values of the continuous random variable \(X\) was taken. These values are summarised in the following table.
Interval | \(1 \leqslant x\lt 1.5\) | \(1.5 \leqslant x\lt 2\) | \(2 \leqslant x\lt 2.5\) | \(2.5 \leqslant x\lt 3\) | \(3 \leqslant x\lt 3.5\) | \(3.5 \leqslant x \leqslant 4\) |
|---|---|---|---|---|---|---|
Observed frequency | 3 | 3 | 8 | 11 | 13 | 12 |
It is required to test the goodness of fit of the distribution with probability density function f given by
\(f(x)=\left\{\begin{array}{ll} \frac{1}{24}\left(\frac{4}{x^{2}}+x^{2}\right) & 1 \leqslant x \leqslant 4, \\ 0 & \text { otherwise } . \end{array}\right.\)
The expected frequencies, correct to 4 decimal places, are given in the following table.
Interval | \(1 \leqslant x\lt 1.5\) | \(1.5 \leqslant x\lt 2\) | \(2 \leqslant x\lt 2.5\) | \(2.5 \leqslant x\lt 3\) | \(3 \leqslant x\lt 3.5\) | \(3.5 \leqslant x \leqslant 4\) |
|---|---|---|---|---|---|---|
Expected frequency | 4.4271 | \(a\) | 6.1285 | 8.4549 | \(b\) | 14.9678 |
(a) Show that \(a=4.6007\) and find the value of \(b\).
(b) Carry out a goodness of fit test, at the \(10 \%\) significance level, to test whether f is a satisfactory model for the data.
9231 P42 - Nov 2021 - Q2 - 8 marks
It is claimed that the heights of a particular age group of boys follow a normal distribution with mean 125 cm and standard deviation 12 cm . Observations for a randomly chosen group of 60 boys in this age group are summarised in the following table. The table also gives the expected frequencies, correct to 2 decimal places, based on the normal distribution with mean 125 cm and standard deviation 12 cm .
(a) Show how the expected frequency for \(130 \leqslant x\lt 140\) is obtained.
(b) Carry out a goodness of fit test, at the \(5 \%\) significance level, to determine whether the claim is supported by the data.

9231 P42 - Nov 2020 - Q3 - 7 marks
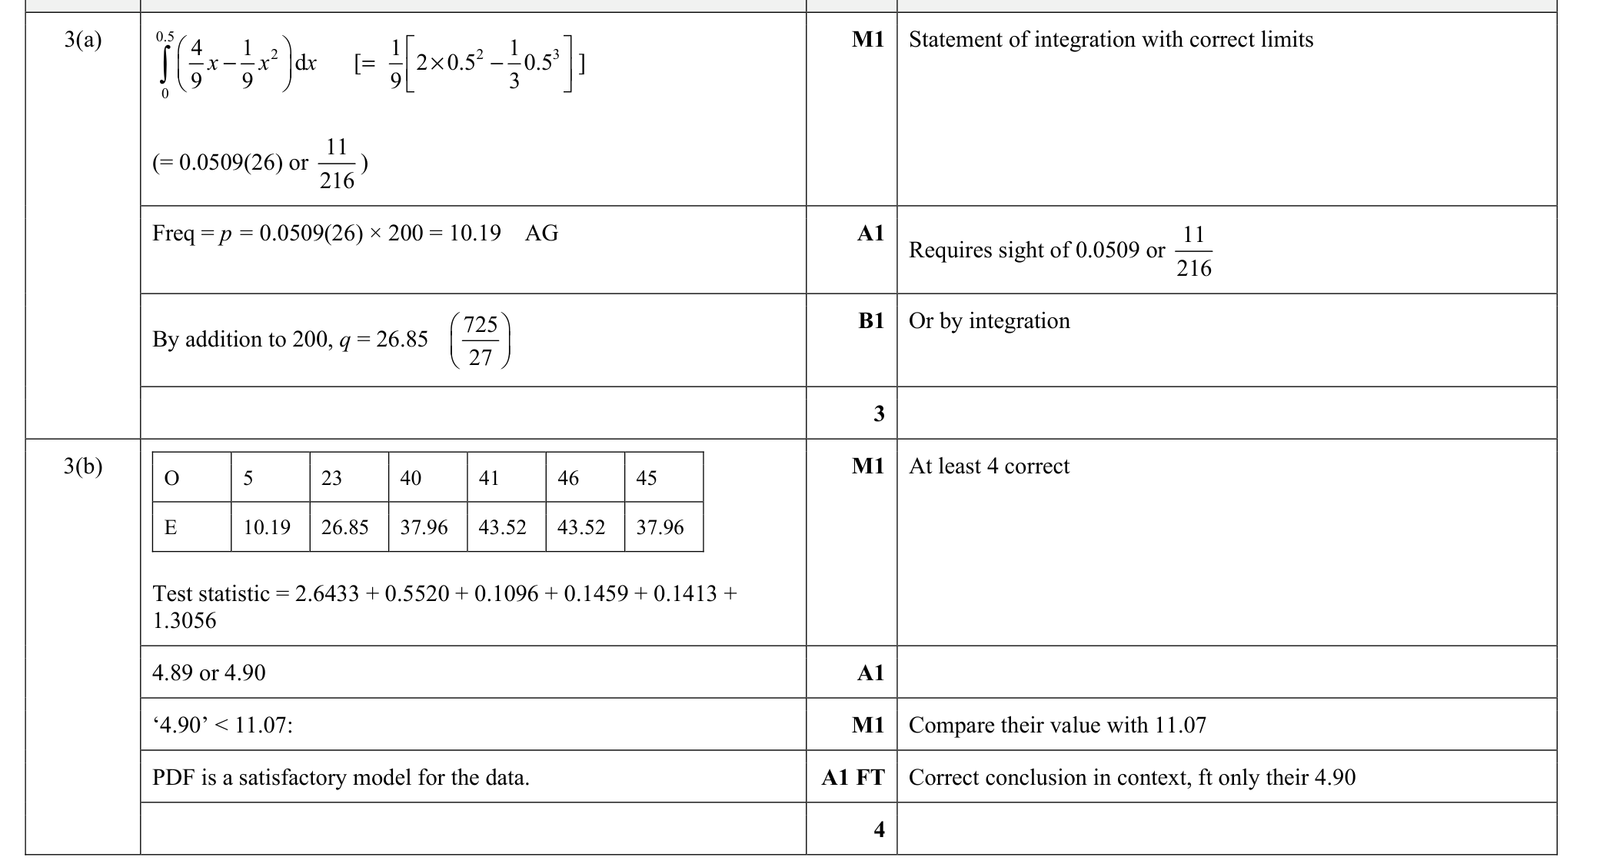
A random sample of 200 observations of the continuous random variable \(X\) was taken and the values are summarised in the following table.
Interval | \(0 \leqslant x\lt 0.5\) | \(0.5 \leqslant x\lt 1\) | \(1 \leqslant x\lt 1.5\) | \(1.5 \leqslant x\lt 2\) | \(2 \leqslant x\lt 2.5\) | \(2.5 \leqslant x\lt 3\) |
|---|---|---|---|---|---|---|
Observed frequency | 5 | 23 | 40 | 41 | 46 | 45 |
It is required to test the goodness of fit of the distribution with probability density function f given by
\(f(x)=\left\{\begin{array}{ll} \frac{1}{9} x(4-x) & 0 \leqslant x \leqslant 3, \\ 0 & \text { otherwise } . \end{array}\right.\)
Most of the relevant expected frequencies, correct to 2 decimal places, are given in the following table.
Interval | \(0 \leqslant x\lt 0.5\) | \(0.5 \leqslant x\lt 1\) | \(1 \leqslant x\lt 1.5\) | \(1.5 \leqslant x\lt 2\) | \(2 \leqslant x\lt 2.5\) | \(2.5 \leqslant x\lt 3\) |
|---|---|---|---|---|---|---|
Expected frequency | \(p\) | \(q\) | 37.96 | 43.52 | 43.52 | 37.96 |
(a) Show that \(p=10.19\) and find the value of \(q\).
(b) Carry out a goodness of fit test, at the \(5 \%\) significance level, to test whether f is a satisfactory model for the data.