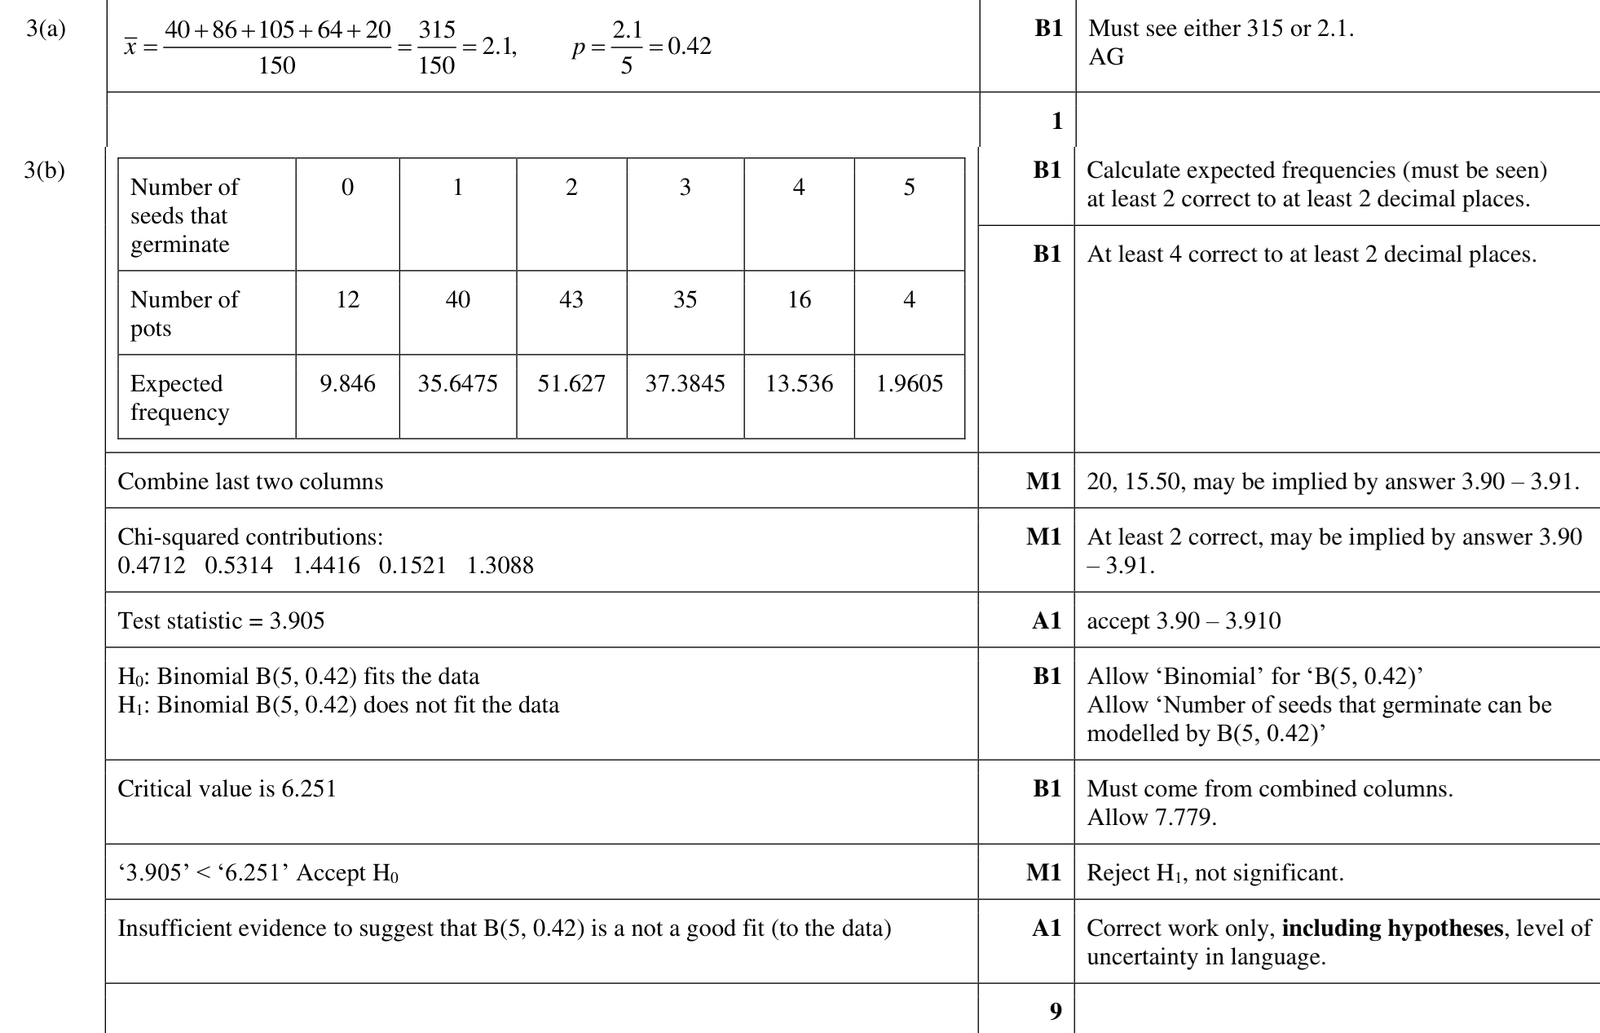
9231 P21 - Nov 2019 - Q11O - 14 marks
Question 11 OR alternative.
The number of puncture repairs carried out each week by a small repair shop is recorded over a period of 40 weeks. The results are shown in the following table.
| Number of repairs in a week | 0 | 1 | 2 | 3 | 4 | 5 | \(\geqslant 6\) |
|---|---|---|---|---|---|---|---|
| Number of weeks | 6 | 15 | 9 | 6 | 3 | 1 | 0 |
(i) Calculate the mean and variance for the number of repairs in a week and comment on the possible suitability of a Poisson distribution to model the data.
Records over a longer period of time indicate that the mean number of repairs in a week is 1.6. The following table shows some of the expected frequencies, correct to 3 decimal places, for a period of 40 weeks using a Poisson distribution with mean 1.6.
| Number of repairs in a week | 0 | 1 | 2 | 3 | 4 | 5 | \(\geqslant 6\) |
|---|---|---|---|---|---|---|---|
| Expected frequency | 8.076 | 12.921 | 10.337 | 5.513 | 2.205 | \(a\) | \(b\) |
(ii) Show that \(a=0.706\) and find the value of the constant \(b\).
(iii) Carry out a goodness of fit test of a Poisson distribution with mean 1.6, using a 10% significance level.

9231 P22 - Nov 2018 - Q10 - 12 marks
The number of accidents, \(x\), that occur each day on a motorway are recorded over a period of 40 days. The results are shown in the following table.
| Number of accidents | 0 | 1 | 2 | 3 | 4 | 5 | 6 | \(\geqslant 7\) |
|---|---|---|---|---|---|---|---|---|
| Observed frequency | 3 | 5 | 8 | 10 | 5 | 7 | 2 | 0 |
(i) Show that the mean number of accidents each day is \(2.95\) and calculate the variance for this sample. Explain why these values suggest that a Poisson distribution might fit the data.
A Poisson distribution with mean \(2.95\), as found from the data, is used to calculate the expected frequencies, correct to 2 decimal places. The results are shown in the following table.
| Number of accidents | 0 | 1 | 2 | 3 | 4 | 5 | 6 | \(\geqslant 7\) |
|---|---|---|---|---|---|---|---|---|
| Observed frequency | 3 | 5 | 8 | 10 | 5 | 7 | 2 | 0 |
| Expected frequency | 2.09 | 6.18 | 9.11 | 8.96 | 6.61 | 3.90 | 1.92 | 1.23 |
(ii) Show how the expected frequency of \(6.61\) for \(x=4\) is obtained.
(iii) Test at the \(5\%\) significance level the goodness of fit of this Poisson distribution to the data.

9231 P21 - Jun 2017 - Q11O - 14 marks
Question 11 OR alternative.
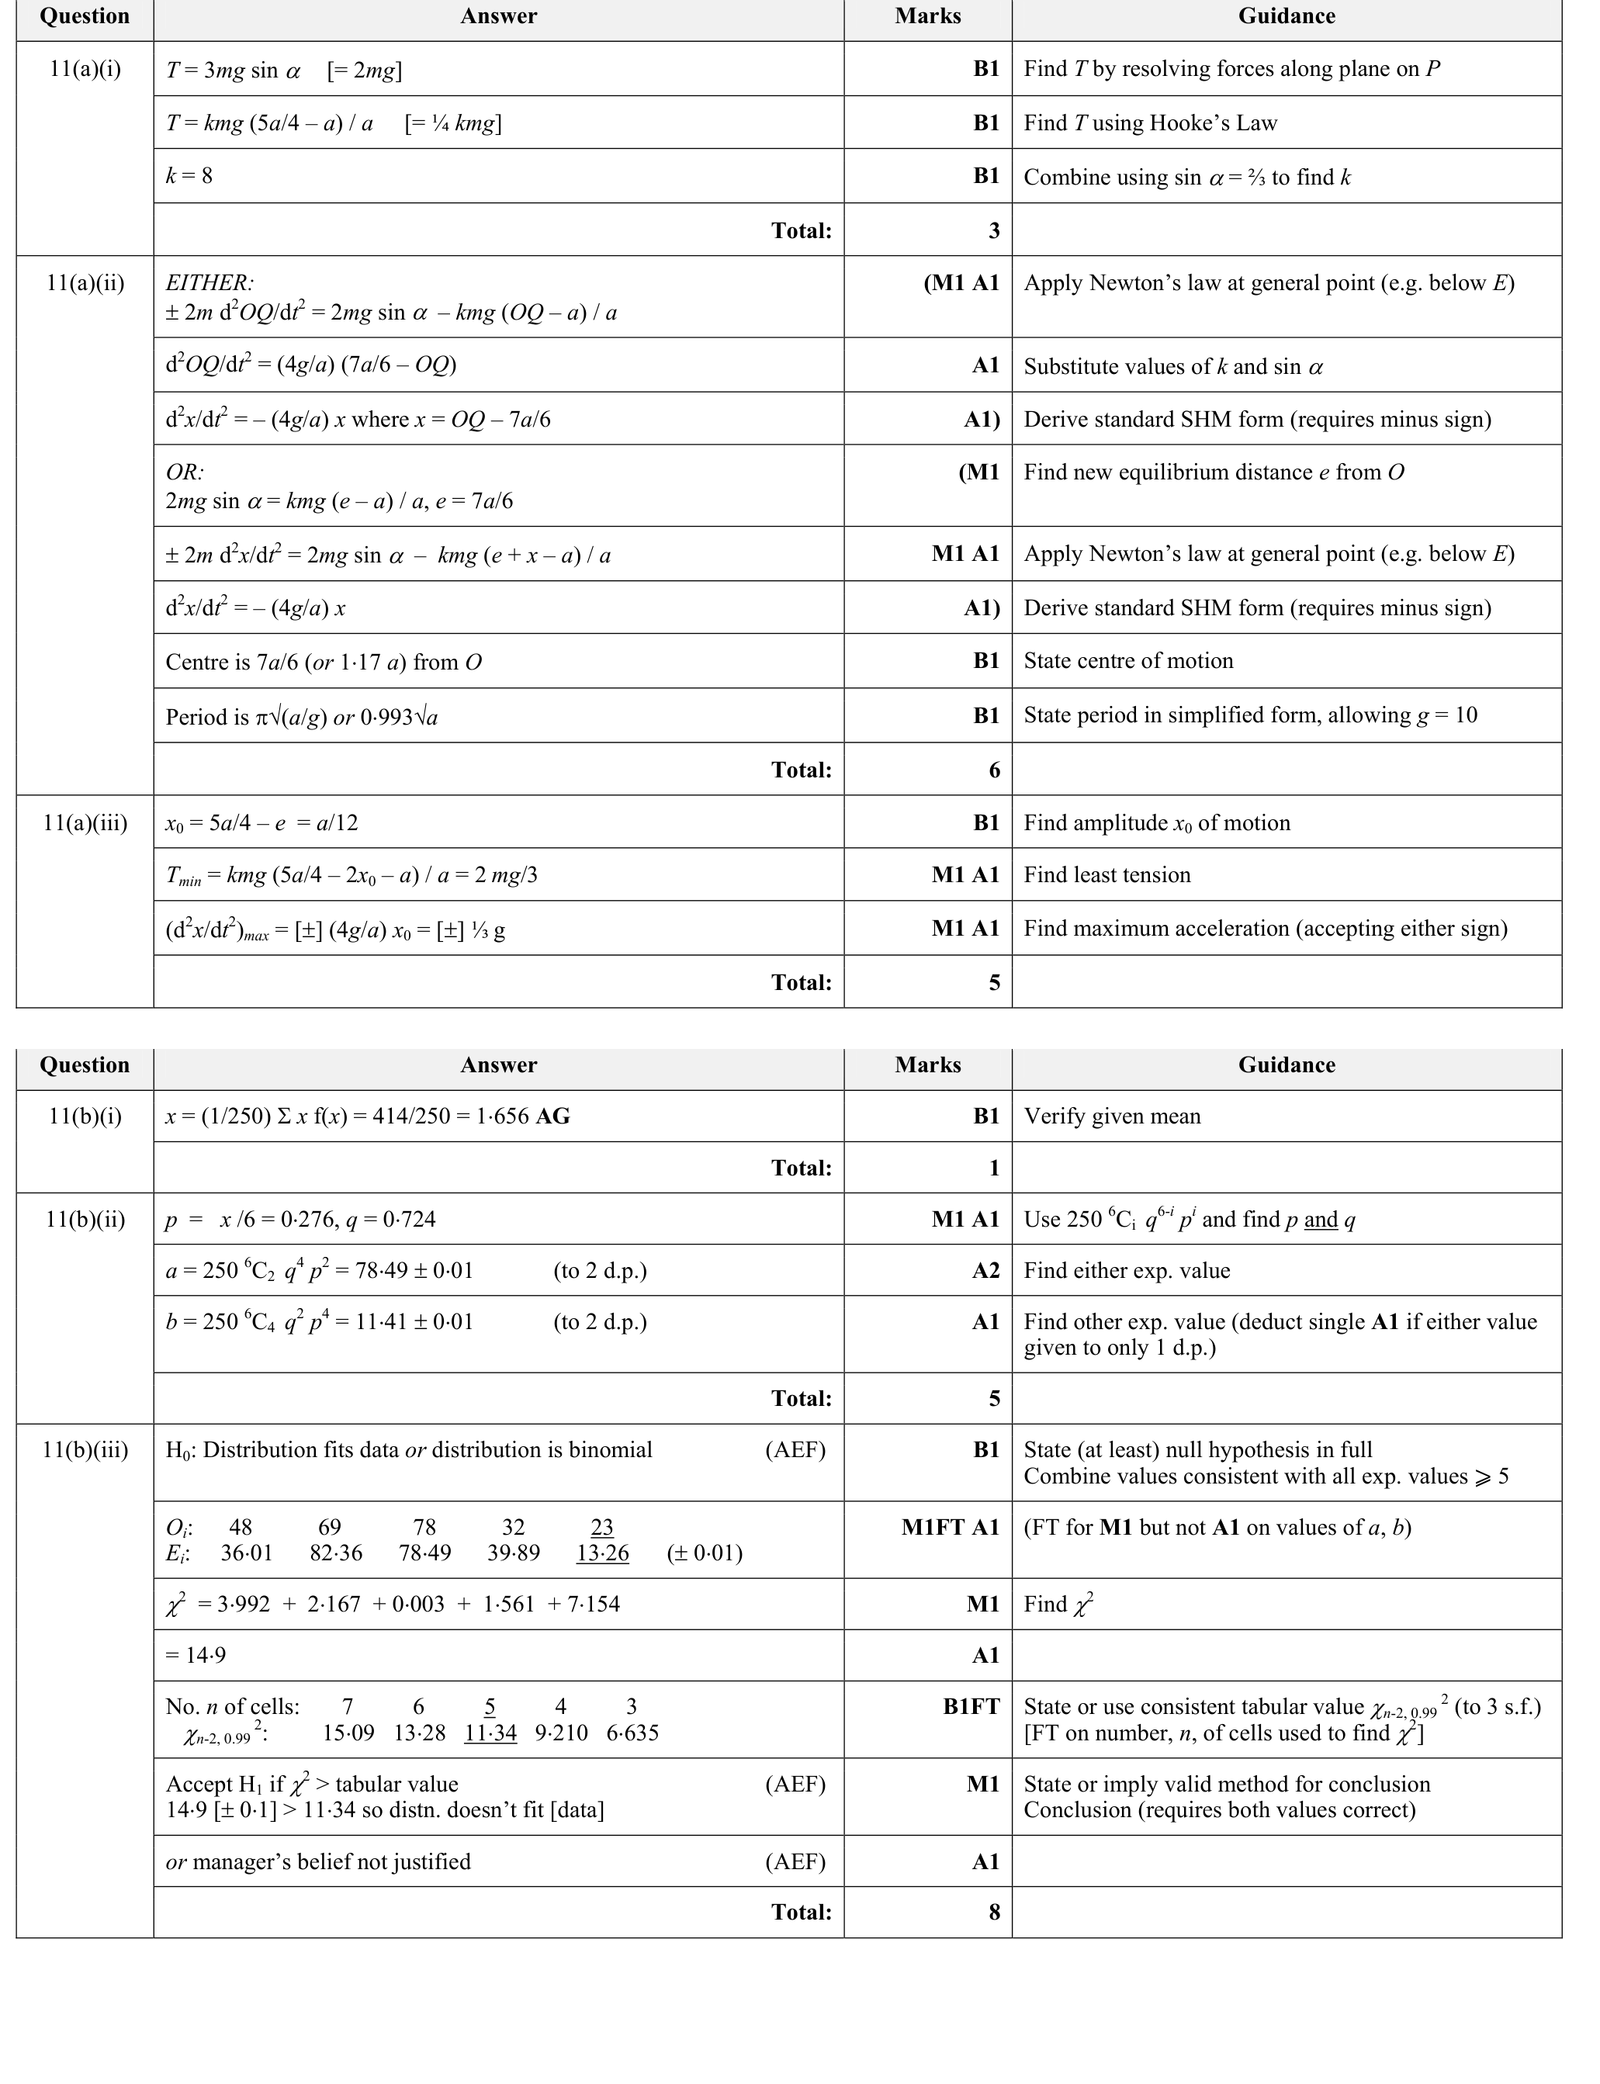
A shop is supplied with large quantities of plant pots in packs of six. These pots can be damaged easily if they are not packed carefully. The manager of the shop is a statistician and he believes that the number of damaged pots in a pack of six has a binomial distribution. He chooses a random sample of 250 packs and records the numbers of damaged pots per pack. His results are shown in the following table.
| Number of damaged pots per pack \((x)\) |
0 | 1 | 2 | 3 | 4 | 5 | 6 |
|---|---|---|---|---|---|---|---|
| Frequency | 48 | 69 | 78 | 32 | 22 | 1 | 0 |
(i) Show that the mean number of damaged pots per pack in this sample is \(1.656\).
The following table shows some of the expected frequencies, correct to 2 decimal places, using an appropriate binomial distribution.
| Number of damaged pots per pack \((x)\) |
0 | 1 | 2 | 3 | 4 | 5 | 6 |
|---|---|---|---|---|---|---|---|
| Expected frequency | 36.01 | 82.36 | \(a\) | 39.89 | \(b\) | 1.74 | 0.11 |
(ii) Find the values of \(a\) and \(b\), correct to 2 decimal places.
(iii) Use a goodness-of-fit test at the \(1\%\) significance level to determine whether the manager's belief is justified.
9231 P23 - Jun 2017 - Q10 - 12 marks
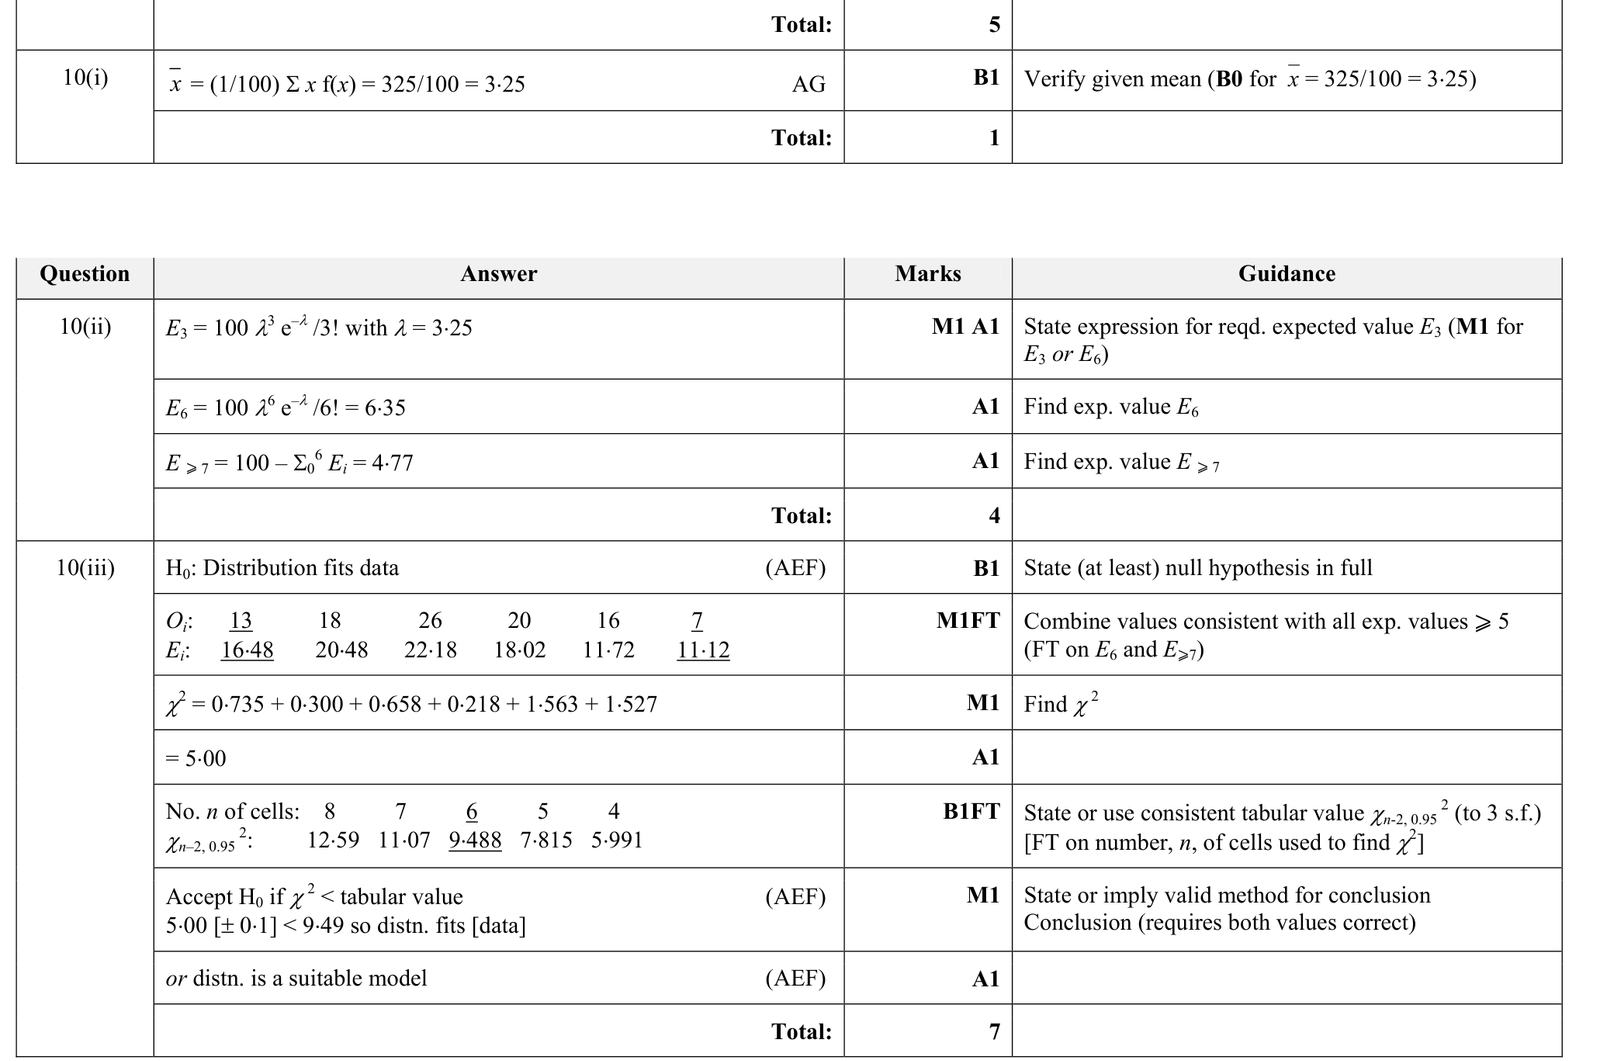
Roberto owns a small hotel and offers accommodation to guests. Over a period of 100 nights, the numbers of rooms, \(x\), that are occupied each night at Roberto's hotel and the corresponding frequencies are shown in the following table.
| Number of rooms occupied \((x)\) |
0 | 1 | 2 | 3 | 4 | 5 | 6 | \(\geqslant 7\) |
|---|---|---|---|---|---|---|---|---|
| Number of nights | 4 | 9 | 18 | 26 | 20 | 16 | 7 | 0 |
(i) Show that the mean number of rooms that are occupied each night is \(3.25\).
The following table shows most of the corresponding expected frequencies, correct to 2 decimal places, using a Poisson distribution with mean \(3.25\).
| Number of rooms occupied \((x)\) |
0 | 1 | 2 | 3 | 4 | 5 | 6 | \(\geqslant 7\) |
|---|---|---|---|---|---|---|---|---|
| Observed frequency | 4 | 9 | 18 | 26 | 20 | 16 | 7 | 0 |
| Expected frequency | 3.88 | 12.60 | 20.48 | 22.18 | 18.02 | 11.72 |
(ii) Show how the expected value of \(22.18\), for \(x=3\), is obtained and find the expected values for \(x=6\) and for \(x \geqslant 7\).
(iii) Use a goodness-of-fit test at the \(5\%\) significance level to determine whether the Poisson distribution is a suitable model for the number of rooms occupied each night at Roberto's hotel.
9231 P23 - Jun 2018 - Q11O - 14 marks
Question 11 OR alternative.
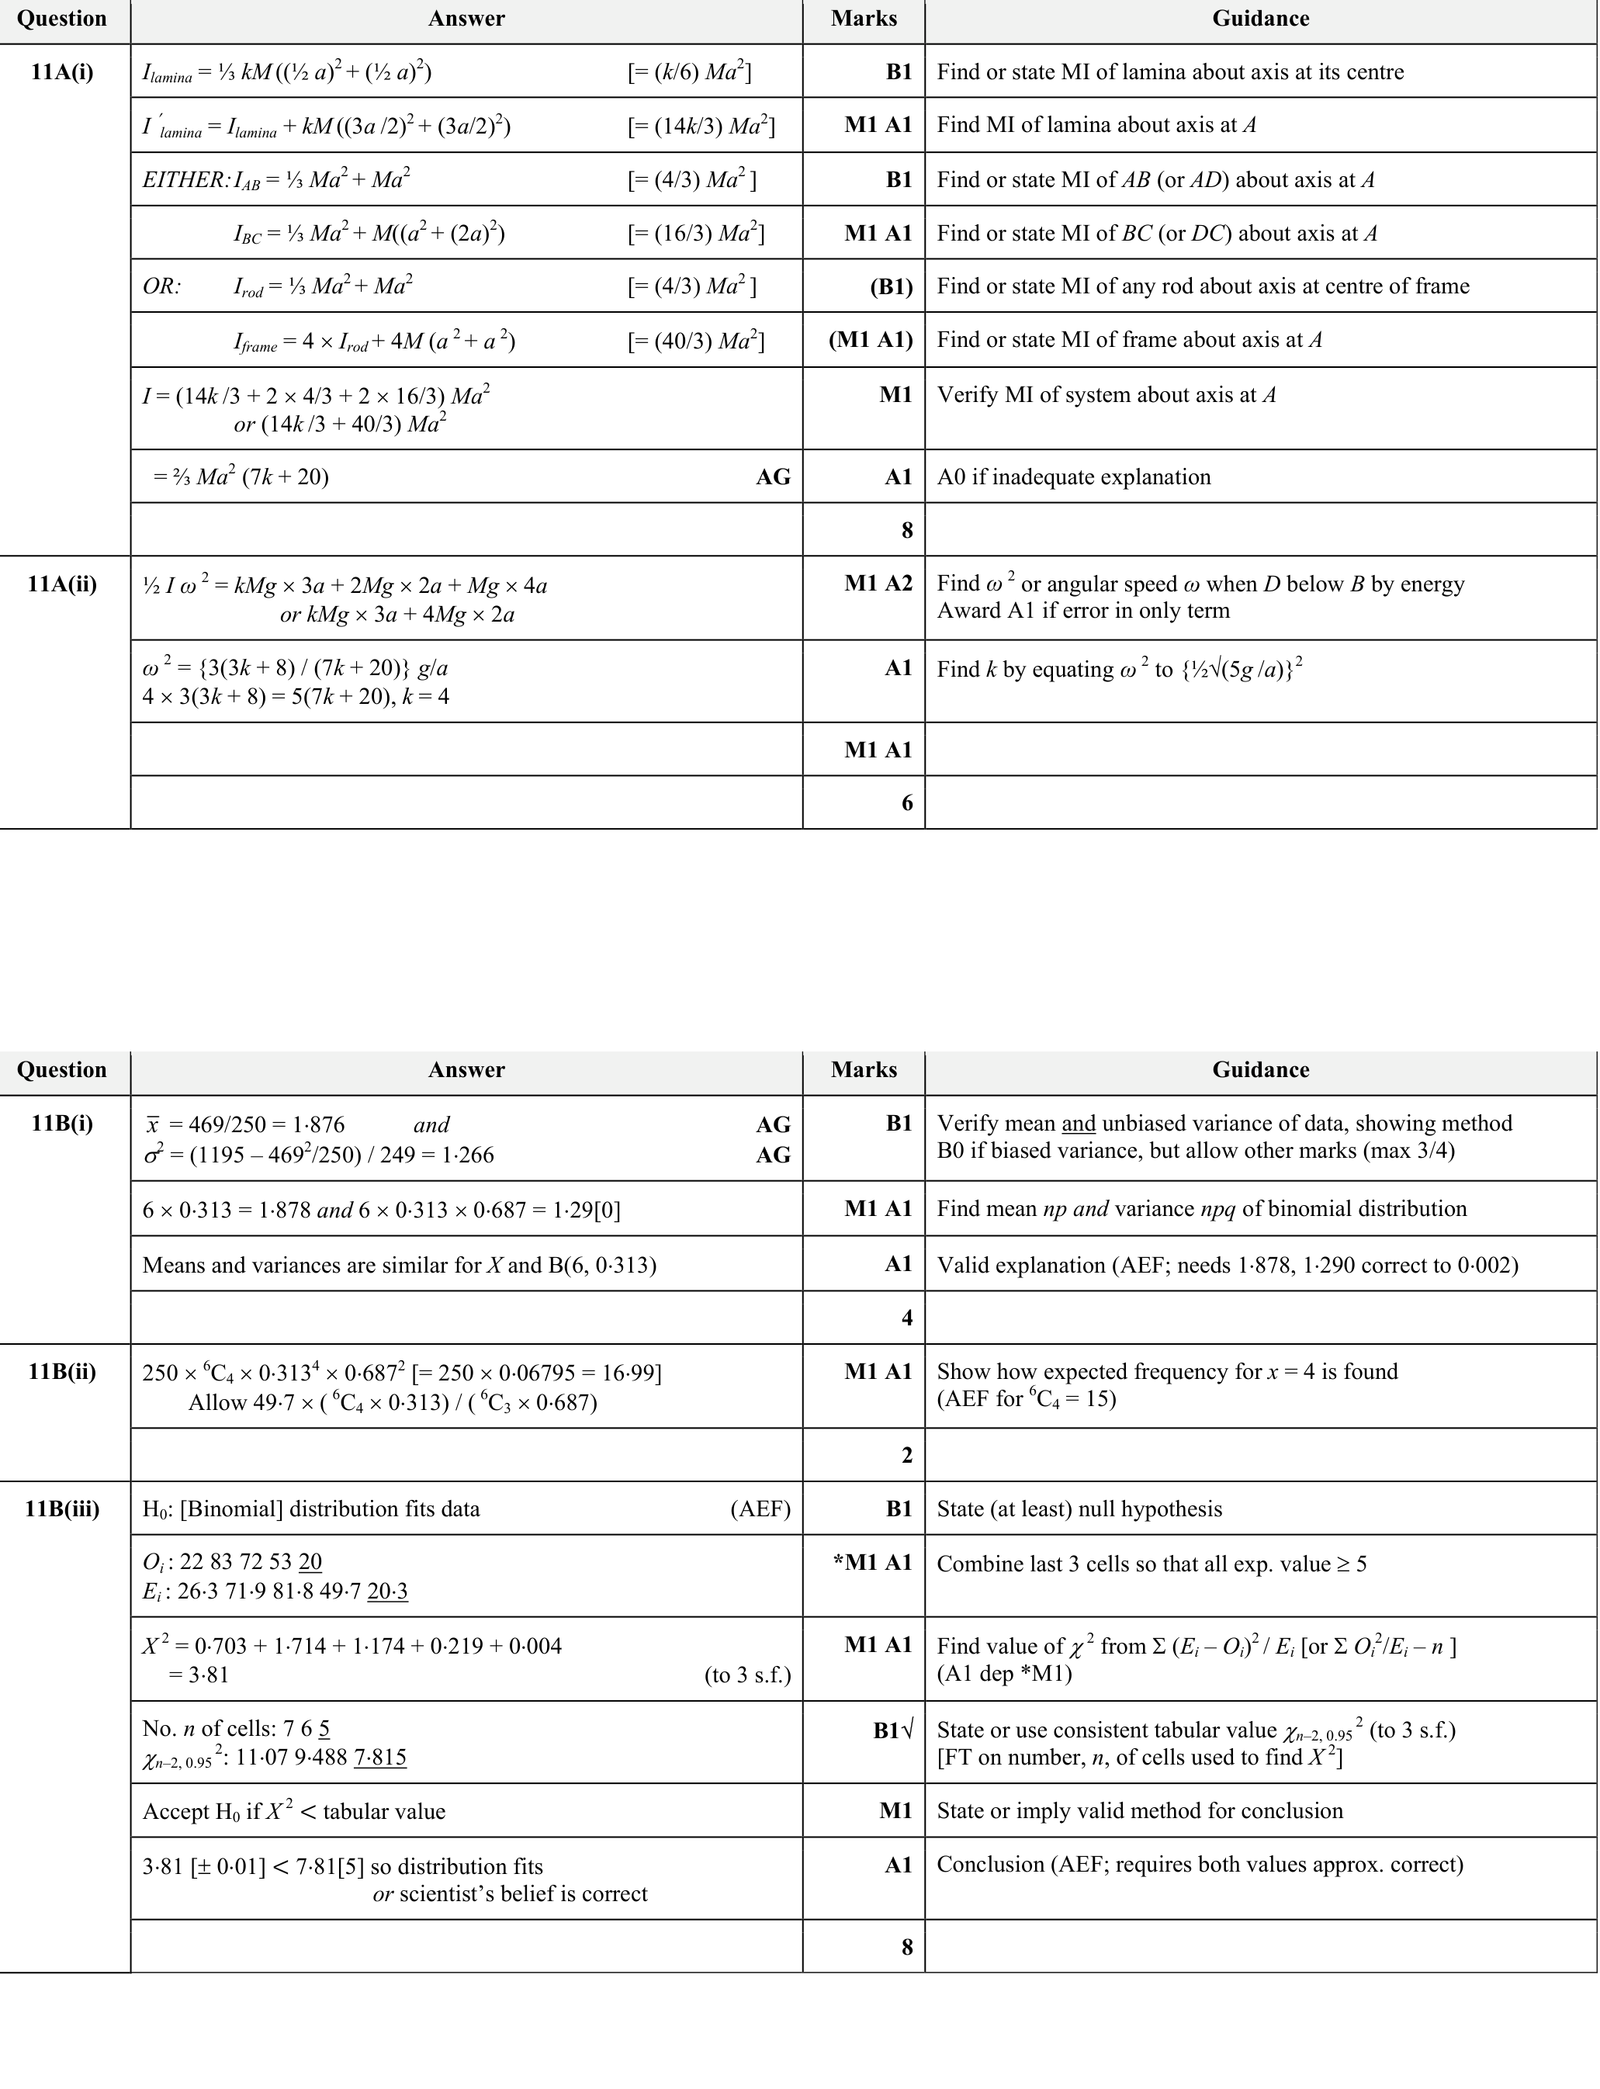
A scientist carries out an experiment to investigate the quantity \(X\), which takes the values \(0,1,2,3,4,5\) or \(6\). He believes that the values taken by \(X\) follow a binomial distribution. He conducts \(250\) trials. His results are summarised in the following table.
| \(x\) | 0 | 1 | 2 | 3 | 4 | 5 | 6 |
|---|---|---|---|---|---|---|---|
| Observed frequency | 22 | 83 | 72 | 53 | 17 | 3 | 0 |
(i) Show that unbiased estimates of the mean and variance for these results are \(1.876\) and \(1.266\) respectively, correct to 3 decimal places. By evaluating the mean and variance of the distribution \(B(6,0.313)\), explain why \(X\) could have this distribution.
The expected frequencies corresponding to the distribution \(B(6,0.313)\) are shown in the following table.
| \(x\) | 0 | 1 | 2 | 3 | 4 | 5 | 6 |
|---|---|---|---|---|---|---|---|
| Observed frequency | 22 | 83 | 72 | 53 | 17 | 3 | 0 |
| Expected frequency | 26.3 | 71.9 | 81.8 | 49.7 | 17.0 | 3.1 | 0.2 |
(ii) Show how the expected frequency for \(x=4\) is calculated.
(iii) Test at the \(5\%\) significance level whether the scientist's belief is correct.
9231 P41 - Nov 2025 - Q2 - 6 marks
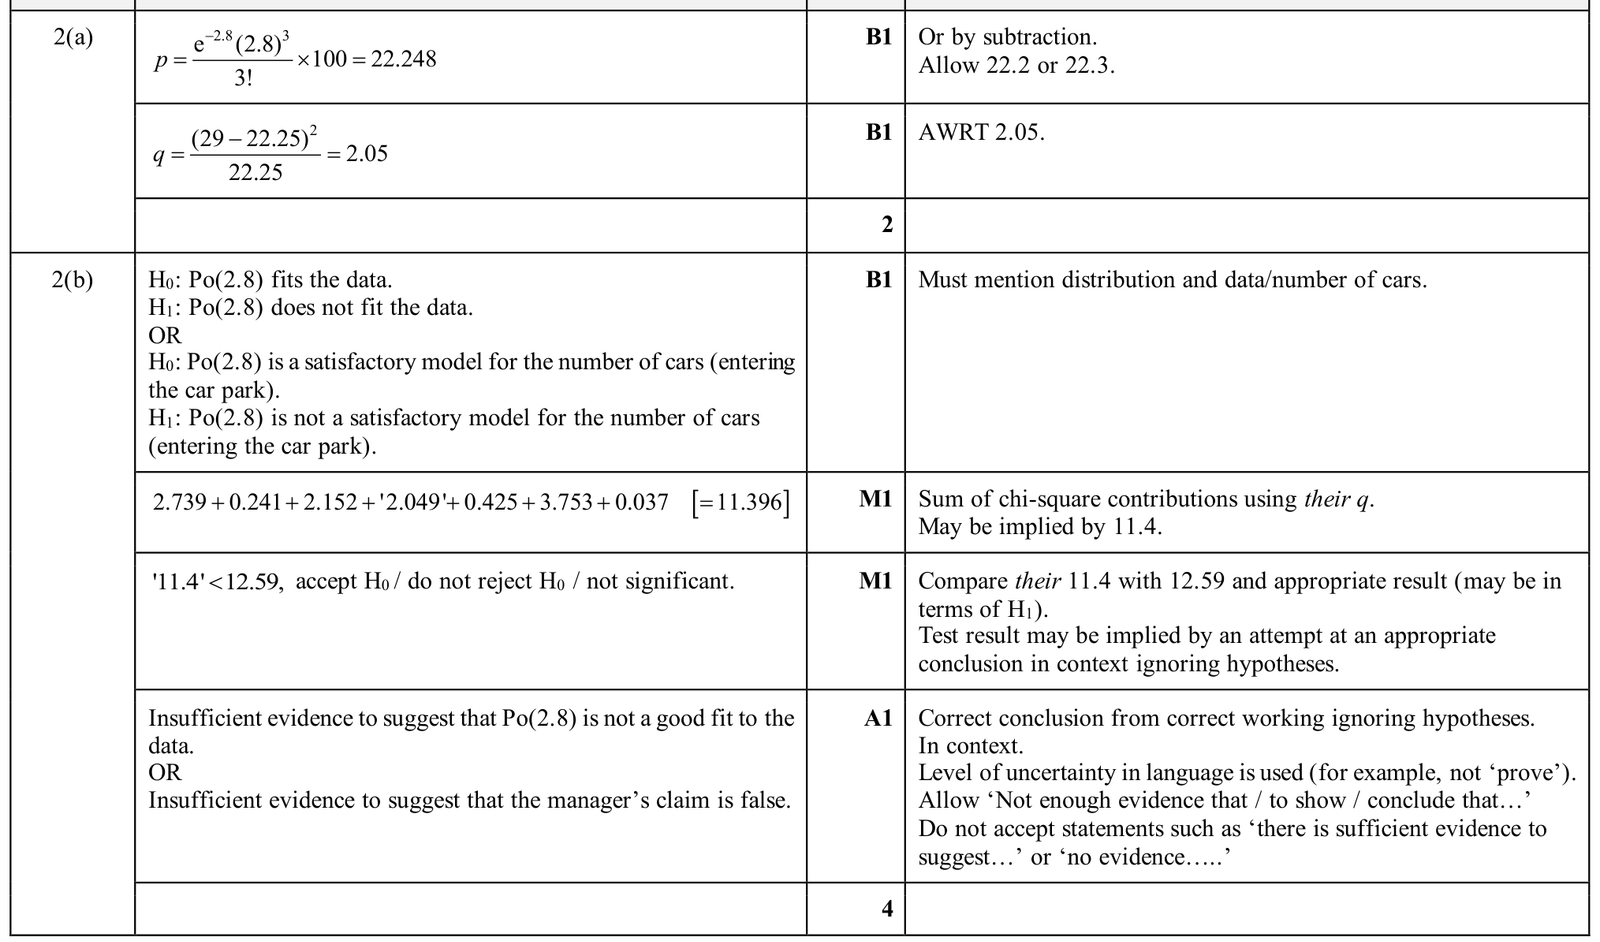
The manager of a car park claims that the number of cars entering the car park follows a Poisson distribution with mean \(2.8\). The numbers of cars entering the car park are recorded on a working day during successive 5-minute periods. The following table contains the observed frequencies, together with most of the expected frequencies and their contributions to the \(\chi^{2}\)-test statistic.
| Number of cars | \(0\) | \(1\) | \(2\) | \(3\) | \(4\) | \(5\) | \(\geq 6\) |
|---|---|---|---|---|---|---|---|
| Observed frequency | \(2\) | \(15\) | \(31\) | \(29\) | \(13\) | \(3\) | \(7\) |
| Expected frequency | \(6.081\) | \(17.03\) | \(23.84\) | \(p\) | \(15.57\) | \(8.721\) | \(6.511\) |
| \(\chi^{2}\)-test statistic | \(2.739\) | \(0.241\) | \(2.152\) | \(q\) | \(0.425\) | \(3.753\) | \(0.037\) |
(a) Find the value of \(p\) and the value of \(q\).
(b) Carry out a goodness of fit test at the \(5\%\) significance level to investigate the manager's claim.
9231 P42 - Nov 2025 - Q3 - 8 marks
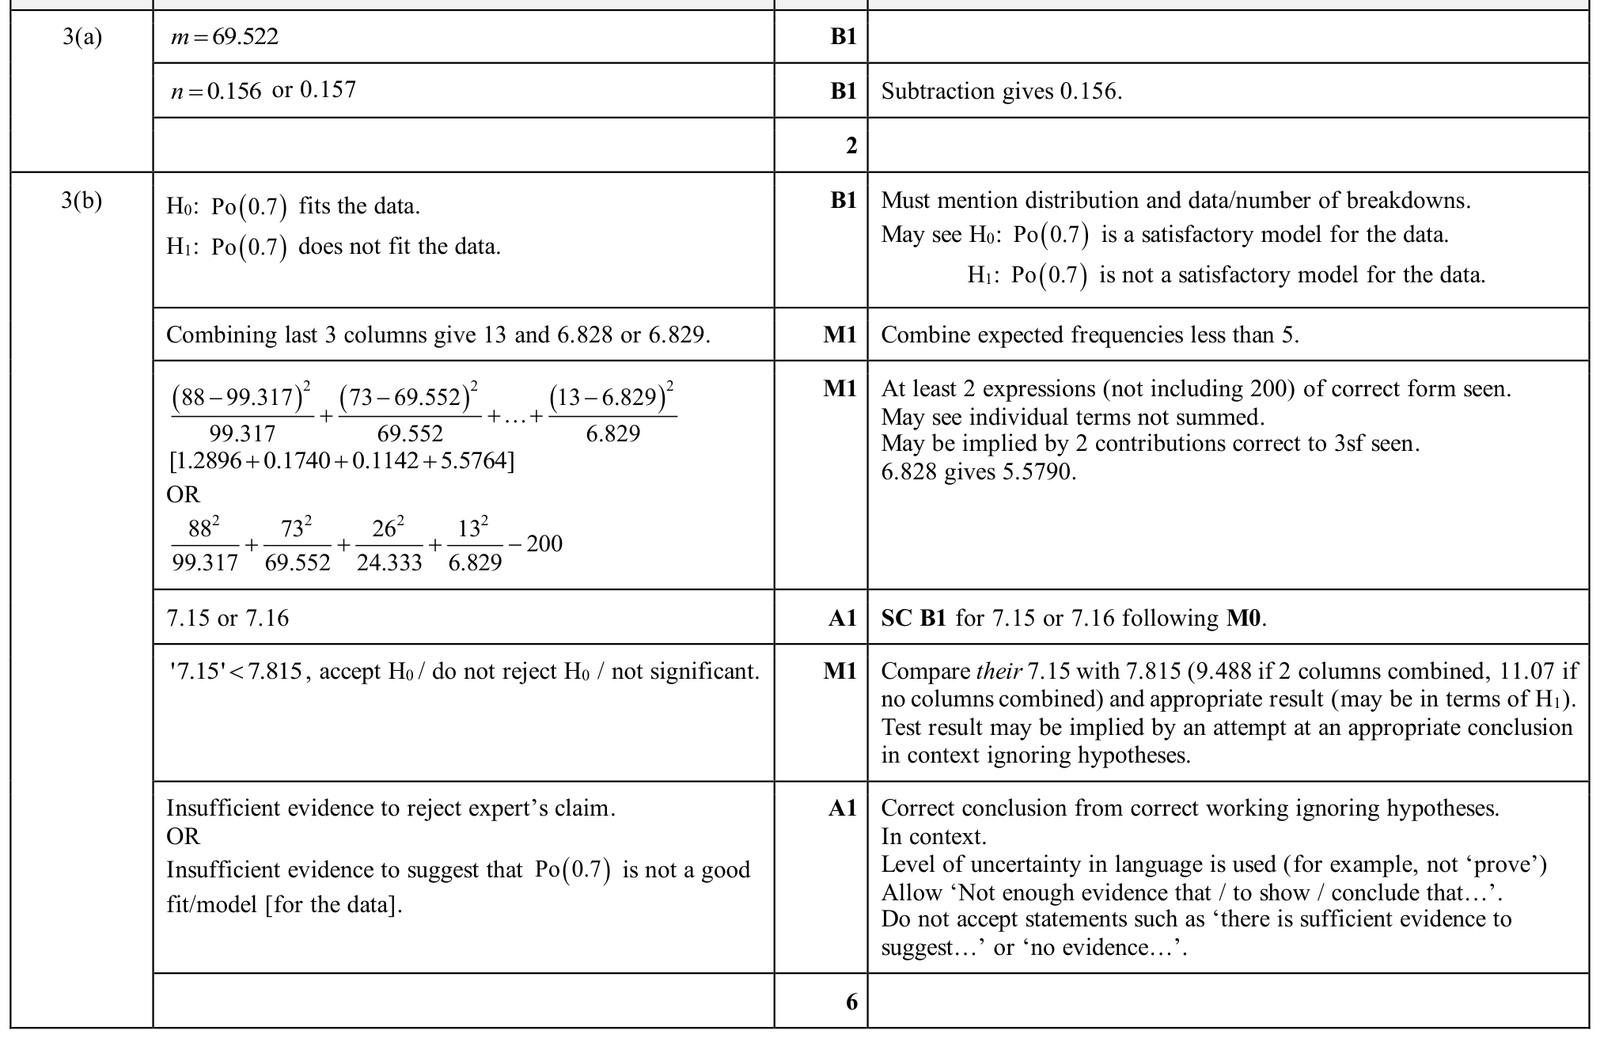
A traffic expert claims that the number of breakdowns occurring each day on a busy section of a motorway follows a Poisson distribution with mean \(0.7\). The number of breakdowns each day over a 200-day period was recorded. The following table contains the observed frequencies together with some of the expected frequencies using the expert's distribution.
| Number of breakdowns per day | \(0\) | \(1\) | \(2\) | \(3\) | \(4\) | \(\geqslant 5\) |
|---|---|---|---|---|---|---|
| Observed frequency | \(88\) | \(73\) | \(26\) | \(7\) | \(3\) | \(3\) |
| Expected frequency | \(99.317\) | \(m\) | \(24.333\) | \(5.678\) | \(0.994\) | \(n\) |
(a) Find the value of \(m\) and the value of \(n\), correct to 3 decimal places.
(b) Carry out a goodness of fit test at the \(5\%\) significance level to investigate the expert's claim.
9231 P41 - Jun 2025 - Q3 - 8 marks
Eggs in a supermarket are sold in boxes of six. A supermarket manager wishes to model the number of broken eggs in the boxes sold in the store. A random sample of 2000 boxes is taken and the number of broken eggs recorded. The observed frequencies are shown in the table below.
Number of broken eggs | 0 | 1 | 2 | 3 | 4 | 5 | 6 |
|---|---|---|---|---|---|---|---|
Observed frequency | 1844 | 143 | 11 | 0 | 1 | 0 | 1 |
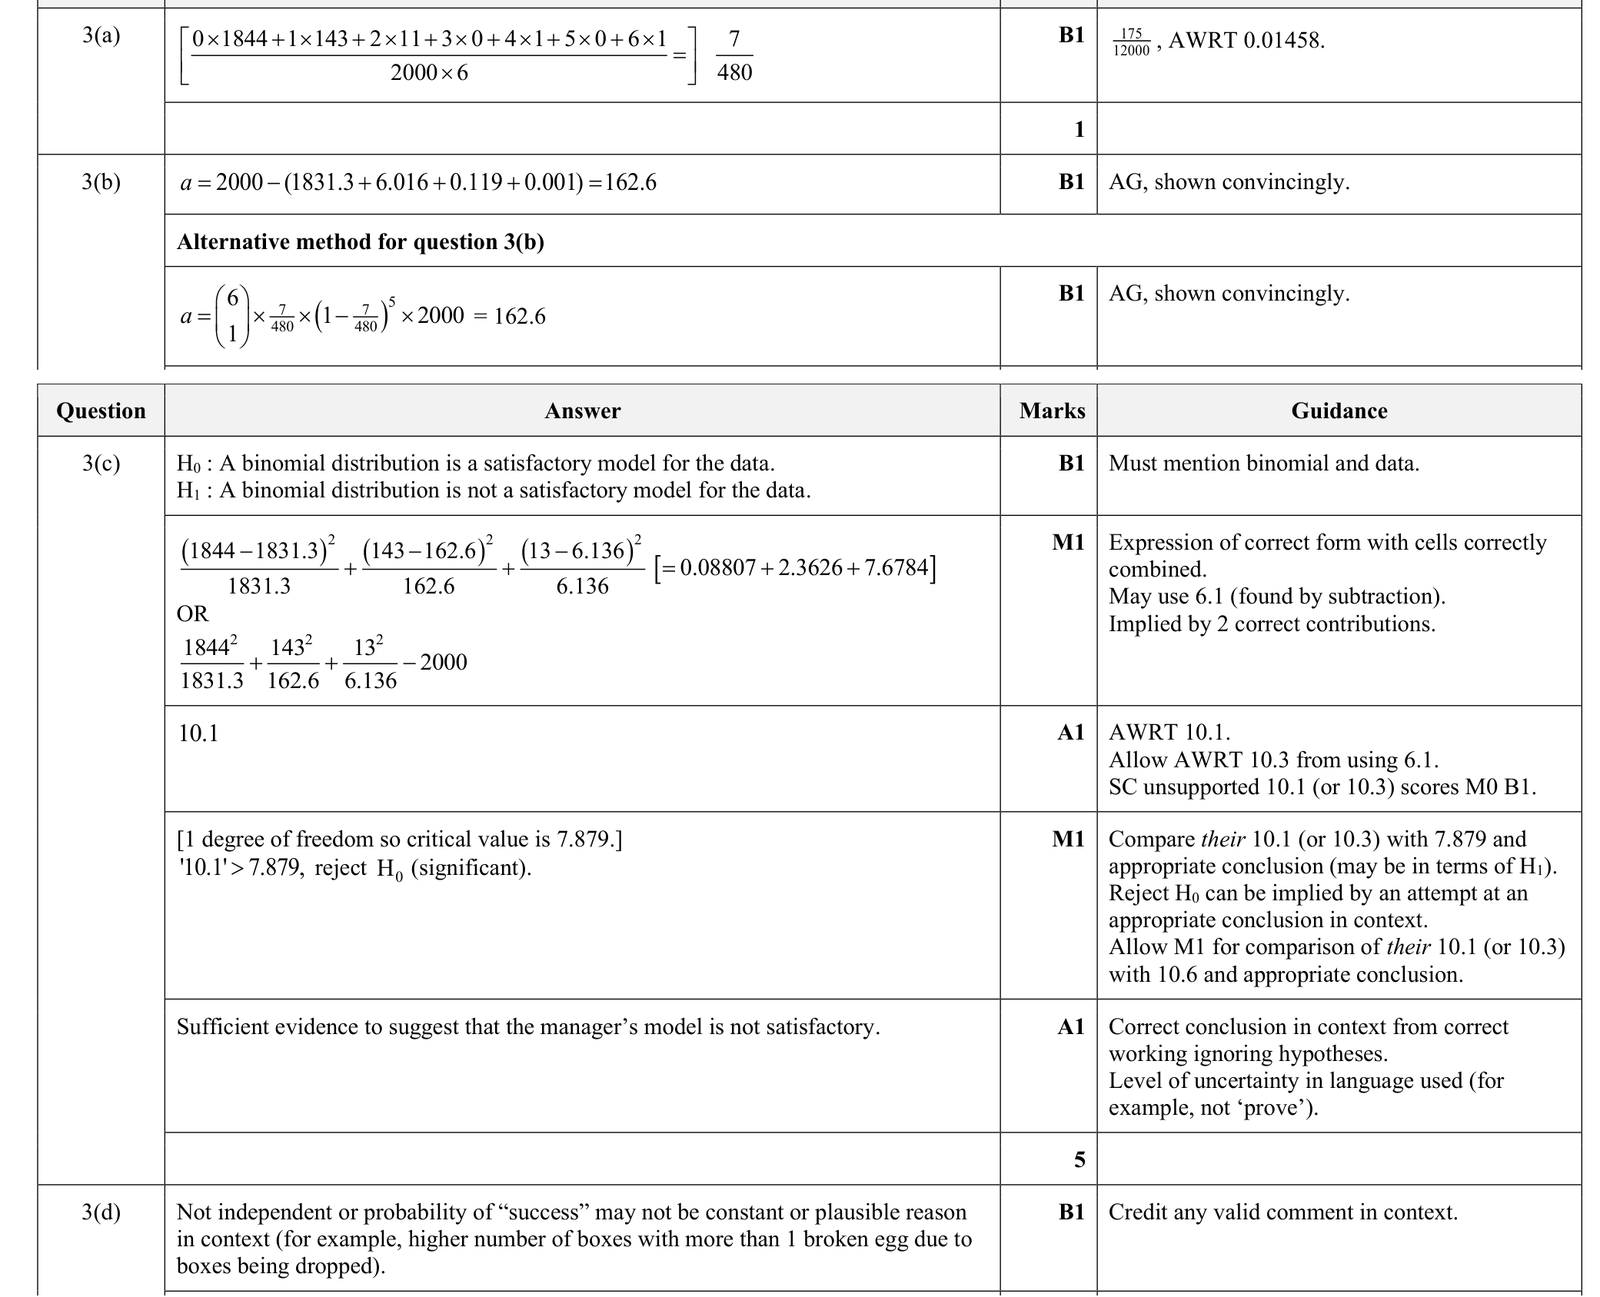
(a) Use the data to estimate the probability that an egg is broken. Give your answer correct to 4 significant figures.
It is decided to carry out a goodness of fit test at the \(0.5 \%\) significance level to determine whether a binomial distribution fits the data.
The observed frequencies and the expected frequencies are given in the following table.
Number of broken eggs | 0 | 1 | 2 | 3 | 4 | 5 | 6 |
|---|---|---|---|---|---|---|---|
Observed frequency | 1844 | 143 | 11 | 0 | 1 | 0 | 1 |
Expected frequency | 1831.3 | \(a\) | 6.016 | 0.119 | 0.001 | 0.000 | 0.000 |
(b) Show that \(a=162.6\) correct to 1 decimal place.
(c) Carry out a goodness of fit test at the \(0.5 \%\) level of significance to test whether a binomial distribution is a satisfactory model for the data.
(d) Give a reason why a binomial distribution may not be a suitable model in this situation.
9231 P43 - Jun 2025 - Q1 - 6 marks
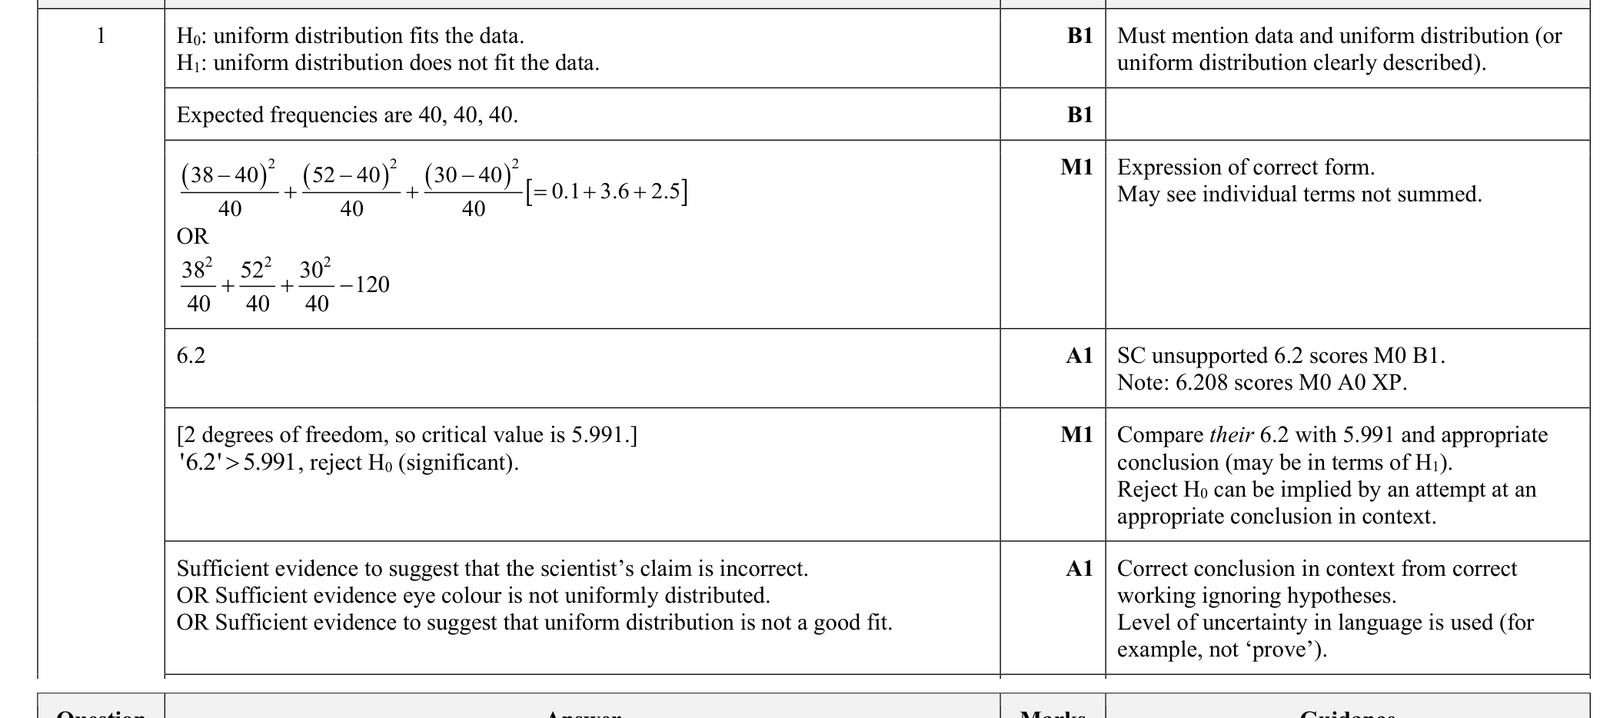
A person's eye colour may be categorised as "brown", "blue" or "other". A scientist claims that these eye colours are uniformly distributed and hence are equally likely to occur in the population. A survey of 120 people from this population found that 38 people had brown eyes, 52 people had blue eyes and 30 people had eyes which were neither brown nor blue.
Use the data to carry out a goodness of fit test at the \(5 \%\) significance level to test the scientist's claim.
9231 P42 - Nov 2023 - Q2 - 8 marks
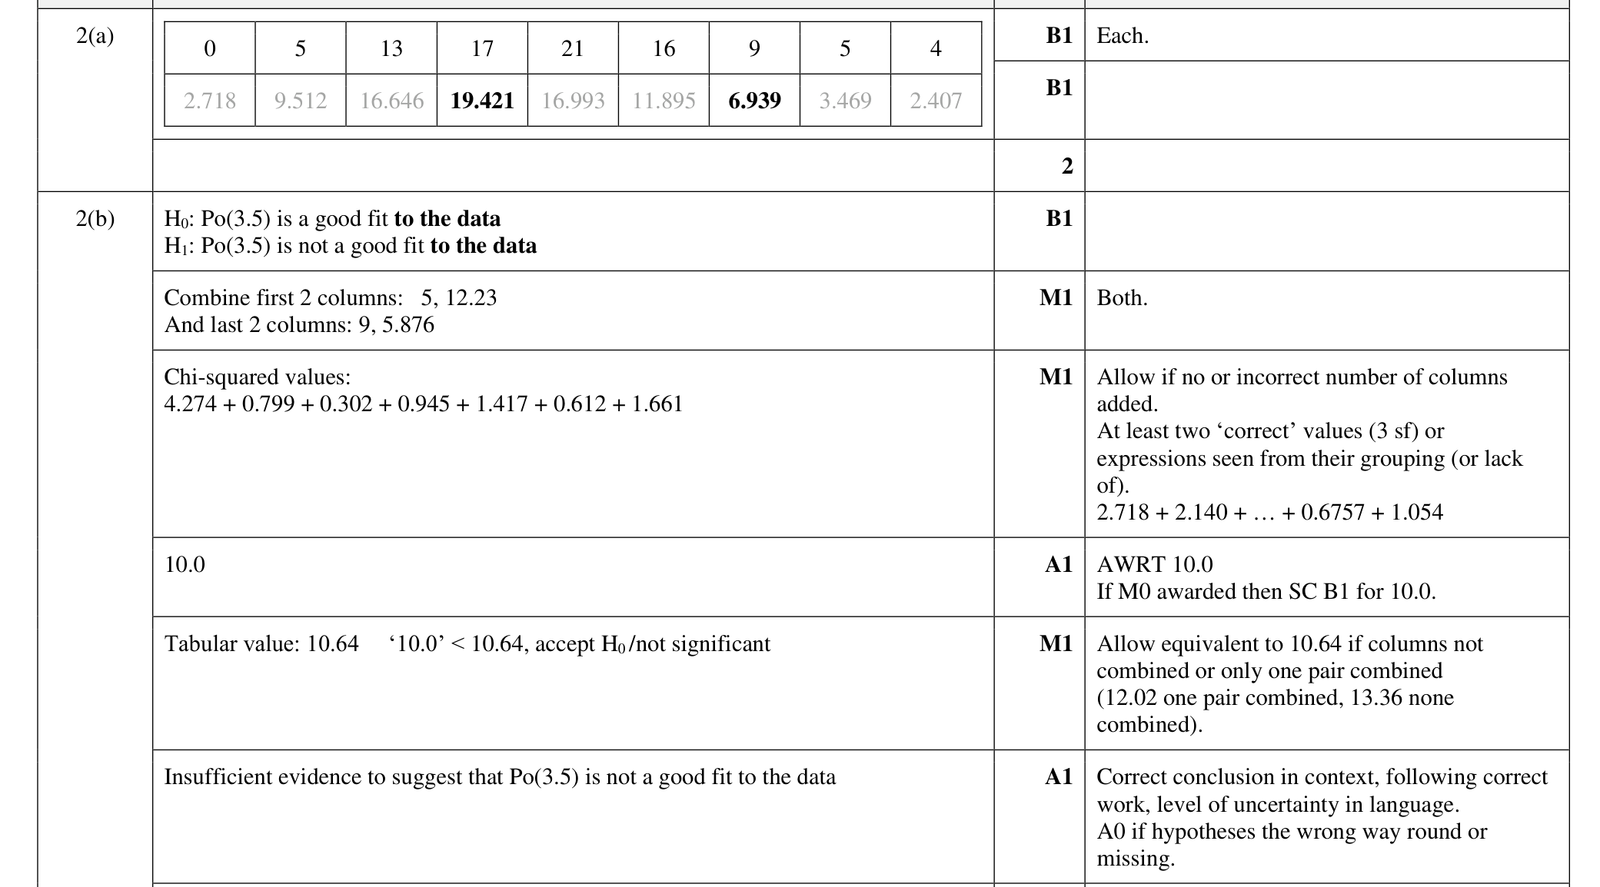
The number of breakdowns on a particular section of road is recorded each day over a period of 90 days. It is suggested that the number of breakdowns follows a Poisson distribution with mean 3.5. The data is summarised in the table, together with some of the expected frequencies resulting from the suggested Poisson distribution.
| Number of breakdowns per day | 0 | 1 | 2 | 3 | 4 | 5 | 6 | 7 | 8 or more |
|---|---|---|---|---|---|---|---|---|---|
| Observed frequency | 0 | 5 | 13 | 17 | 21 | 16 | 9 | 5 | 4 |
| Expected frequency | 2.718 | 9.512 | 16.646 | 16.993 | 11.895 | 3.469 | 2.407 |
(a) Complete the table.
(b) Carry out a goodness of fit test, at the \(10\%\) significance level, to determine whether or not \(\operatorname{Po}(3.5)\) is a good fit to the data.
9231 P41 - Jun 2022 - Q4 - 8 marks
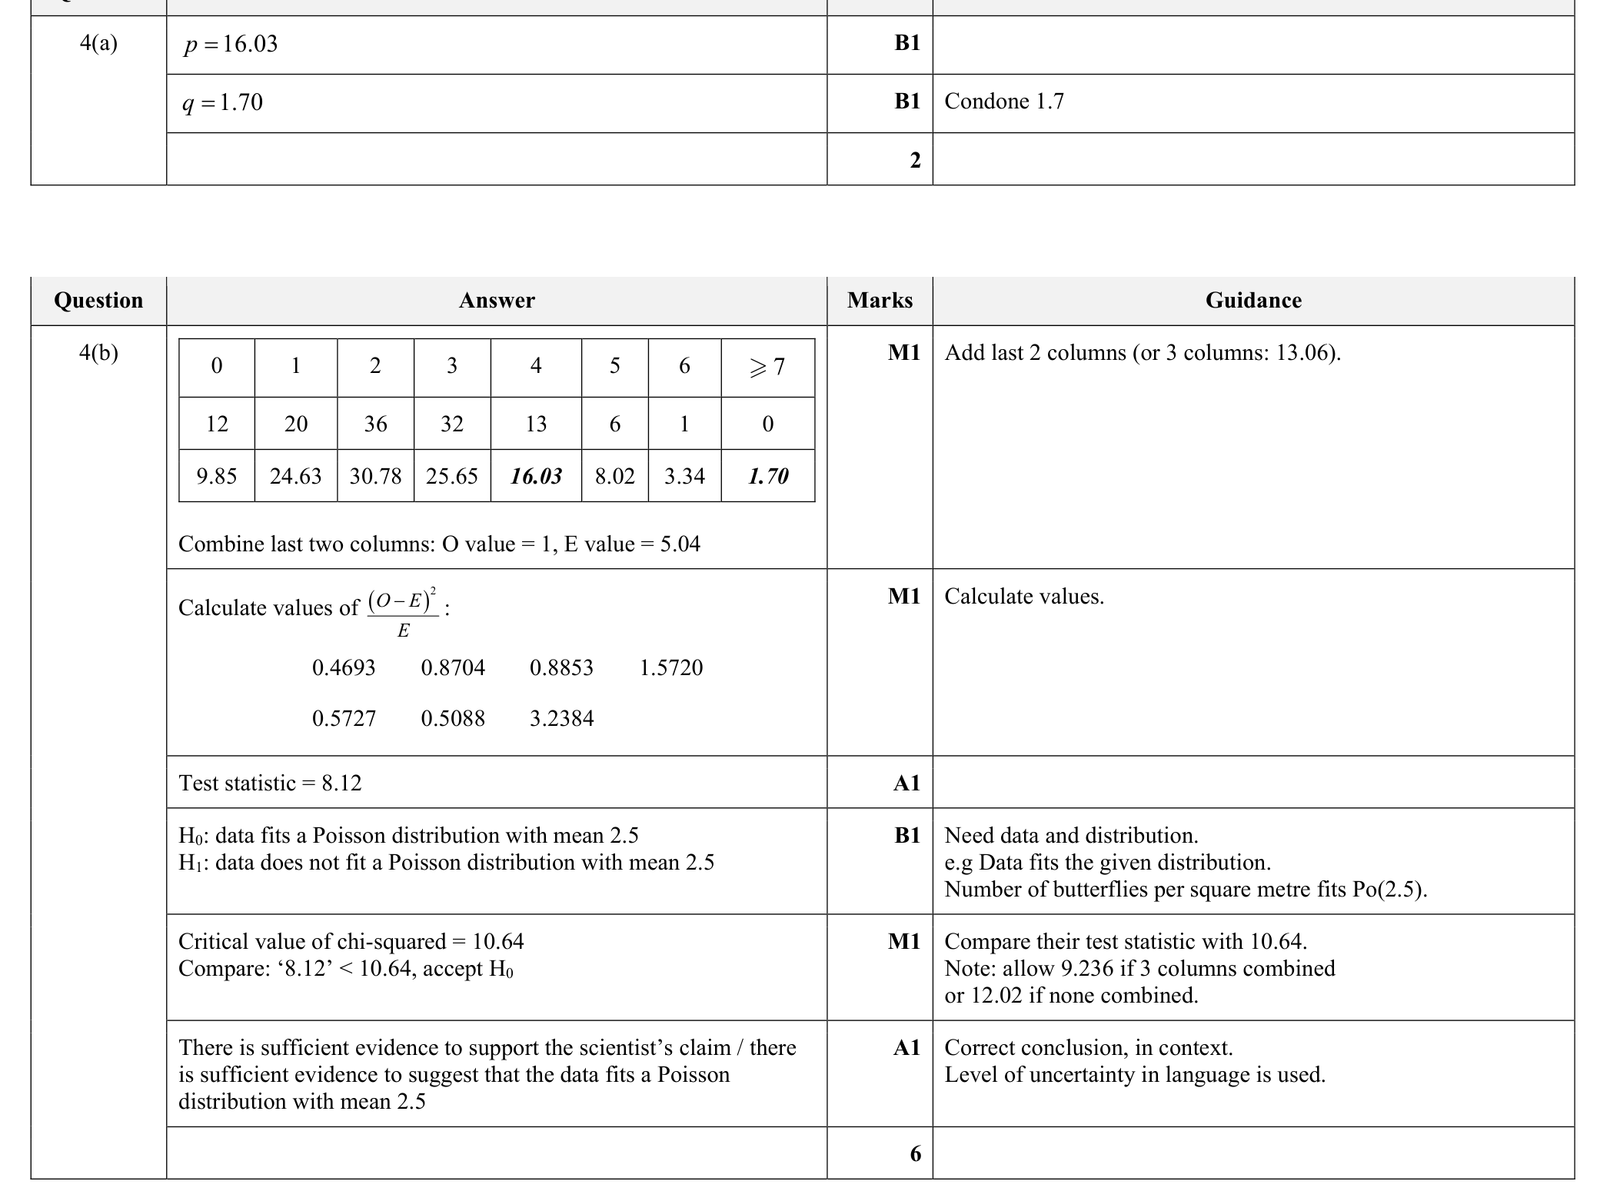
A scientist is investigating the numbers of a particular type of butterfly in a certain region. He claims that the numbers of these butterflies found per square metre can be modelled by a Poisson distribution with mean 2.5. He takes a random sample of 120 areas, each of one square metre, and counts the number of these butterflies in each of these areas. The following table shows the observed frequencies together with some of the expected frequencies using the scientist's Poisson distribution.
| Number per square metre | 0 | 1 | 2 | 3 | 4 | 5 | 6 | \(\geq 7\) |
|---|---|---|---|---|---|---|---|---|
| Observed frequency | 12 | 20 | 36 | 32 | 13 | 6 | 1 | 0 |
| Expected frequency | 9.85 | 24.63 | 30.78 | 25.65 | \(p\) | 8.02 | 3.34 | \(q\) |
(a) Find the values of \(p\) and \(q\), correct to 2 decimal places.
(b) Carry out a goodness of fit test, at the \(10\%\) significance level, to test the scientist's claim.
9231 P41 - Nov 2022 - Q2 - 8 marks
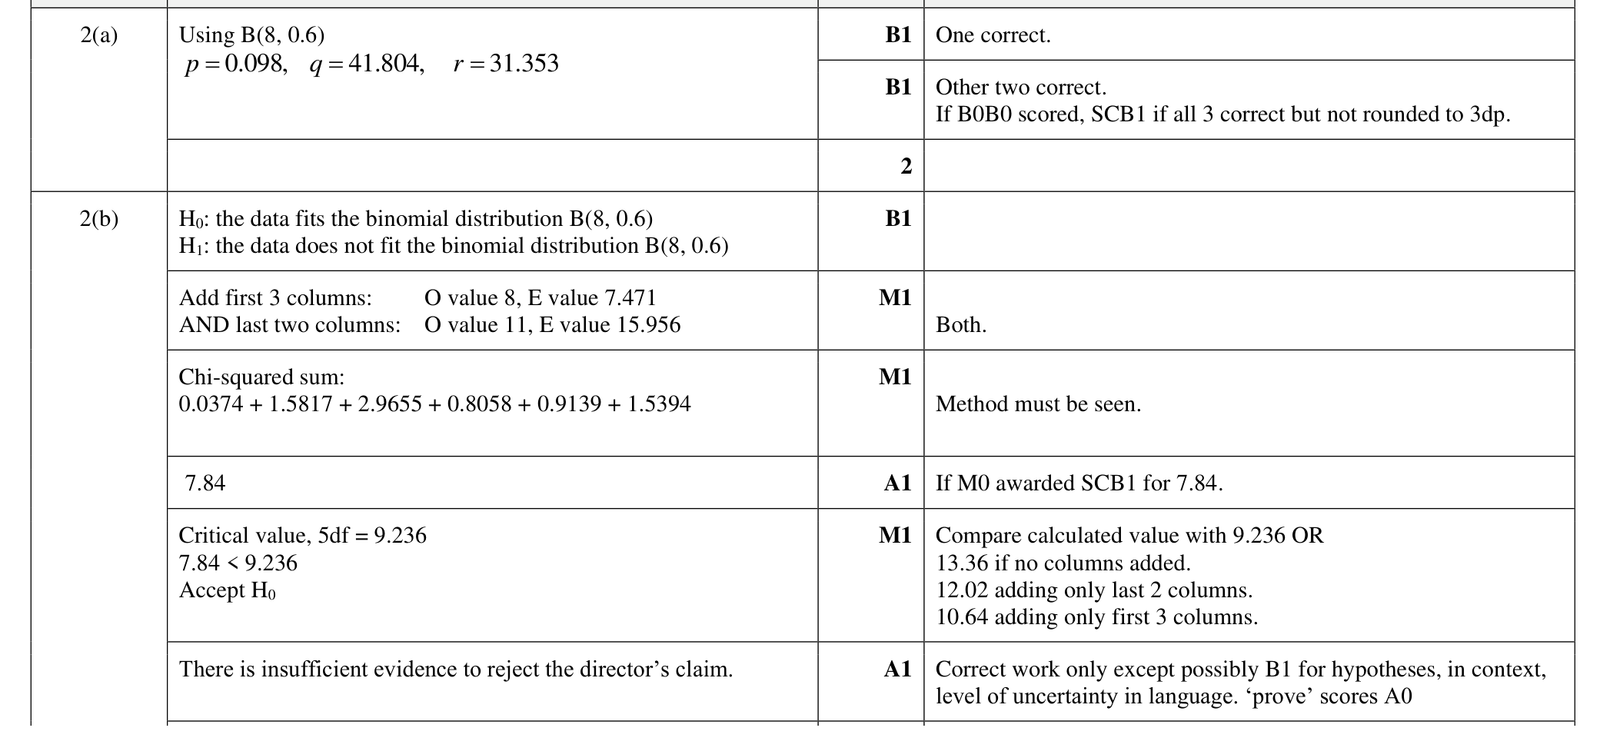
An organisation runs courses to train students to become engineers. These students are taught in groups of 8. The director of the organisation claims that on average 60% of the students in a group achieve a pass. A random sample of 150 groups of 8 students is chosen. The following table shows the observed frequencies together with some of the expected frequencies using the appropriate binomial distribution.
| Number of passes per group | 0 | 1 | 2 | 3 | 4 | 5 | 6 | 7 | 8 |
|---|---|---|---|---|---|---|---|---|---|
| Observed frequency | 0 | 0 | 8 | 24 | 45 | 36 | 26 | 10 | 1 |
| Expected frequency | \(p\) | 1.180 | 6.193 | 18.579 | 34.836 | \(q\) | \(r\) | 13.437 | 2.519 |
(a) Find the values of \(p\), \(q\) and \(r\), giving your answers correct to 3 decimal places.
(b) Carry out a goodness of fit test, at the 10% significance level, to test whether there is evidence to reject the director's claim.
9231 P43 - Jun 2021 - Q5 - 10 marks
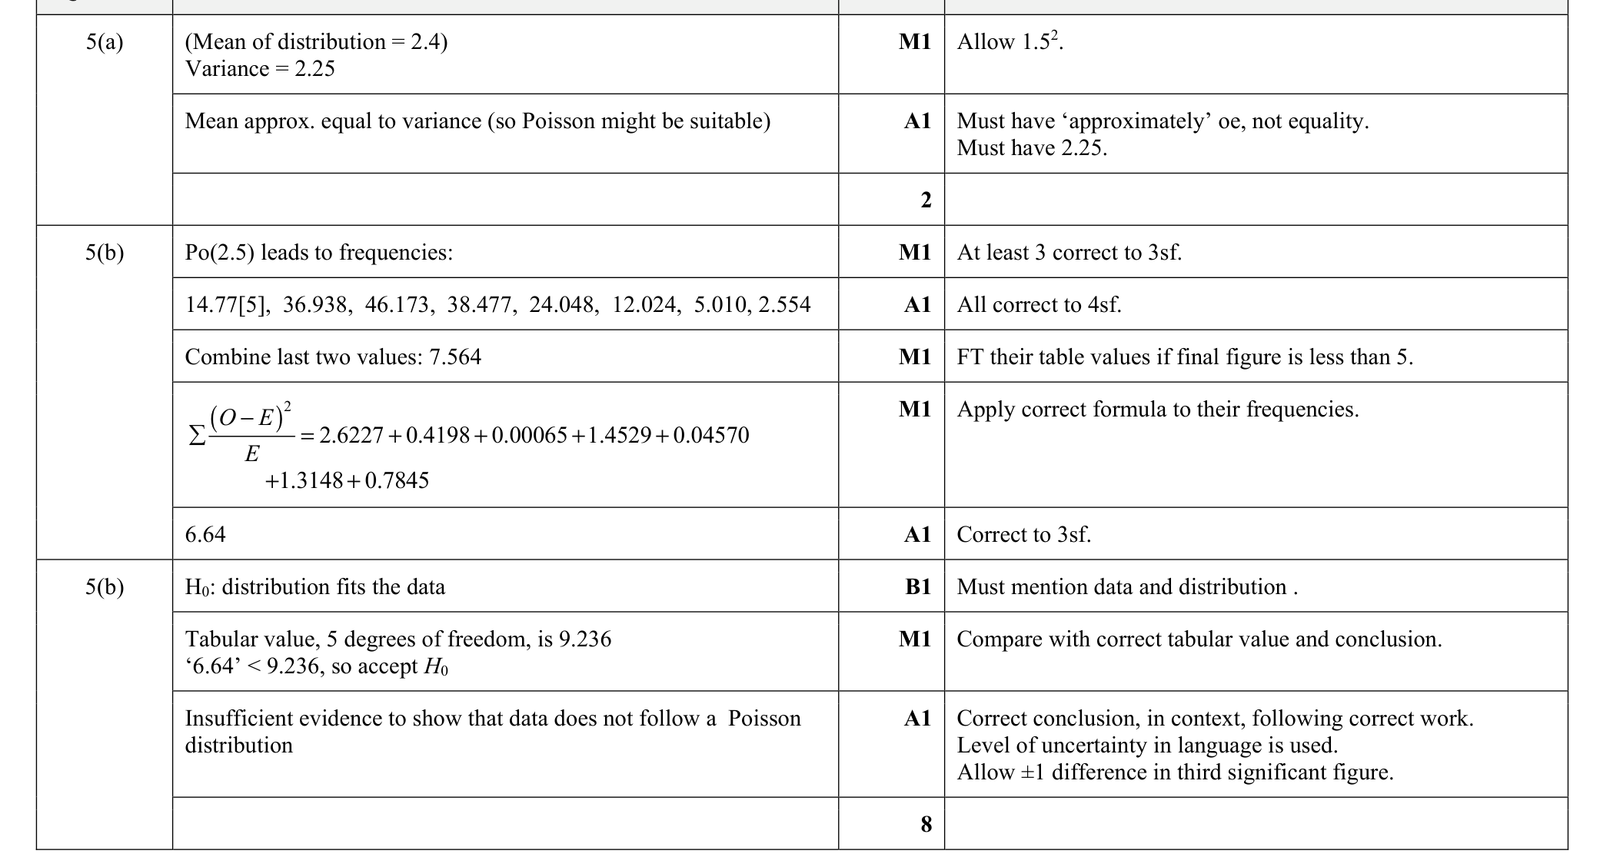
Chai packs china mugs into cardboard boxes. Chai's manager suspects that breakages occur at random times and that the number of breakages may follow a Poisson distribution. He takes a small sample of observations and finds that the number of breakages in a one-hour period has a mean of 2.4 and a standard deviation of 1.5.
(a) Explain how this information tends to support the manager's suspicion.
The manager now takes a larger sample and claims that the numbers of breakages in a one-hour period follow a Poisson distribution. The numbers of breakages in a random sample of 180 one-hour periods are summarised in the following table.
Number of breakages | 0 | 1 | 2 | 3 | 4 | 5 | 6 | 7 or more |
|---|---|---|---|---|---|---|---|---|
Frequency | 21 | 33 | 46 | 31 | 23 | 16 | 10 | 0 |
The mean number of breakages calculated from this sample is 2.5 .
(b) Use the data from this larger sample to carry out a goodness of fit test, at the \(10 \%\) significance level, to test the claim.
9231 P41 - Nov 2021 - Q3 - 8 marks
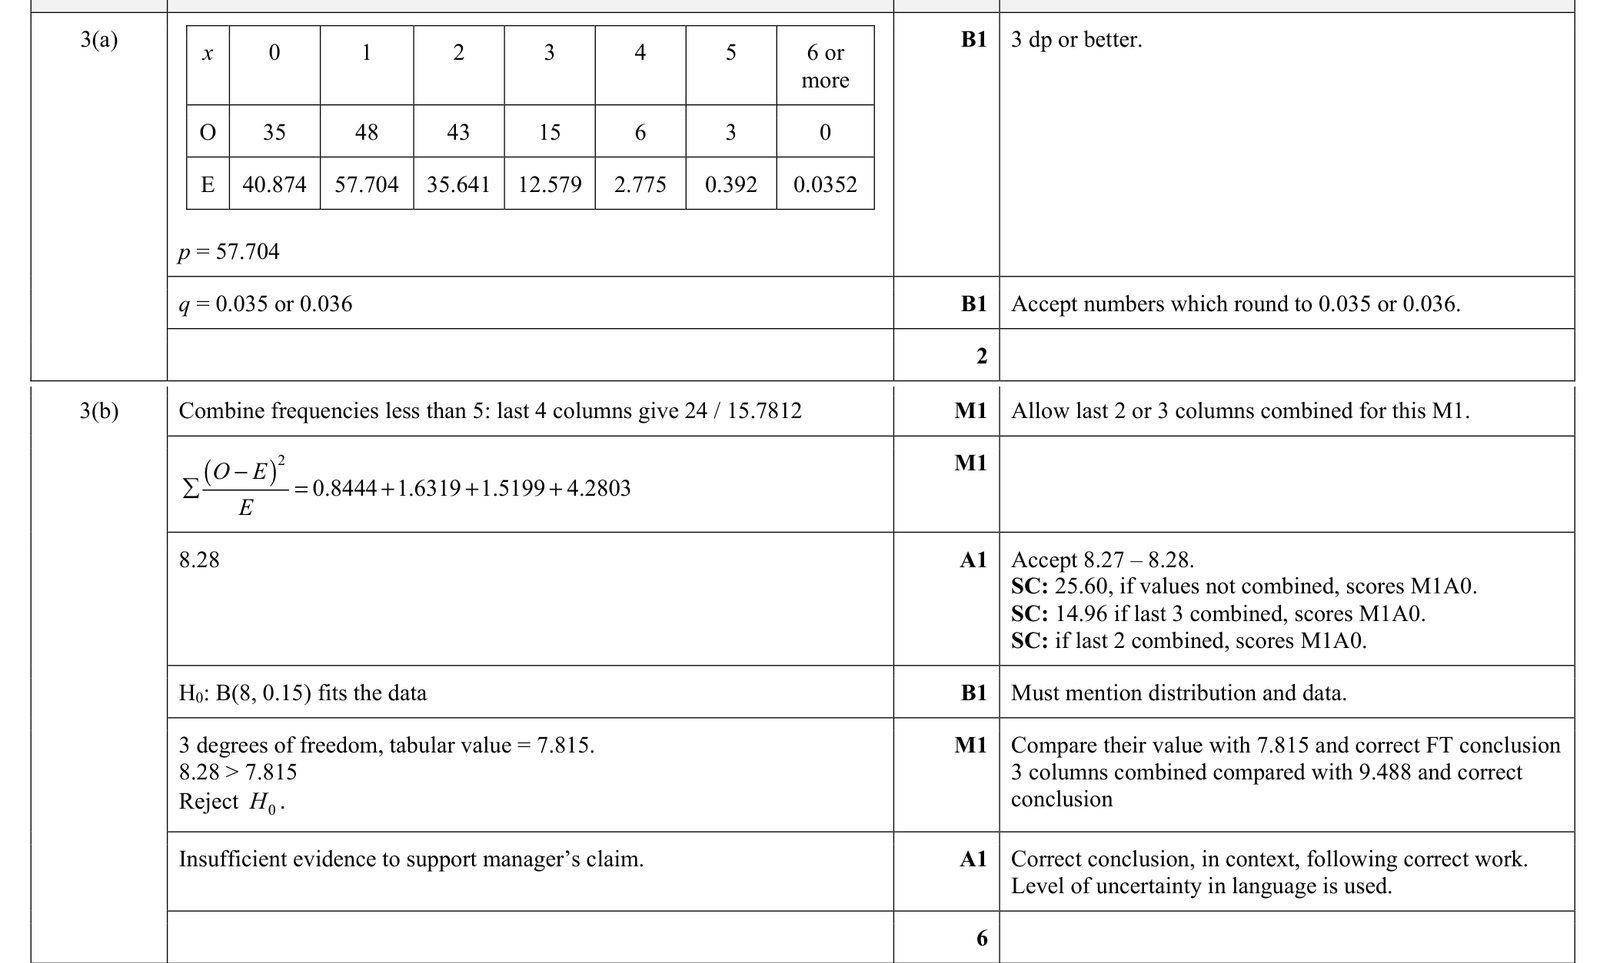
A supermarket sells pears in packs of 8. Some of the pears in a pack may not be ripe, and the supermarket manager claims that the number of unripe pears in a pack can be modelled by the distribution \(\mathrm{B}(8,0.15)\).
A random sample of 150 packs was selected and the number of unripe pears in each pack was recorded. The following table shows the observed frequencies together with some of the expected frequencies using the manager's binomial distribution.
Number of unripe pears per pack | 0 | 1 | 2 | 3 | 4 | 5 | \(\geqslant 6\) |
|---|---|---|---|---|---|---|---|
Observed frequency | 35 | 48 | 43 | 15 | 6 | 3 | 0 |
Expected frequency | 40.874 | \(p\) | 35.641 | 12.579 | 2.775 | 0.392 | \(q\) |
(a) Find the values of \(p\) and \(q\).
(b) Carry out a goodness of fit test, at the \(5 \%\) significance level, to test whether the manager's claim is justified.
9231 P41 - Nov 2020 - Q3 - 7 marks
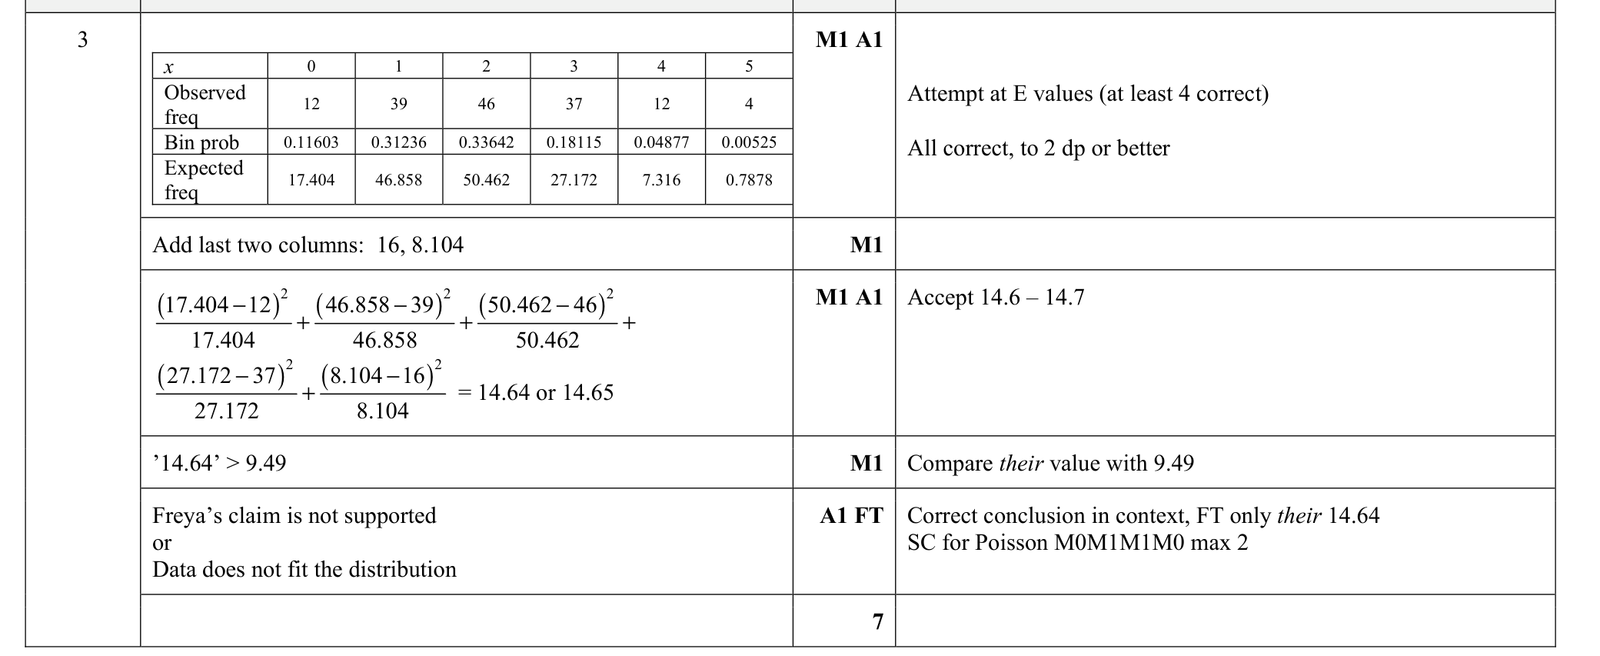
Apples are sold in bags of 5. Based on her previous experience, Freya claims that the probability of any apple weighing more than 100 grams is 0.35 , independently of other apples in the bag.
The apples in a random sample of 150 bags are checked and the number, \(x\), in each bag weighing more than 100 grams is recorded. The results are shown in the following table.
\(x\) | 0 | 1 | 2 | 3 | 4 | 5 |
|---|---|---|---|---|---|---|
Frequency | 12 | 39 | 46 | 37 | 12 | 4 |
Carry out a goodness of fit test at the \(5 \%\) significance level and hence comment on Freya's claim.
9231 P41 - Nov 2024 - Q3 - 8 marks
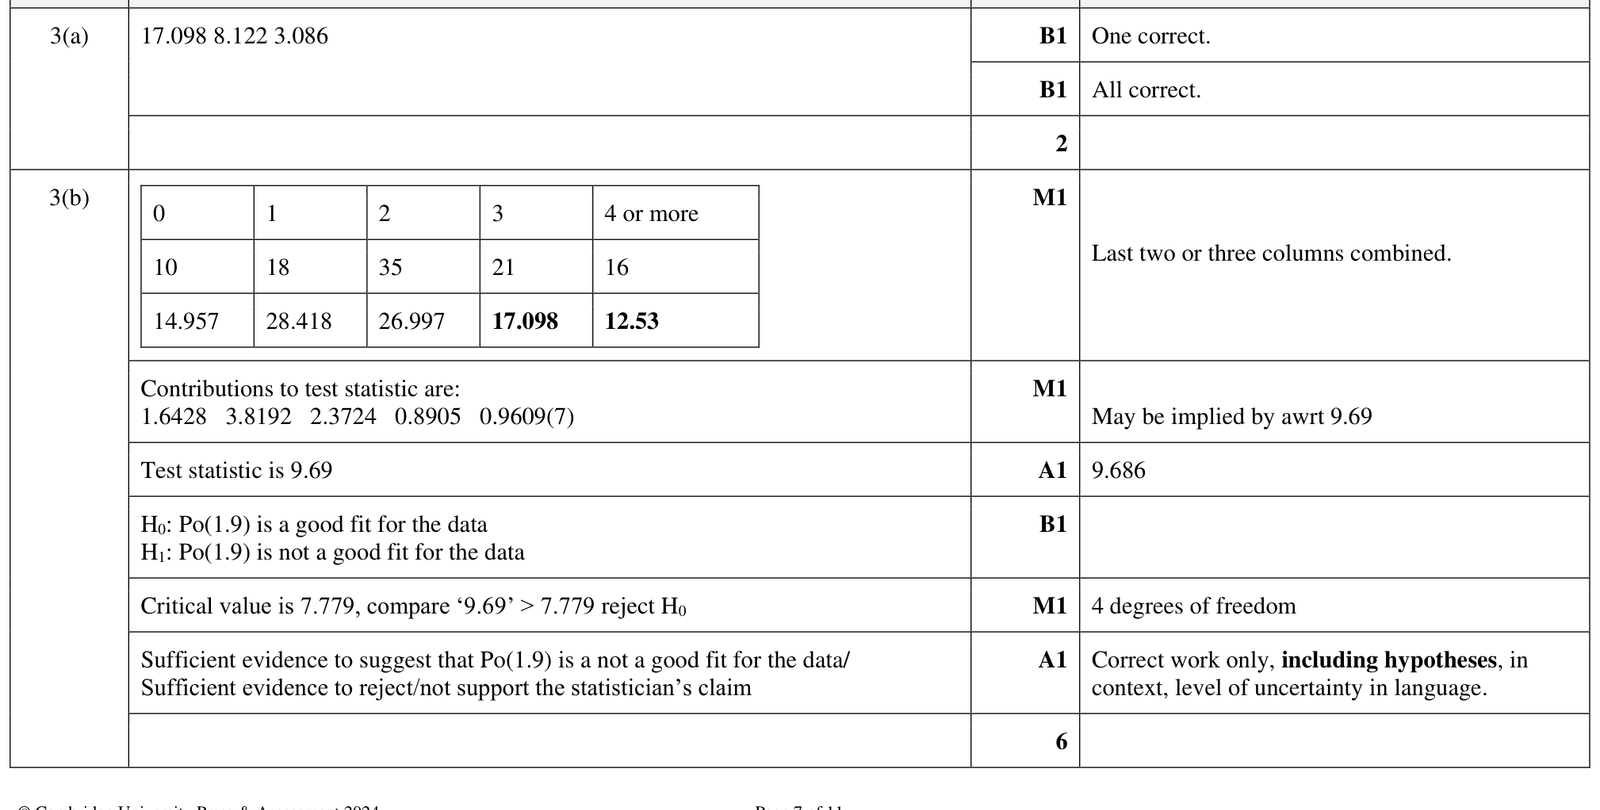
A statistician believes that the number of telephone calls received by an advice centre in a 10 -minute interval can be modelled by the Poisson distribution \(\mathrm{Po}(1.9)\). The number of calls received in a randomly chosen 10 -minute interval was recorded on each of 100 days. The results are summarised in the table, together with some of the expected frequencies corresponding to the distribution \(\operatorname{Po}(1.9)\).
(a) Complete the table.
(b) Carry out a goodness of fit test, at the \(10 \%\) significance level, to determine whether the statistician's belief is reasonable.
9231 P42 - Nov 2024 - Q3 - 10 marks
Rosie sows 5 seeds in each of 150 plant pots. The number of seeds that germinate is recorded for each pot. The results are summarised in the following table.
| 0 | 1 | 2 | 3 | 4 | 5 | ||
|---|---|---|---|---|---|---|---|---|
Number of pots | 12 | 40 | 43 | 35 | 16 | 4 | ||
Rosie suggests that the number of seeds that germinate follows the binomial distribution \(\mathrm{B}(5, p)\).
(a) Use Rosie's results to show that \(p=0.42\).
(b) Carry out a goodness of fit test, at the \(10 \%\) significance level, to test whether the distribution \(\mathrm{B}(5,0.42)\) is a good fit for the data.