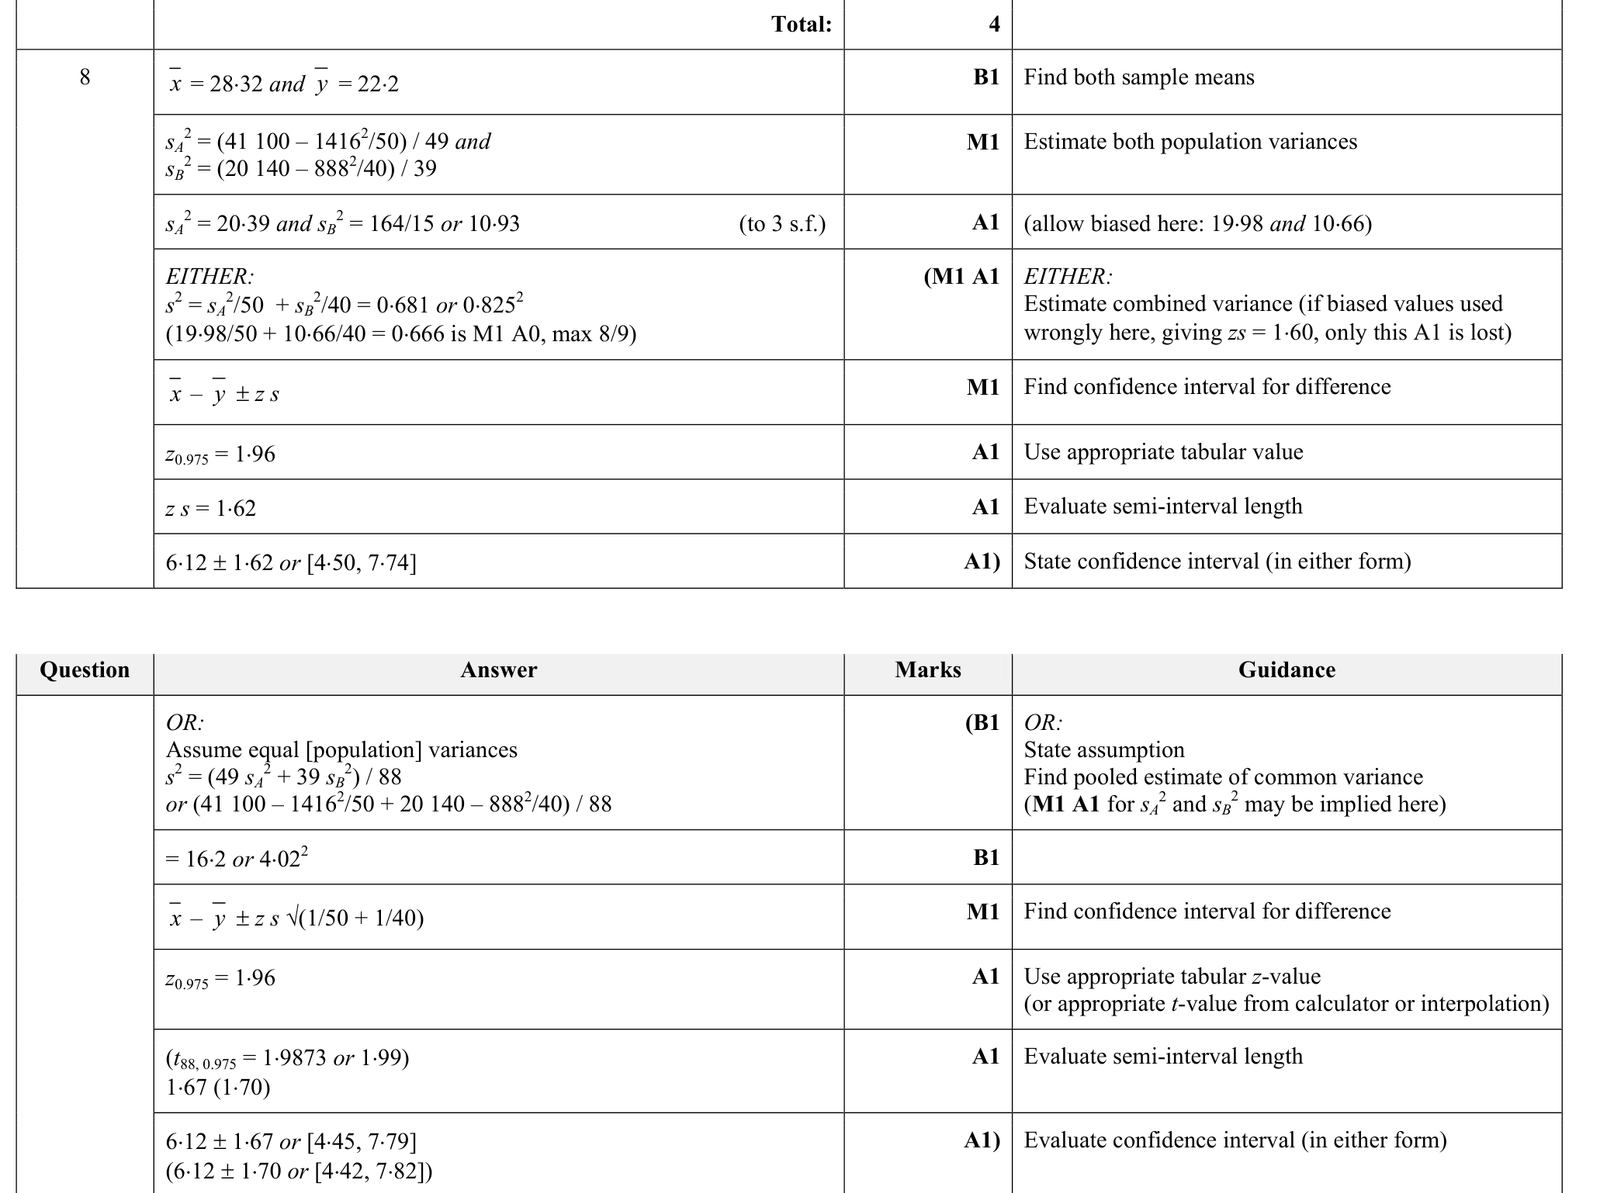
9231 P23 - Jun 2017 - Q8 - 9 marks
The number, \(x\), of beech trees was counted in each of 50 randomly chosen regions of equal size in beech forests in country \(A\). The number, \(y\), of beech trees was counted in each of 40 randomly chosen regions of the same equal size in beech forests in country \(B\). The results are summarised as follows.
\[\Sigma x=1416 \quad \Sigma x^{2}=41100 \quad \Sigma y=888 \quad \Sigma y^{2}=20140\]
Find a 95\% confidence interval for the difference between the mean number of beech trees in regions of this size in country \(A\) and in country \(B\).
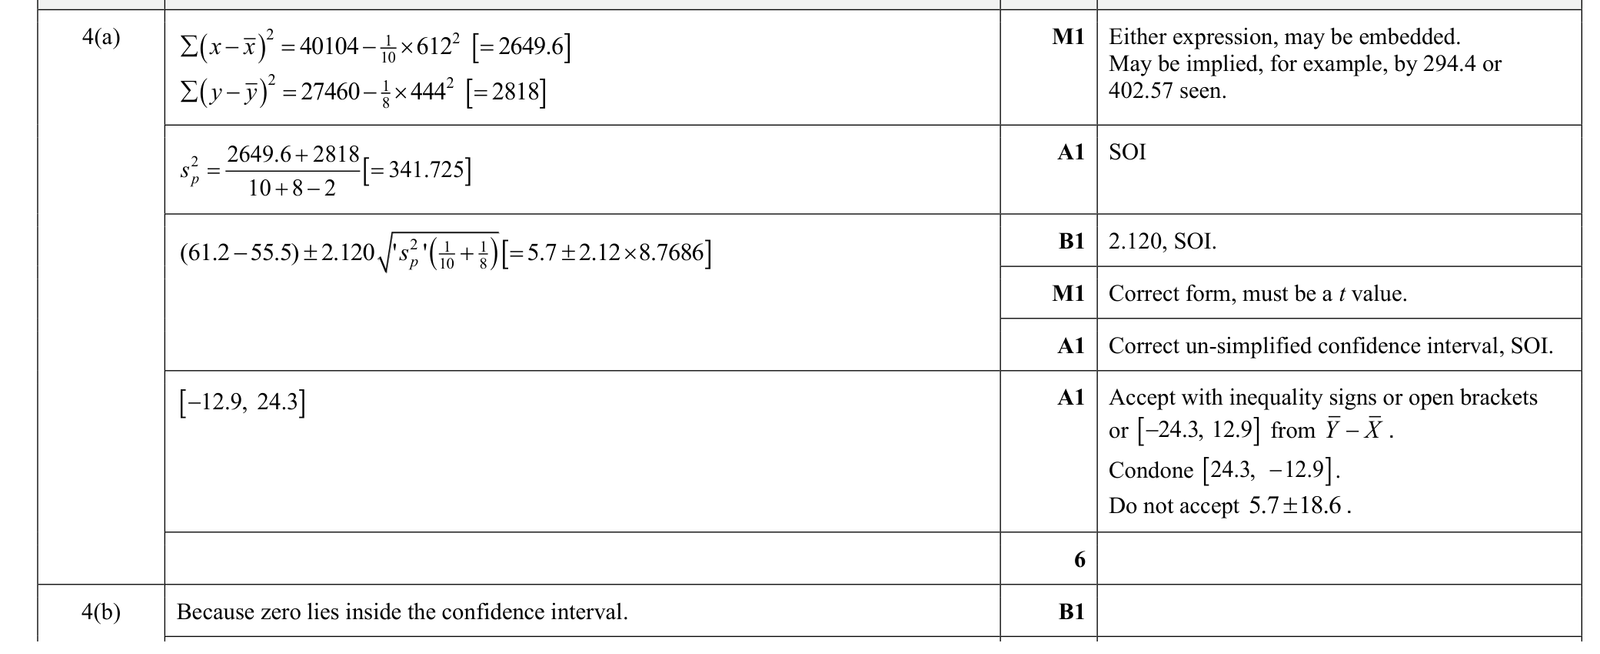
9231 P41 - Jun 2025 - Q4 - 7 marks
A researcher is interested in whether there is a difference between two schools in students' aptitude for English. She randomly chooses 10 students from school \(X\) and 8 students of a similar age from school \(Y\) to take a written English test. The scores for the students from school \(X(x)\) and school \(Y(y)\) are summarised as follows.
\(\sum x=612 \quad \sum x^{2}=40104 \quad \sum y=444 \quad \sum y^{2}=27460\)
You should assume that the two distributions are normal and have the same population variance.
(a) Find a 95\% confidence interval for the difference in the mean scores for students from school \(X\) and students from school \(Y\) in the written English test.
(b) Use the confidence interval you found in part (a) to explain why there is insufficient evidence at a 5\% significance level to suggest that the English scores of students from school \(X\) and students from school \(Y\) are different.
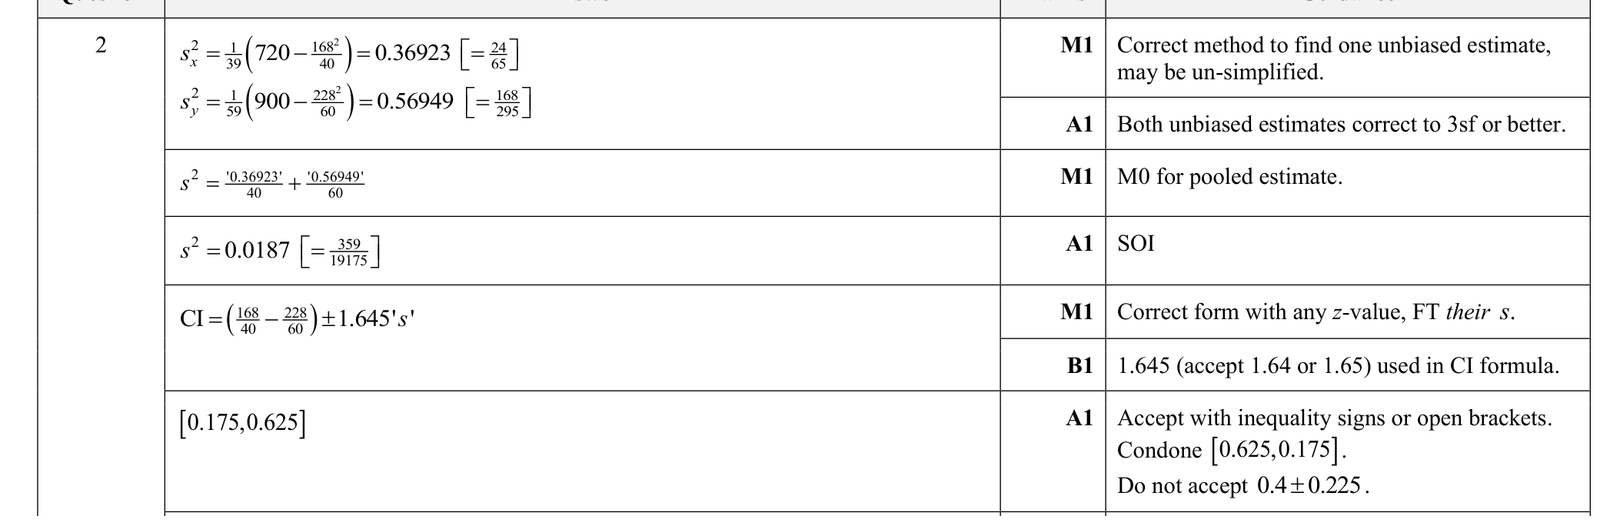
9231 P43 - Jun 2025 - Q2 - 7 marks
A farmer is investigating whether using a new fertiliser will increase the yield of tomato plants. The farmer selects 40 tomato plants at random and gives them the new fertiliser. The crop mass, \(x \mathrm{~kg}\), of each of these 40 plants is recorded. The farmer selects a further 60 tomato plants at random and gives them a standard fertiliser. The crop mass, \(y \mathrm{~kg}\), of each of these 60 plants is recorded. The results are summarised as follows.
\(\sum x=168 \quad \sum x^{2}=720 \quad \sum y=228 \quad \sum y^{2}=900\)
Find a \(90 \%\) confidence interval for the difference in mean crop mass associated with each type of fertiliser.
9231 P43 - Jun 2024 - Q6 - 10 marks
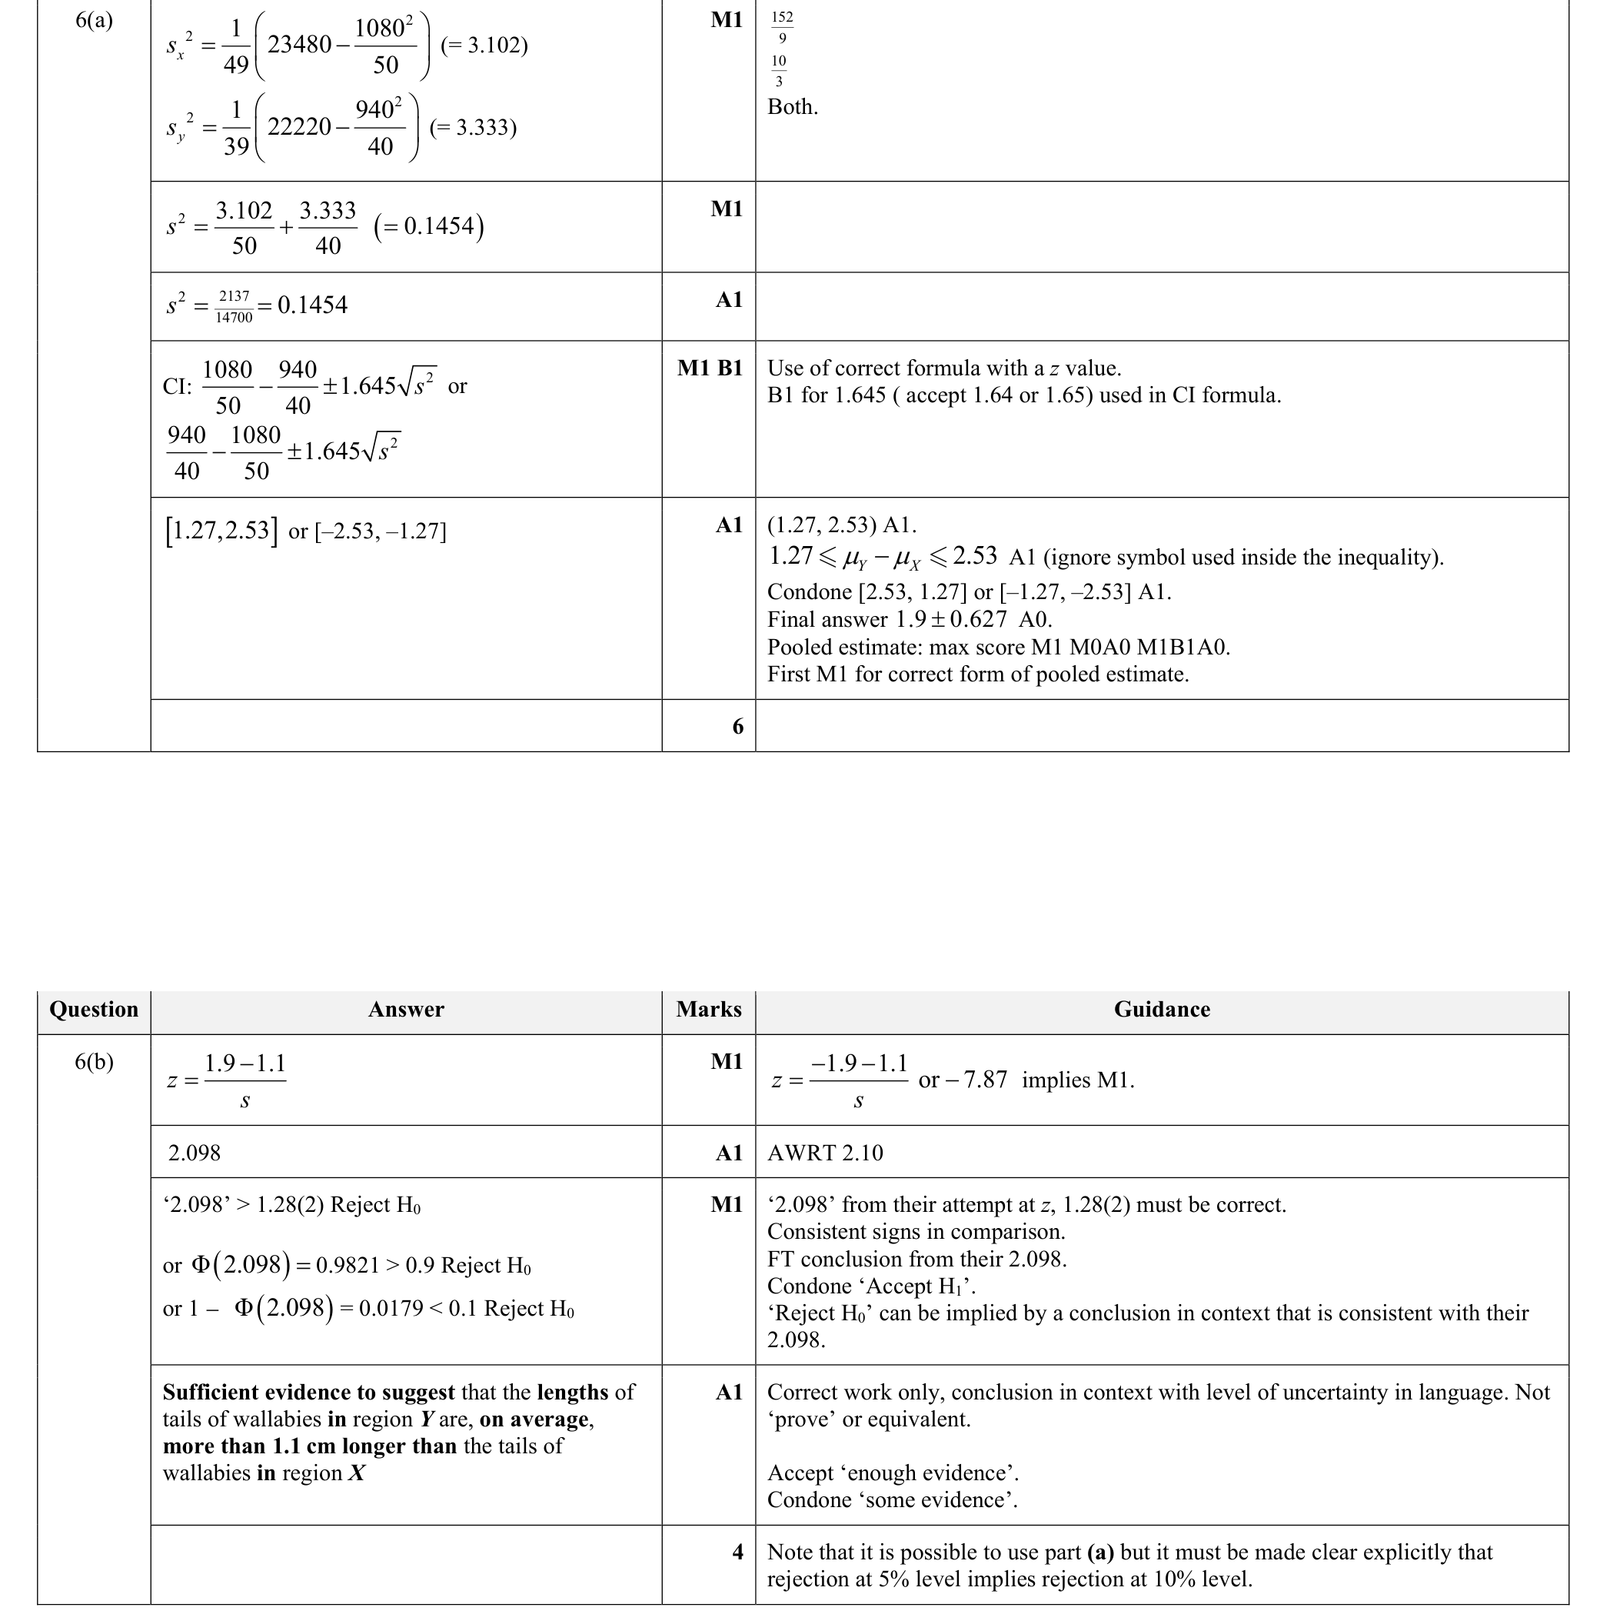
Seva is investigating the lengths of the tails of adult wallabies in two regions of Australia, \(X\) and \(Y\). He chooses a random sample of 50 adult wallabies from region \(X\) and records the lengths, \(x \mathrm{~cm}\), of their tails. He also chooses a random sample of 40 adult wallabies from region \(Y\) and records the lengths, \(y \mathrm{~cm}\), of their tails. His results are summarised as follows.
\(\sum x=1080 \quad \sum x^{2}=23480 \quad \sum y=940 \quad \sum y^{2}=22220\)
It cannot be assumed that the population variances of the two distributions are the same.
(a) Find a \(90 \%\) confidence interval for the difference between the population mean lengths of the tails of adult wallabies in regions \(X\) and \(Y\).
The population mean lengths of the tails of adult wallabies in regions \(X\) and \(Y\) are \(\mu_{X} \mathrm{~cm}\) and \(\mu_{Y} \mathrm{~cm}\) respectively.
(b) Test, at the \(10 \%\) significance level, the null hypothesis \(\mu_{Y}-\mu_{X}=1.1\) against the alternative hypothesis \(\mu_{Y}-\mu_{X}\gt 1.1\). State your conclusion in the context of the question.
9231 P42 - Nov 2023 - Q1 - 6 marks
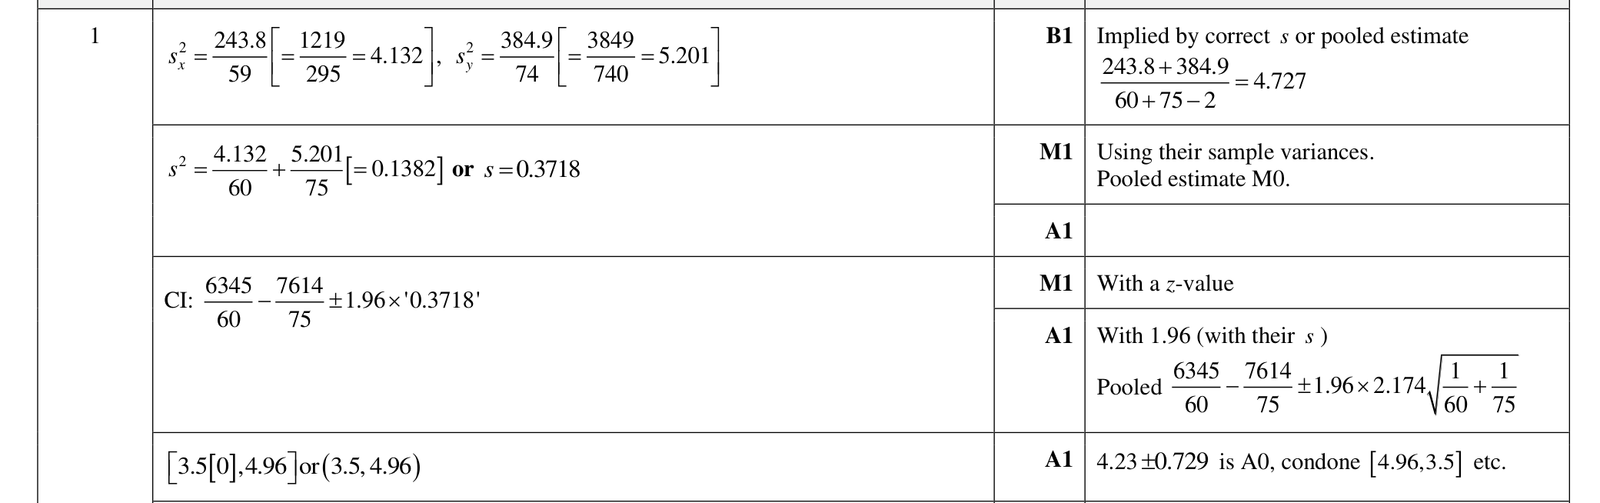
A factory produces small bottles of natural spring water. Two different machines, \(X\) and \(Y\), are used to fill empty bottles with the water. A quality control engineer checks the volumes of water in the bottles filled by each of the machines. He chooses a random sample of 60 bottles filled by machine \(X\) and a random sample of 75 bottles filled by machine \(Y\). The volumes of water, \(x\) and \(y\) respectively, in millilitres, are summarised as follows.
\(\sum x=6345 \quad \sum(x-\bar{x})^{2}=243.8 \quad \sum y=7614 \quad \sum(y-\bar{y})^{2}=384.9\)
\(\bar{x}\) and \(\bar{y}\) are the sample means of the volume of water in the bottles filled by machines \(X\) and \(Y\) respectively.
Find a \(95 \%\) confidence interval for the difference between the mean volume of water in bottles filled by machine \(X\) and the mean volume of water in bottles filled by machine \(Y\).
9231 P41 - Nov 2022 - Q1 - 7 marks
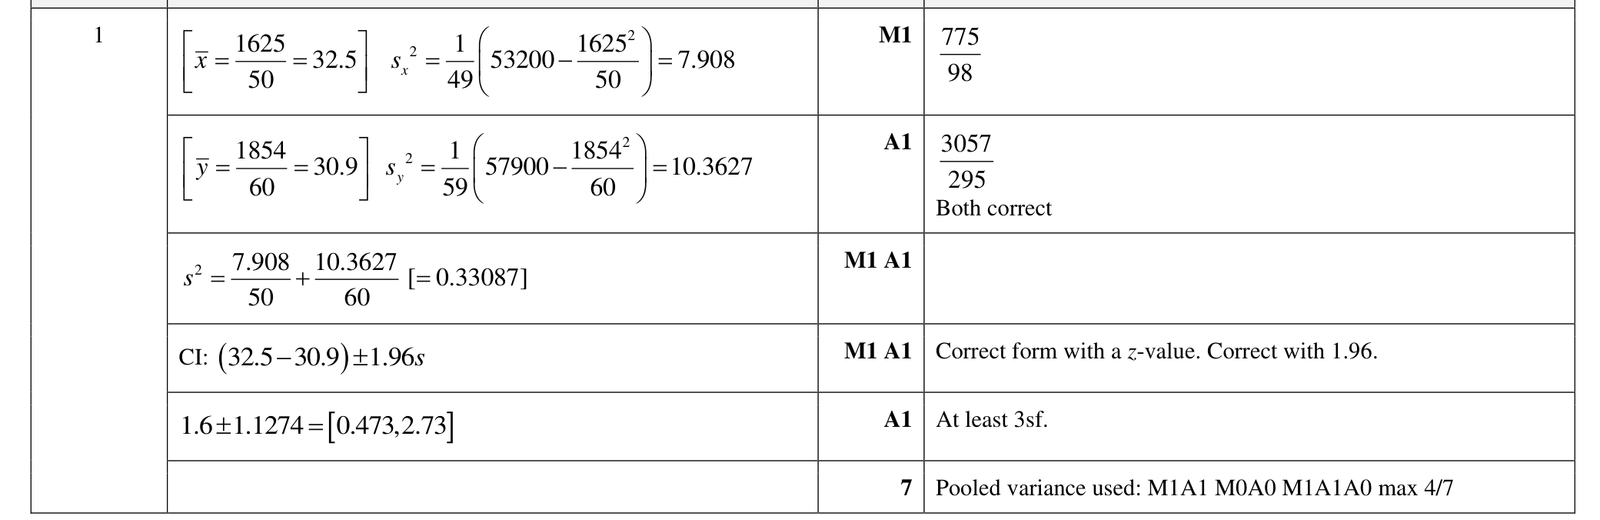
A scientist is investigating the heights of pine trees in two regions, \(A\) and \(B\). She takes a random sample of 50 pine trees in region \(A\) and records their heights, \(x\) m. She takes a random sample of 60 pine trees in region \(B\) and records their heights, \(y\) m. Her results are summarised as follows.
\(\sum x=1625 \quad \sum x^{2}=53200 \quad \sum y=1854 \quad \sum y^{2}=57900\)
Find a 95% confidence interval for the difference between the population mean heights of pine trees in regions \(A\) and \(B\).
9231 P43 - Jun 2021 - Q3 - 8 marks
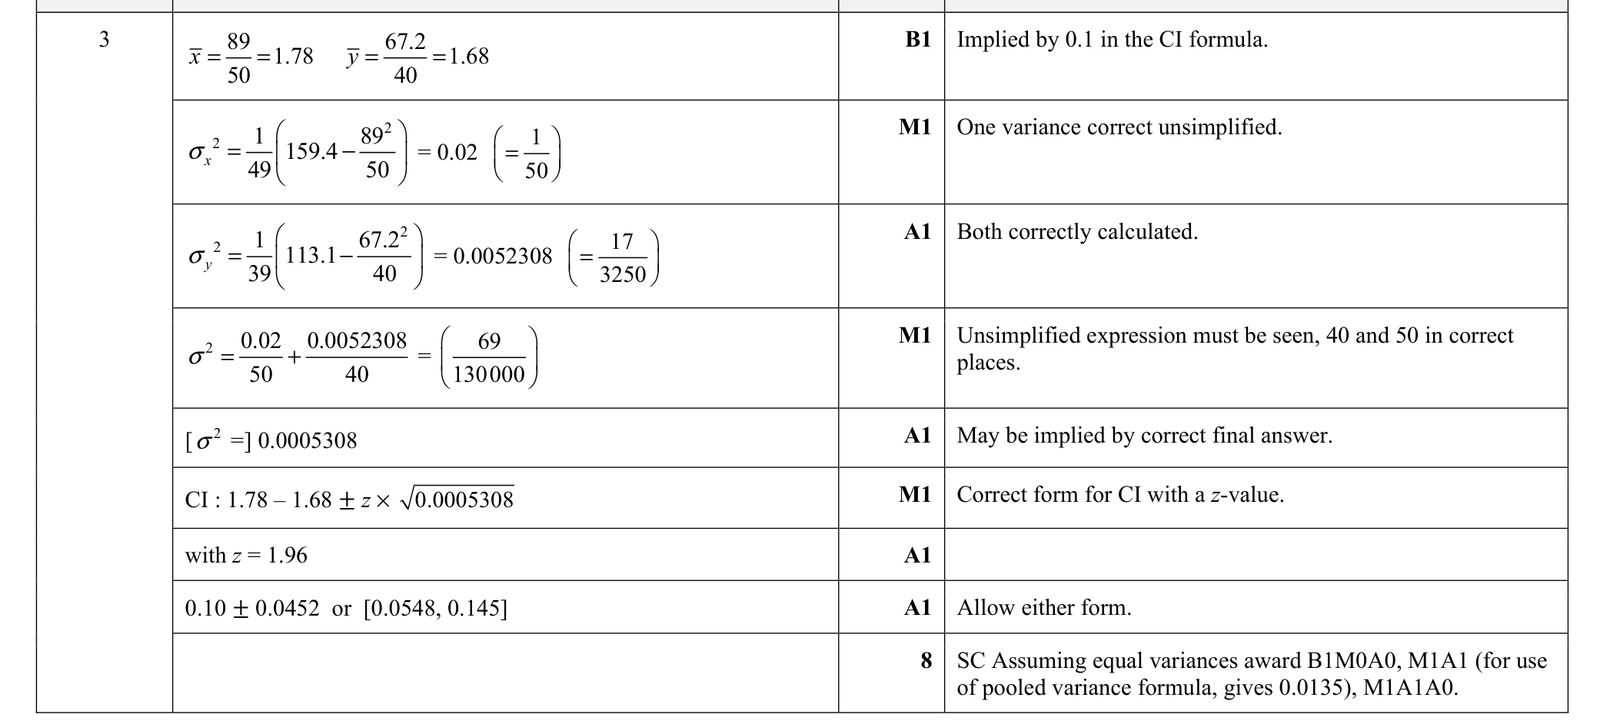
The heights, \(x \mathrm{~m}\), of a random sample of 50 adult males from country \(A\) were recorded. The heights, \(y \mathrm{~m}\), of a random sample of 40 adult males from country \(B\) were also recorded. The results are summarised as follows.
\(\sum x=89.0 \quad \sum x^{2}=159.4 \quad \sum y=67.2 \quad \sum y^{2}=113.1\)
Find a \(95 \%\) confidence interval for the difference between the mean heights of adult males from country \(A\) and adult males from country \(B\).
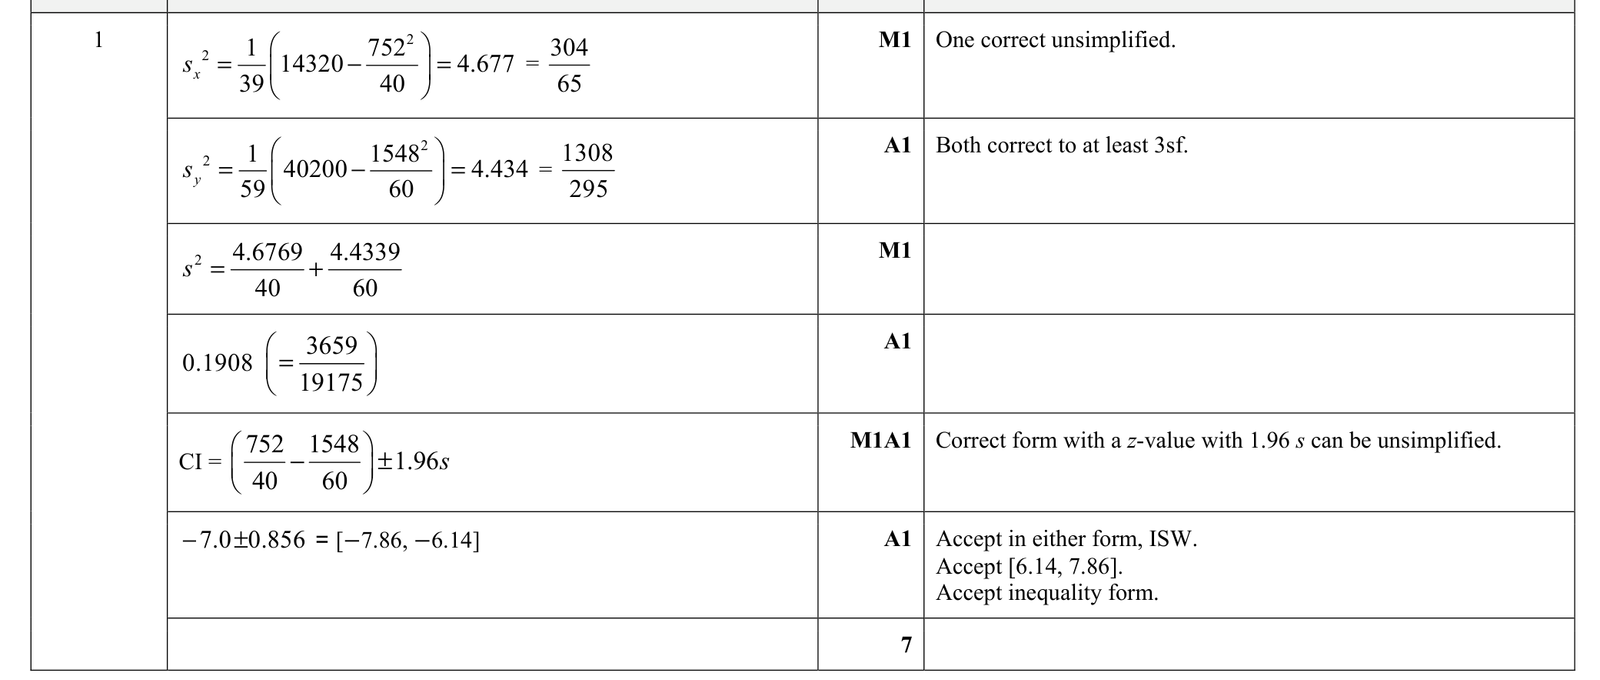
9231 P42 - Nov 2021 - Q1 - 7 marks
The number, \(x\), of pine trees was counted in each of 40 randomly chosen regions of equal size in country \(A\). The number, \(y\), of pine trees was counted in each of 60 randomly chosen regions of the same equal size in country \(B\). The results are summarised as follows.
\(\sum x=752 \quad \sum x^{2}=14320 \quad \sum y=1548 \quad \sum y^{2}=40200\)
Find a \(95 \%\) confidence interval for the difference between the mean number of pine trees in regions of this size in countries \(A\) and \(B\).
9231 P43 - Jun 2020 - Q2 - 5 marks
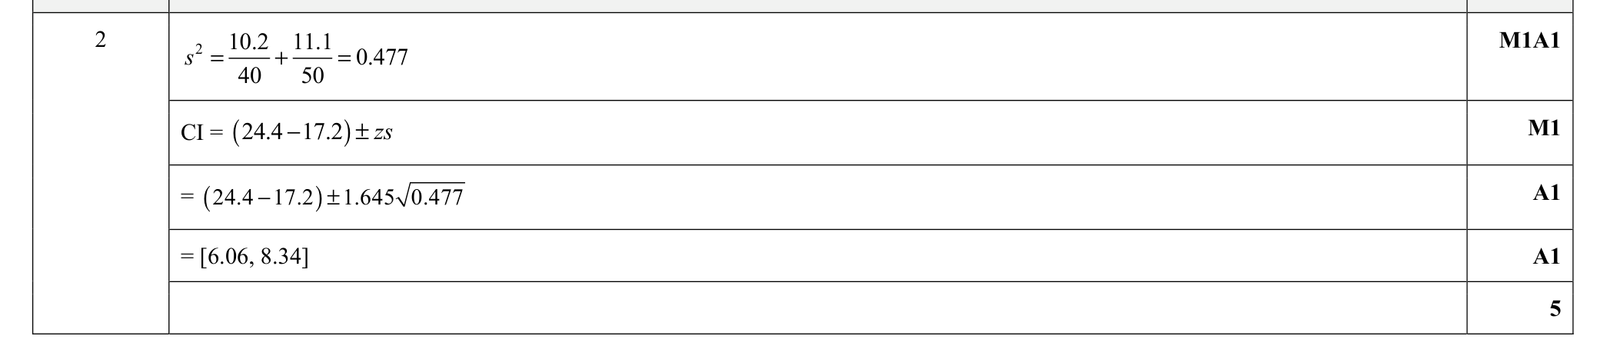
A random sample of 40 observations of a random variable \(X\) and a random sample of 50 observations of a random variable \(Y\) are taken. The resulting values for the sample means, \(\bar{x}\) and \(\bar{y}\), and the unbiased estimates, \(s_{x}^{2}\) and \(s_{y}^{2}\), for the population variances are as follows.
\(\bar{x}=24.4 \quad \bar{y}=17.2 \quad s_{x}^{2}=10.2 \quad s_{y}^{2}=11.1\)
Find a \(90 \%\) confidence interval for the difference between the population means of \(X\) and \(Y\).
9231 P41 - Nov 2020 - Q1 - 7 marks
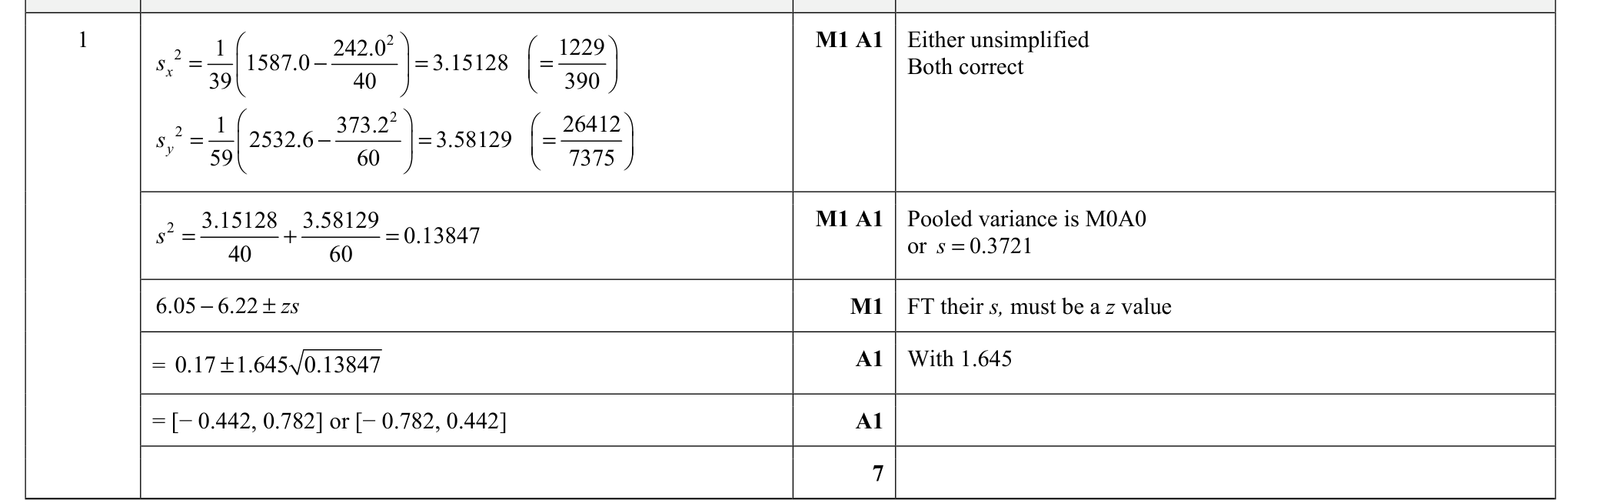
Kayla is investigating the lengths of the leaves of a certain type of tree found in two forests \(X\) and \(Y\). She chooses a random sample of 40 leaves of this type from forest \(X\) and records their lengths, \(x \mathrm{~cm}\). She also records the lengths, \(y \mathrm{~cm}\), for a random sample of 60 leaves of this type from forest \(Y\). Her results are summarised as follows.
\(\sum x=242.0 \quad \sum x^{2}=1587.0 \quad \sum y=373.2 \quad \sum y^{2}=2532.6\)
Find a \(90 \%\) confidence interval for the difference between the population mean lengths of leaves in forests \(X\) and \(Y\).
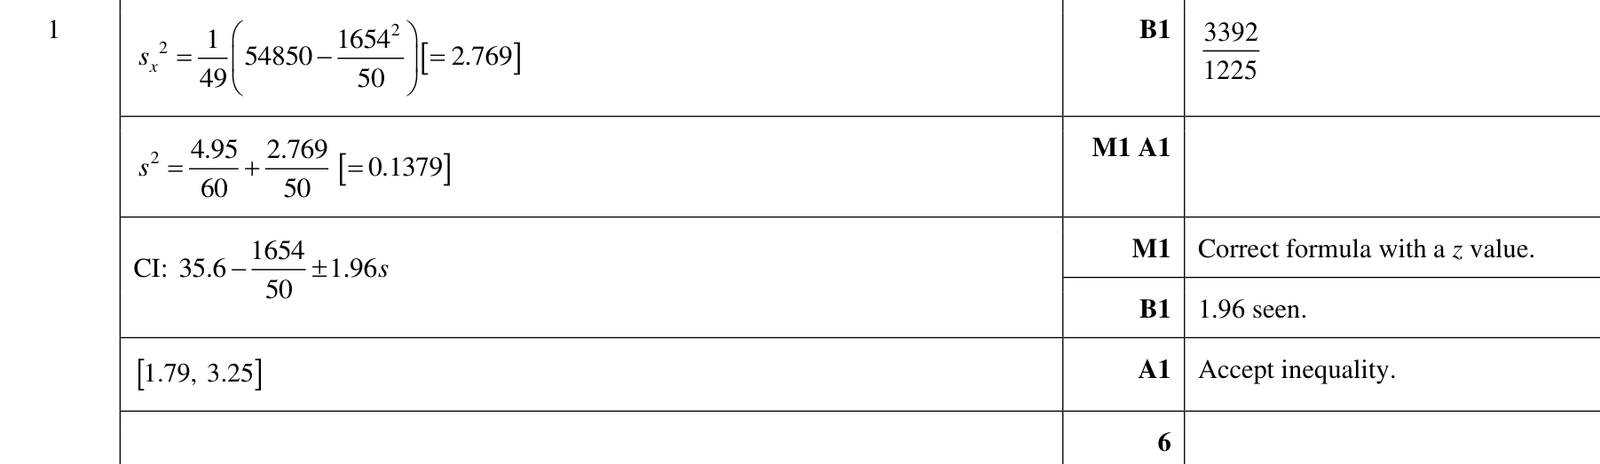
9231 P41 - Nov 2024 - Q1 - 6 marks
Ellie is investigating the heights of two types of beech tree, \(A\) and \(B\), in a certain region. She has chosen a random sample of 60 beech trees of type \(A\) in the region, recorded their heights, \(x \mathrm{~m}\), and calculated unbiased estimates for the population mean and population variance as 35.6 m and \(4.95 \mathrm{~m}^{2}\) respectively.
Ellie also chooses a random sample of 50 beech trees of type \(B\) in the region and records their heights, \(y \mathrm{~m}\). Her results are summarised as follows.
\(\sum y=1654 \quad \sum y^{2}=54850\)
Find a \(95 \%\) confidence interval for the difference between the population mean heights of type \(A\) and type \(B\) beech trees in the region.