9231 P21 - Nov 2018 - Q8 - 9 marks
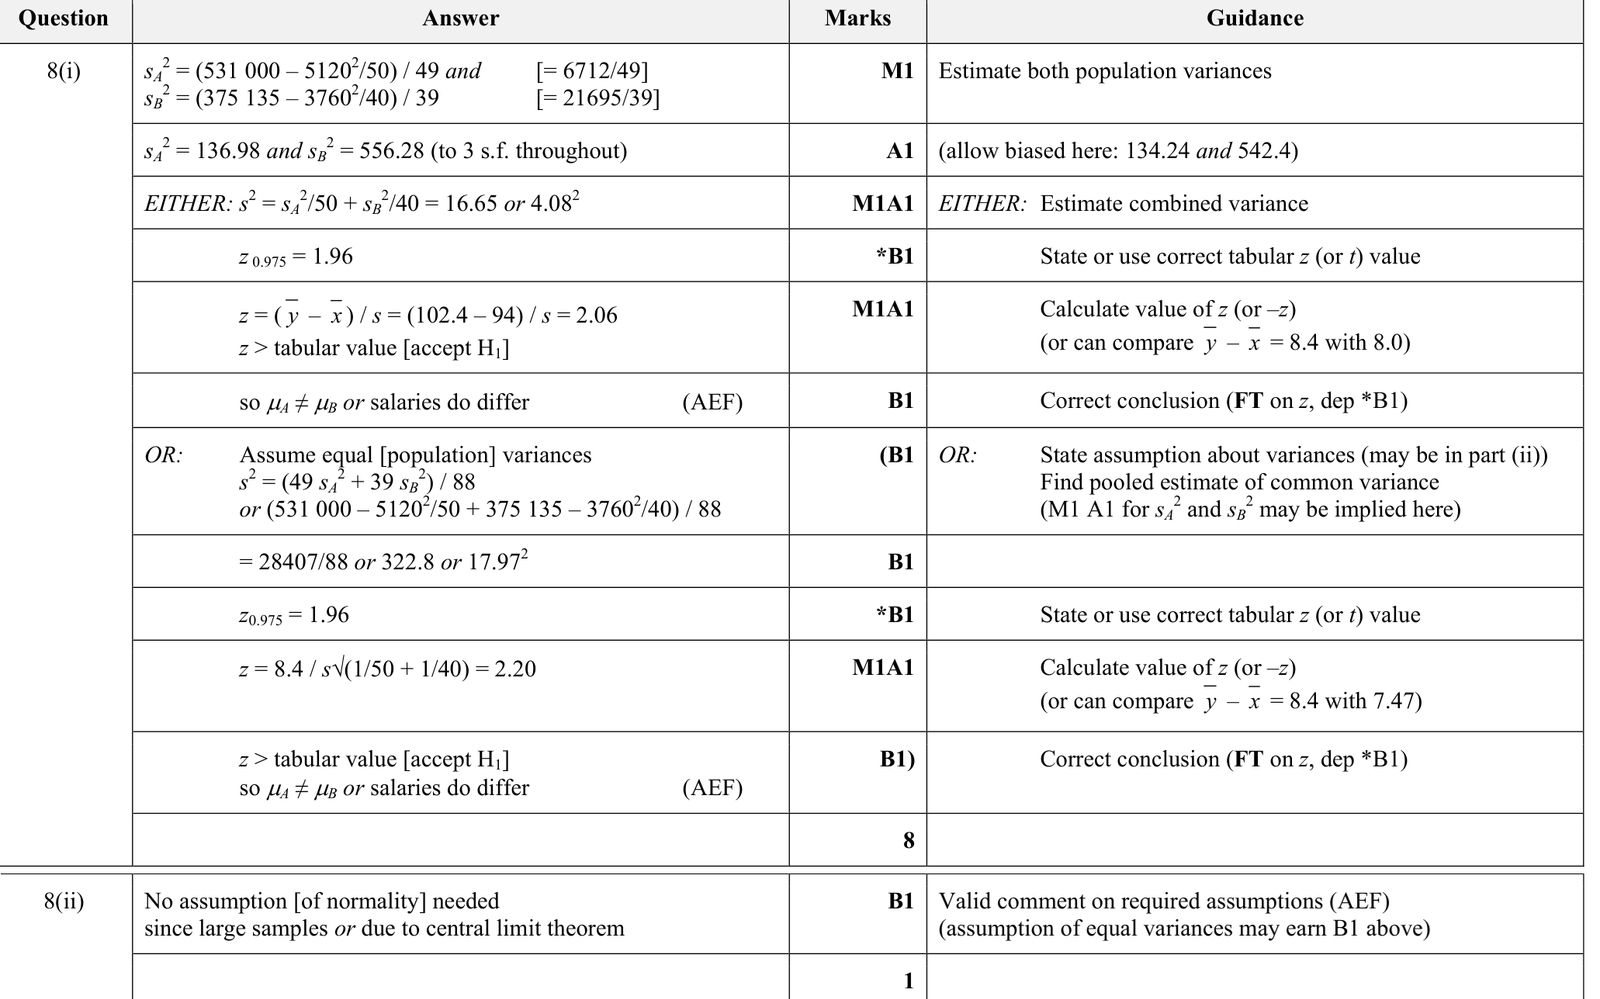
The weekly salaries of employees at two large electronics companies, \(A\) and \(B\), are being compared. The weekly salaries of an employee from company \(A\) and an employee from company \(B\) are denoted by \(\$ x\) and \(\$ y\) respectively. A random sample of 50 employees from company \(A\) and a random sample of 40 employees from company \(B\) give the following summarised data.
\[\Sigma x=5120 \quad \Sigma x^{2}=531000 \quad \Sigma y=3760 \quad \Sigma y^{2}=375135\]
(i) The population mean salaries of employees from companies \(A\) and \(B\) are denoted by \(\$ \mu_{A}\) and \(\$ \mu_{B}\) respectively. Using a \(5 \%\) significance level, test the null hypothesis \(\mu_{A}=\mu_{B}\) against the alternative hypothesis \(\mu_{A} \neq \mu_{B}\).
(ii) State, with a reason, whether any assumptions about the distributions of employees' salaries are needed for the test in part (i).
9231 P21 - Nov 2019 - Q8 - 9 marks
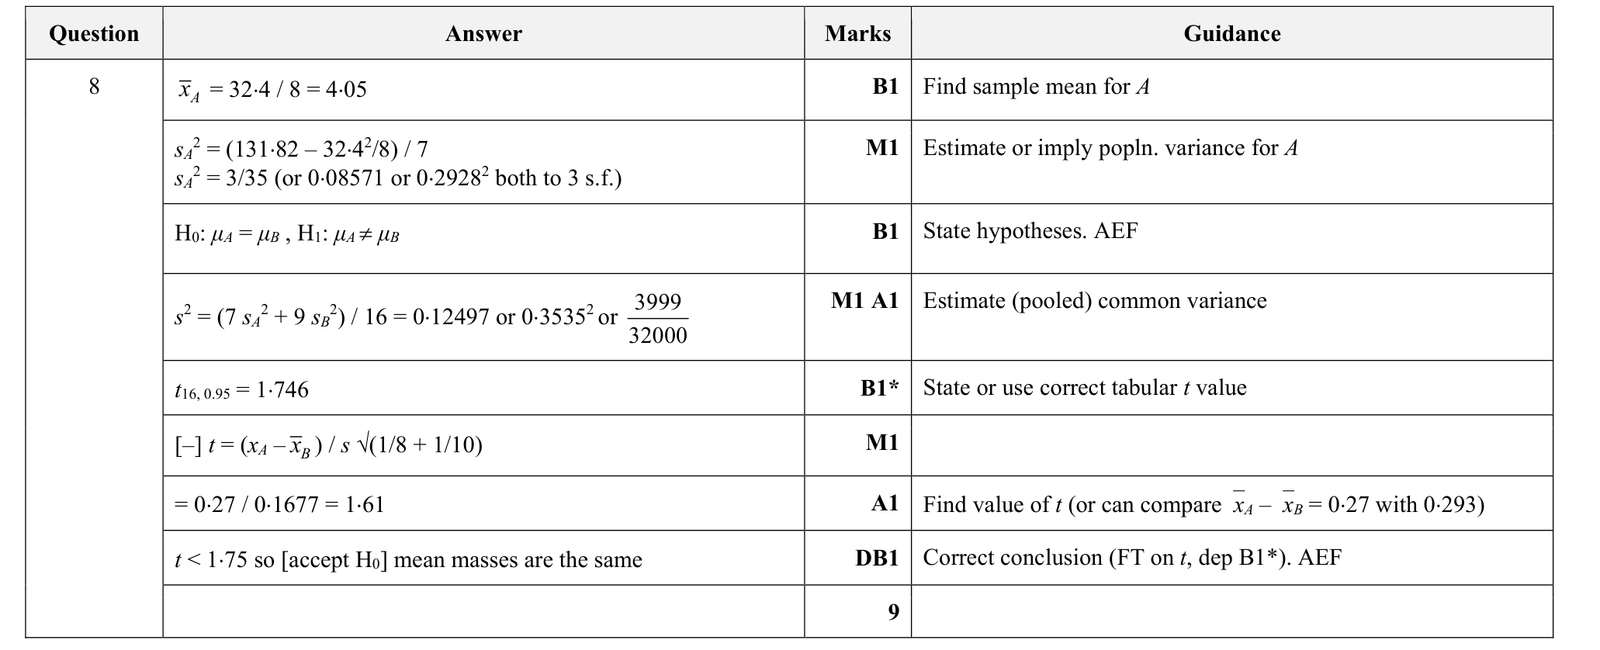
A random sample of 8 elephants from region \(A\) is taken and their weights, \(x\) tonnes, are recorded. ( 1 tonne \(=1000 \mathrm{~kg}\).) The results are summarised as follows.
\[\Sigma x=32.4 \quad \Sigma x^{2}=131.82\]
A random sample of 10 elephants from region \(B\) is taken. Their weights give a sample mean of 3.78 tonnes and an unbiased variance estimate of 0.1555 tonnes \(^{2}\). The distributions of the weights of elephants in regions \(A\) and \(B\) are both assumed to be normal with the same population variance. Test at the 10\% significance level whether the mean weight of elephants in region \(A\) is the same as the mean weight of elephants in region \(B\).
9231 P23 - Jun 2019 - Q11O - 12 marks
Question 11 OR alternative.
A company produces packets of sweets. Two different machines, \(A\) and \(B\), are used to fill the packets. The manager decides to assess the performance of the two machines. He selects a random sample of 50 packets filled by machine \(A\) and a random sample of 60 packets filled by machine \(B\). The masses of sweets, \(x \mathrm{~kg}\), in packets filled by machine \(A\) and the masses of sweets, \(y \mathrm{~kg}\), in packets filled by machine \(B\) are summarised as follows.
\[\Sigma x=22.4 \quad \Sigma x^{2}=10.1 \quad \Sigma y=28.8 \quad \Sigma y^{2}=16.3\]
A test at the \(\alpha \%\) significance level provides evidence that the mean mass of sweets in packets filled by machine \(A\) is less than the mean mass of sweets in packets filled by machine \(B\). Find the set of possible values of \(\alpha\).

9231 P21 - Jun 2019 - Q11O - 12 marks
Question 11 OR alternative.
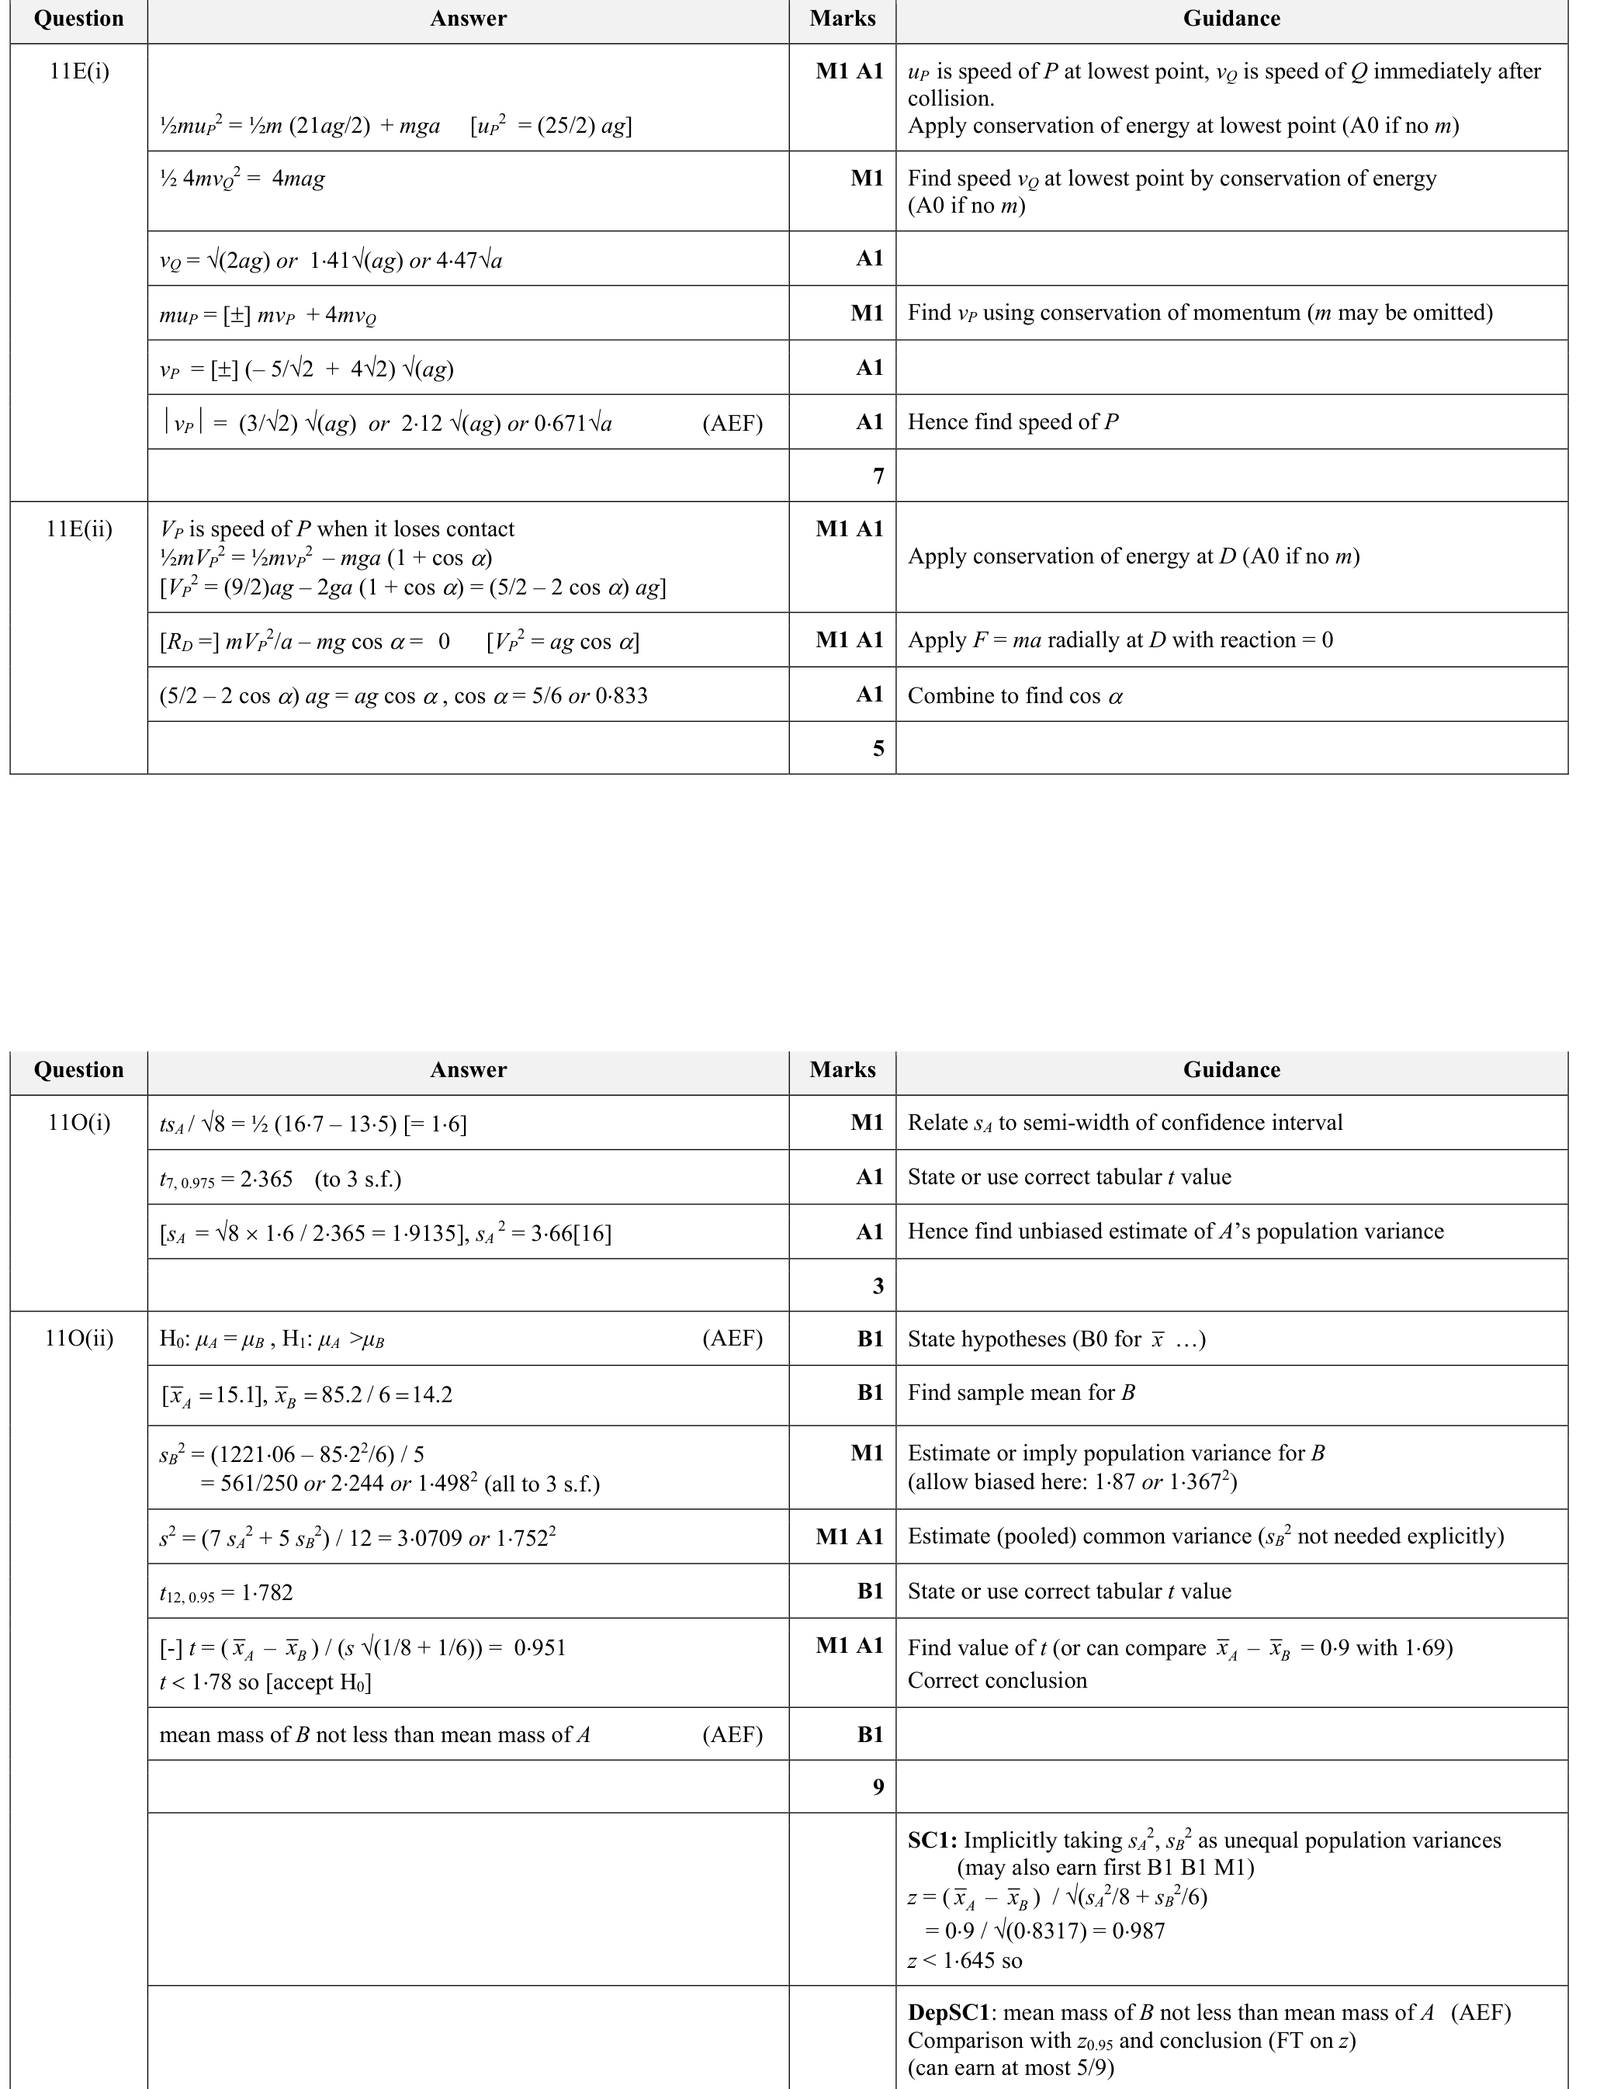
A farmer grows two different types of cherries, Type \(A\) and Type \(B\). He assumes that the masses of each type are normally distributed. He chooses a random sample of 8 cherries of Type \(A\). He finds that the sample mean mass is 15.1 g and that a \(95\%\) confidence interval for the population mean mass, \(\mu\) g, is \(13.5\leqslant\mu\leqslant16.7\).
(i) Find an unbiased estimate for the population variance of the masses of cherries of Type \(A\).
The farmer now chooses a random sample of 6 cherries of Type \(B\) and records their masses as follows.
| 12.2 | 13.3 | 16.4 | 14.0 | 13.9 | 15.4 |
(ii) Test at the \(5\%\) significance level whether the mean mass of cherries of Type \(B\) is less than the mean mass of cherries of Type \(A\). You should assume that the population variances for the two types of cherry are equal.
9231 P22 - Nov 2018 - Q11O - 14 marks
Question 11 OR alternative.
In a particular country, large numbers of ducks live on lakes \(A\) and \(B\). The mass, in kg, of a duck on lake \(A\) is denoted by \(x\) and the mass, in kg, of a duck on lake \(B\) is denoted by \(y\). A random sample of 8 ducks is taken from lake \(A\) and a random sample of 10 ducks is taken from lake \(B\). Their masses are summarised as follows.
\[\sum x=10.56\quad \sum x^2=14.1775\quad \sum y=12.39\quad \sum y^2=15.894\]
A scientist claims that ducks on lake \(A\) are heavier on average than ducks on lake \(B\).
(i) Test, at the \(10\%\) significance level, whether the scientist's claim is justified. You should assume that both distributions are normal and that their variances are equal.
A second random sample of 8 ducks is taken from lake \(A\) and their masses are summarised as
\[\sum x=10.24\quad\text{and}\quad\sum(x-\bar{x})^2=0.294,\]
where \(\bar{x}\) is the sample mean. The scientist now claims that the population mean mass of ducks on lake \(A\) is greater than \(p\ \mathrm{kg}\). A test of this claim is carried out at the \(10\%\) significance level, using only this second sample from lake \(A\). This test supports the scientist's claim.
(ii) Find the greatest possible value of \(p\).

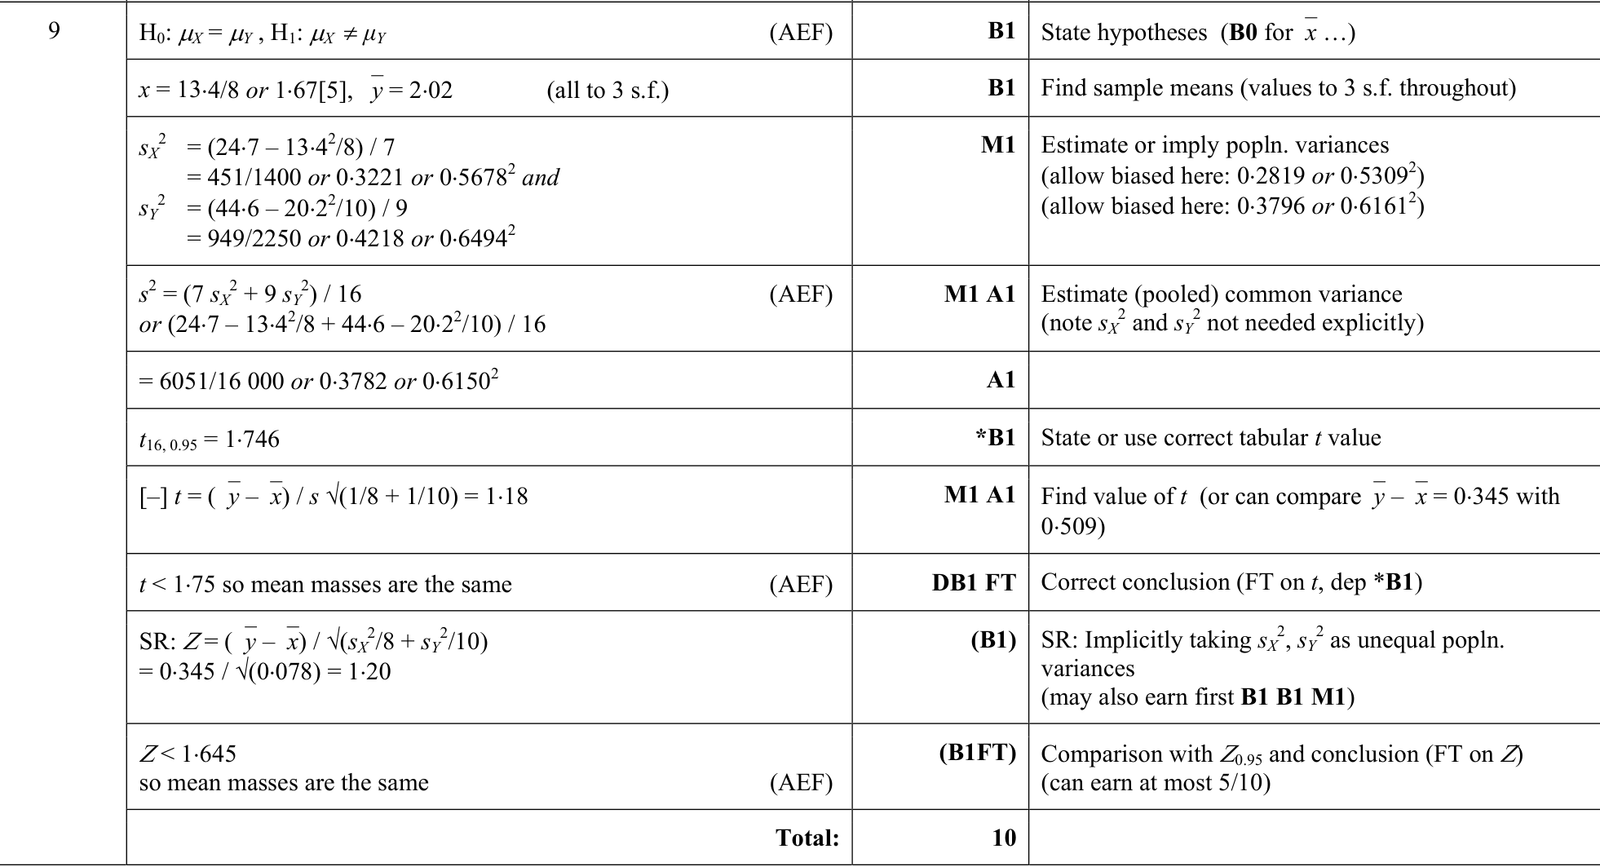
9231 P21 - Jun 2017 - Q9 - 10 marks
Two fish farmers \(X\) and \(Y\) produce a particular type of fish. Farmer \(X\) chooses a random sample of 8 of his fish and records the masses, \(x \mathrm{~kg}\), as follows.
\[\begin{array}{llllllll}
1.2 & 1.4 & 0.8 & 2.1 & 1.8 & 2.6 & 1.5 & 2.0
\end{array}\]
Farmer \(Y\) chooses a random sample of 10 of his fish and summarises the masses, \(y \mathrm{~kg}\), as follows.
\[\Sigma y=20.2 \quad \Sigma y^{2}=44.6\]
You should assume that both distributions are normal with equal variances. Test at the \(10 \%\) significance level whether the mean mass of fish produced by farmer \(X\) differs from the mean mass of fish produced by farmer \(Y\).
9231 P23 - Jun 2017 - Q6 - 5 marks
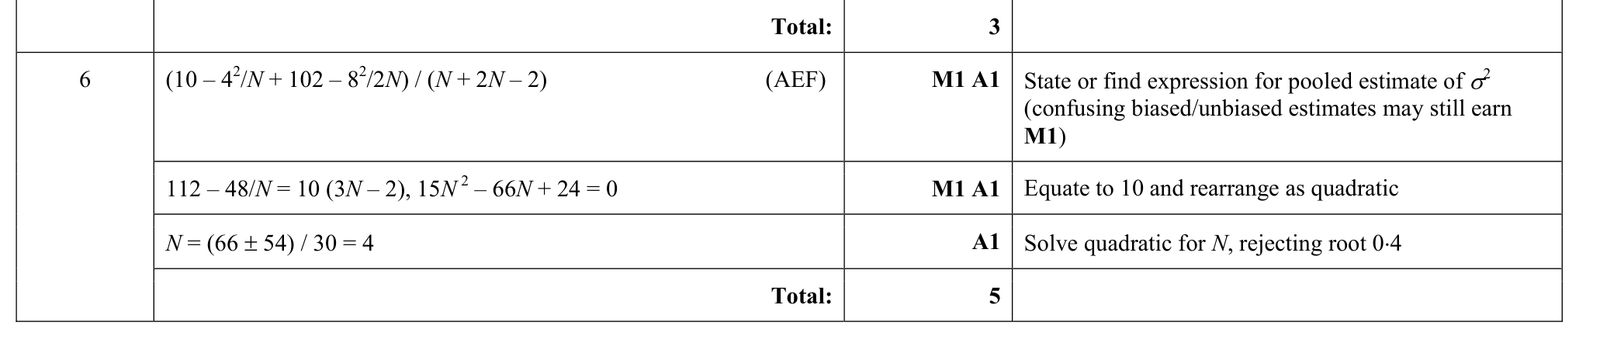
The independent variables \(X\) and \(Y\) have distributions with the same variance \(\sigma^{2}\). Random samples of \(N\) observations of \(X\) and \(2 N\) observations of \(Y\) are taken, and the results are summarised by
\[\Sigma x=4, \quad \Sigma x^{2}=10, \quad \Sigma y=8, \quad \Sigma y^{2}=102 .\]
These data give a pooled estimate of 10 for \(\sigma^{2}\). Find \(N\).
9231 P21 - Nov 2017 - Q10 - 13 marks
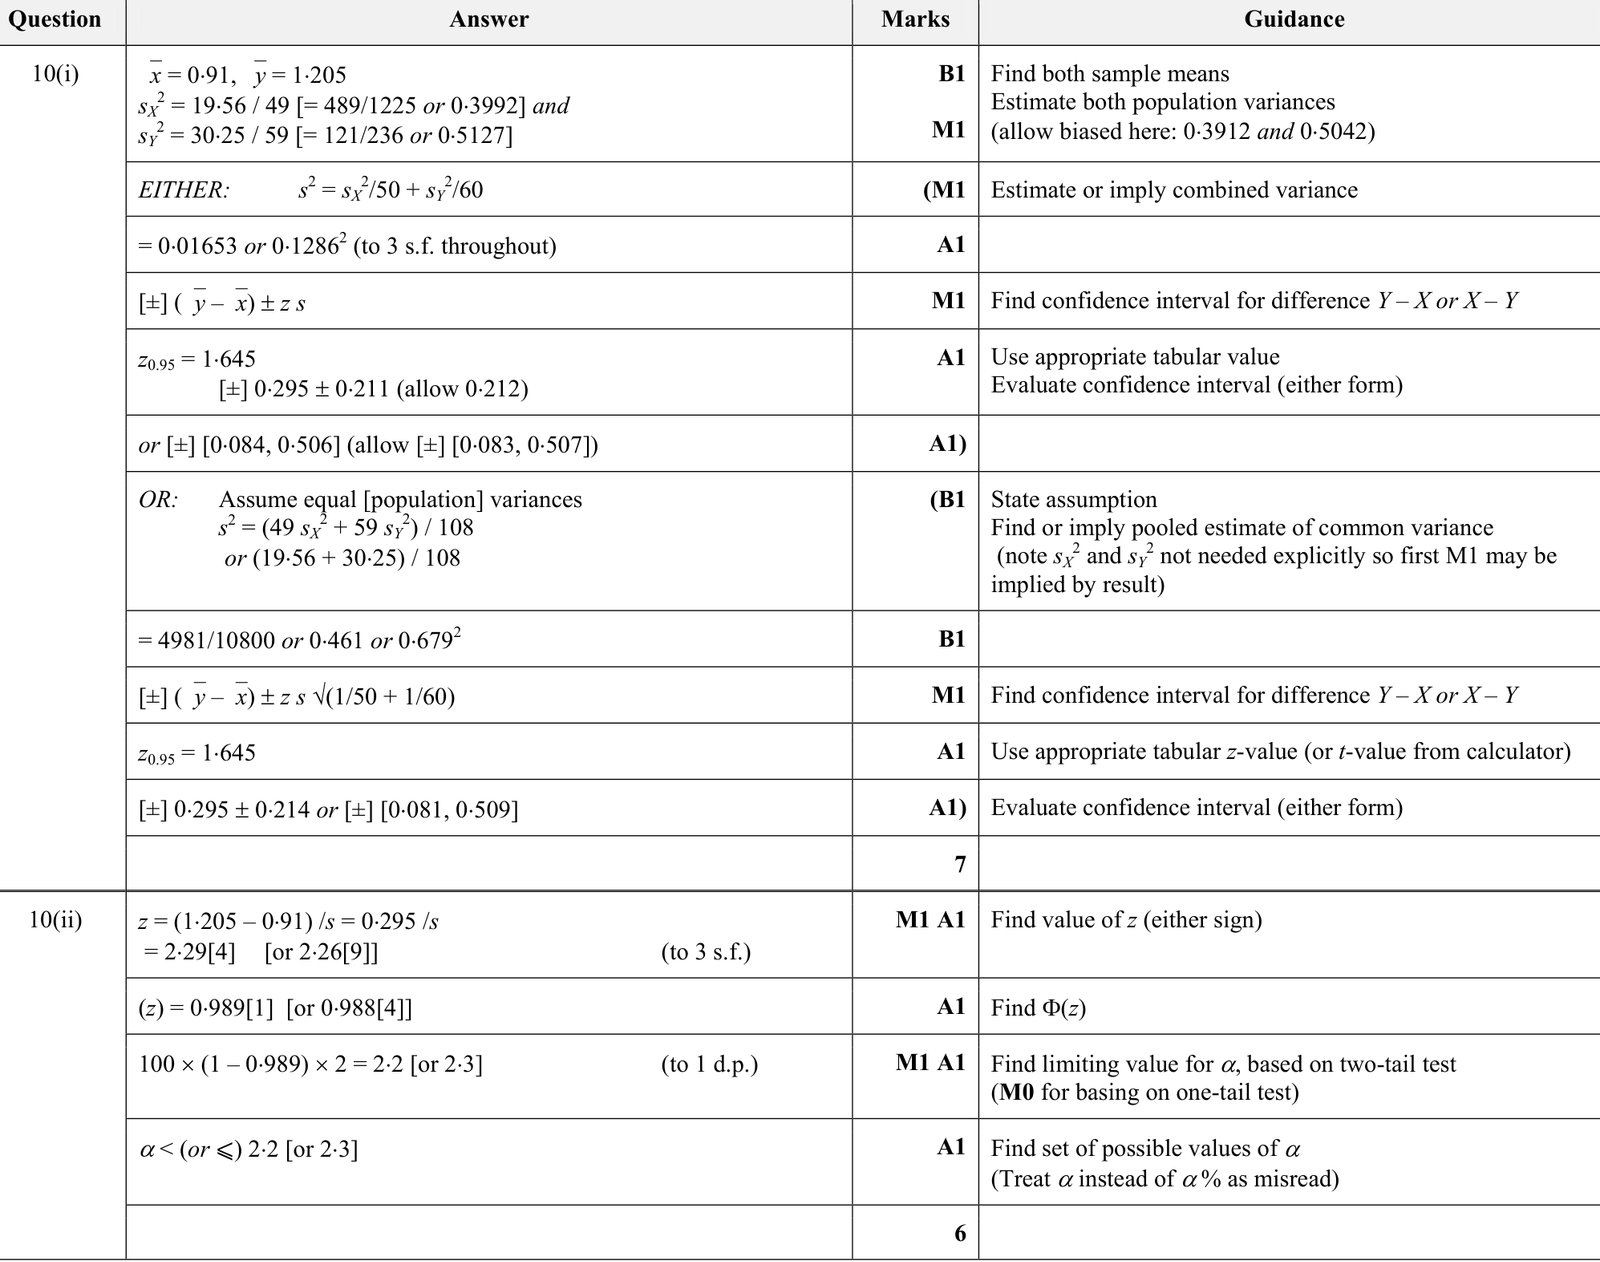
A factory produces bottles of an energy juice. Two different machines are used to fill empty bottles with the juice. The manager chooses a random sample of 50 bottles filled by machine \(X\) and a random sample of 60 bottles filled by machine \(Y\). The volumes of juice, \(x\) and \(y\) respectively, measured in appropriate units, are summarised by
\[\Sigma x=45.5, \quad \Sigma(x-\bar{x})^{2}=19.56, \quad \Sigma y=72.3, \quad \Sigma(y-\bar{y})^{2}=30.25,\]
where \(\bar{x}\) and \(\bar{y}\) are the sample means of the volume of juice in the bottles filled by \(X\) and \(Y\) respectively.
(i) Find a \(90 \%\) confidence interval for the difference between the mean volume of juice in bottles filled by machine \(X\) and the mean volume of juice in bottles filled by machine \(Y\).
A test at the \(\alpha \%\) significance level does not provide evidence that there is any difference in the means of the volume of juice in bottles filled by machine \(X\) and the volume of juice in bottles filled by machine \(Y\).
(ii) Find the set of possible values of \(\alpha\).
9231 P21 - Jun 2018 - Q10 - 12 marks
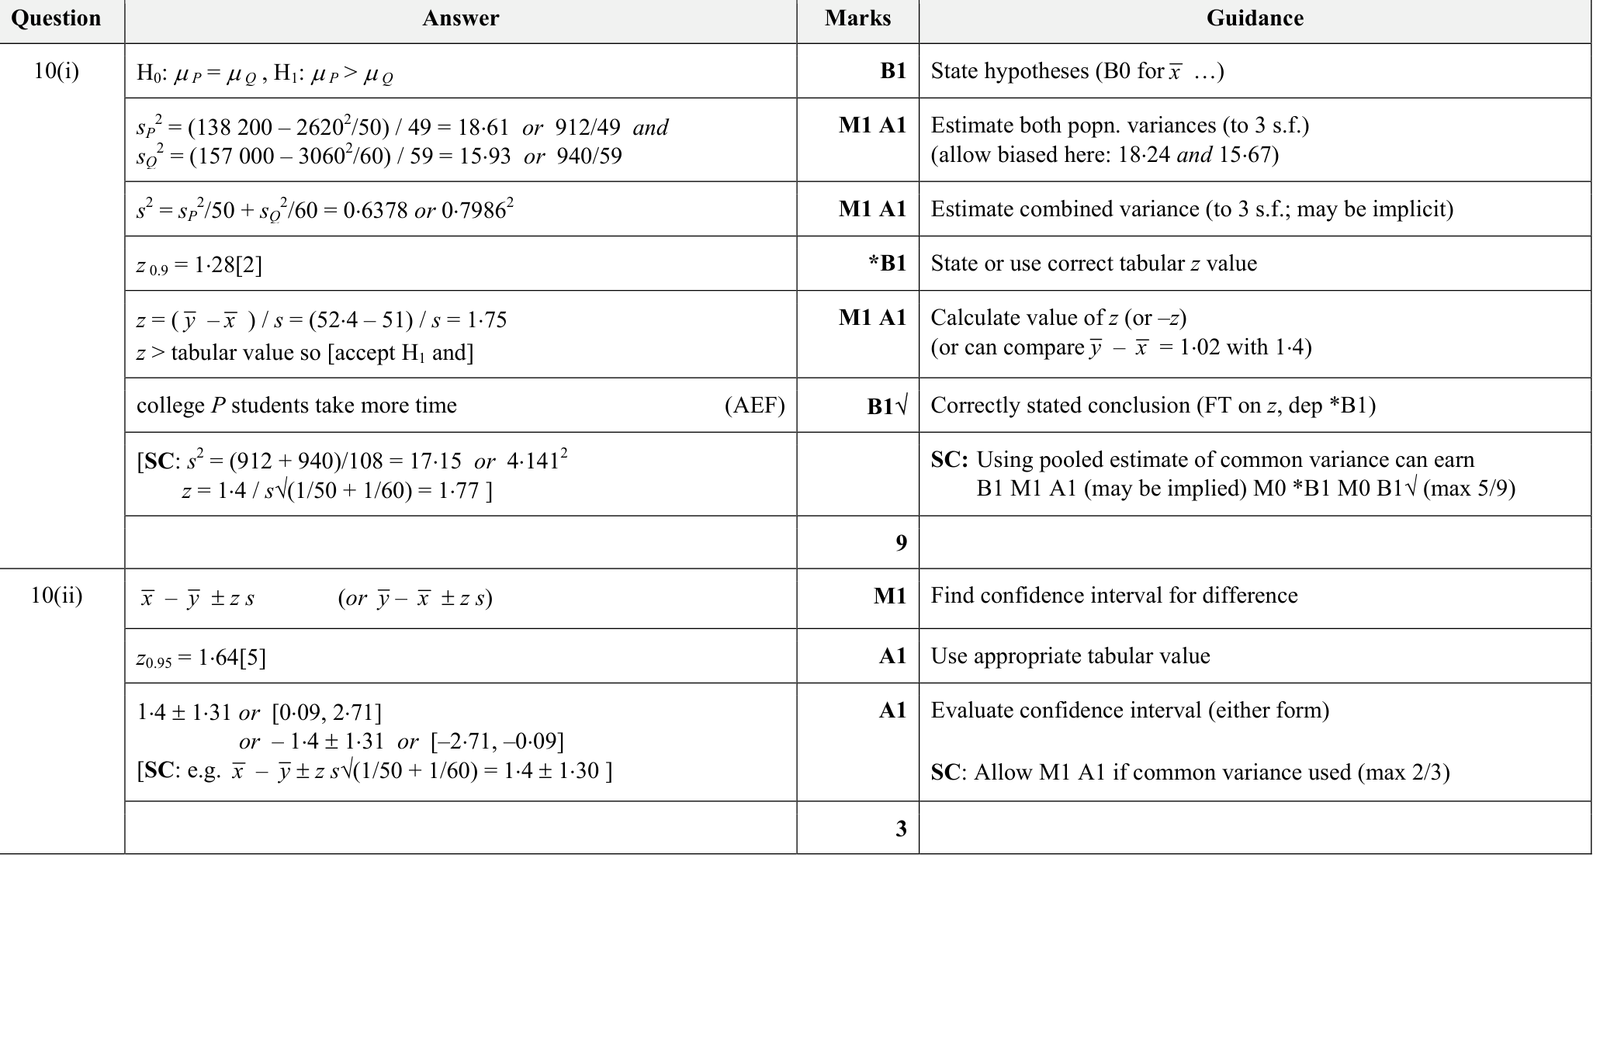
The times taken to run 400 metres by students at two large colleges \(P\) and \(Q\) are being compared. There is no evidence that the population variances are equal. The time taken by a student at college \(P\) and the time taken by a student at college \(Q\) are denoted by \(x\) seconds and \(y\) seconds respectively. A random sample of 50 students from college \(P\) and a random sample of 60 students from college \(Q\) give the following summarised data.
\[\Sigma x=2620 \quad \Sigma x^{2}=138200 \quad \Sigma y=3060 \quad \Sigma y^{2}=157000\]
(i) Using a \(10 \%\) significance level, test whether, on average, students from college \(P\) take longer to run 400 metres than students from college \(Q\).
(ii) Find a \(90 \%\) confidence interval for the difference in the mean times taken to run 400 metres by students from colleges \(P\) and \(Q\).
9231 P41 - Nov 2025 - Q3 - 4 marks
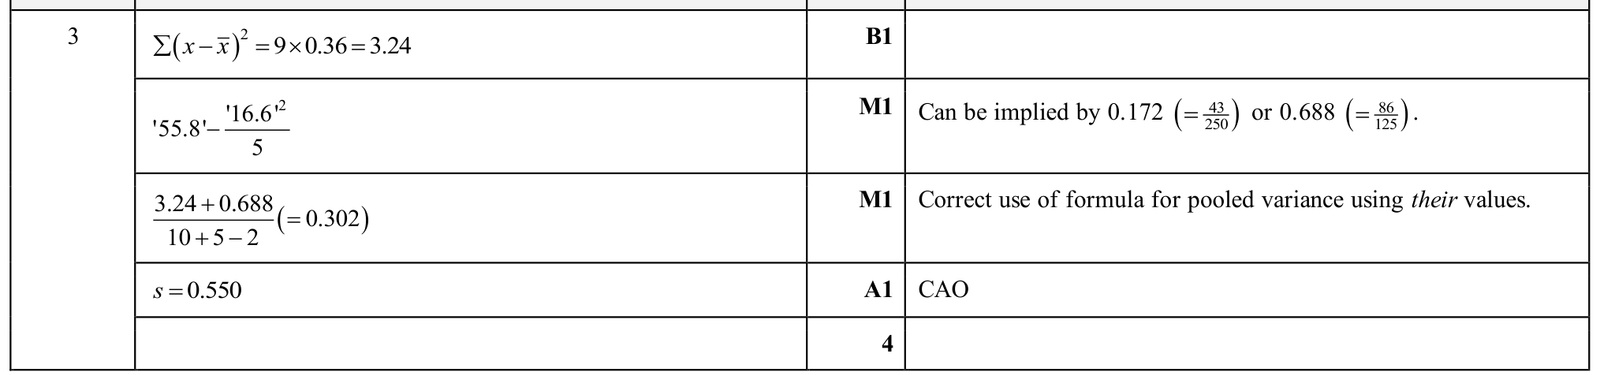
A random sample of 10 newborn baby boys is taken and their masses in kg are recorded. From this sample, the population standard deviation of all newborn baby boys is estimated as \(0.6\) kg. A random sample of 5 newborn baby girls is taken and their masses in kg are recorded as follows.
| \(3.9\) | \(3.1\) | \(2.9\) | \(3.1\) | \(3.6\) |
It is assumed that the masses of newborn baby boys and girls have the same population standard deviation, \(\sigma\) kg.
By pooling the two samples, calculate an estimate of \(\sigma\).
9231 P42 - Nov 2025 - Q5 - 9 marks
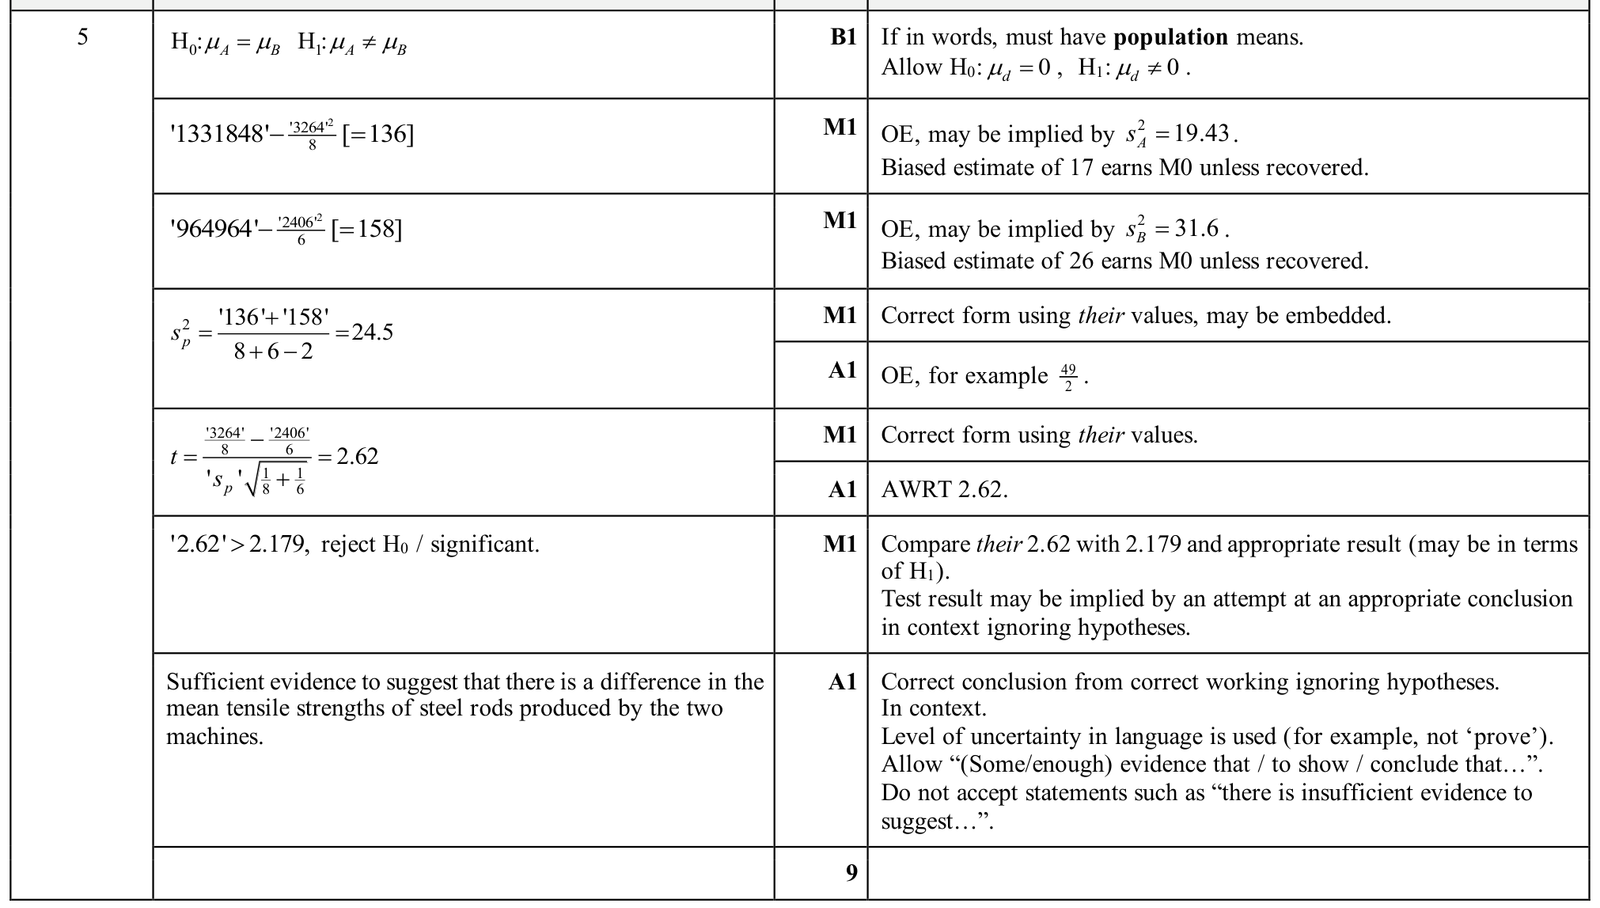
An engineer is comparing the tensile strengths of steel rods made from two machines, \(A\) and \(B\). The engineer randomly selects 8 rods from machine \(A\) and 6 rods from machine \(B\). The tensile strengths, in appropriate units, are given in the following table.
| Machine \(A\) | \(402\) | \(403\) | \(415\) | \(412\) | \(409\) | \(407\) | \(406\) | \(410\) |
|---|---|---|---|---|---|---|---|---|
| Machine \(B\) | \(401\) | \(398\) | \(395\) | \(397\) | \(410\) | \(405\) |
You should assume that the two distributions are normal and have the same population variance. Use a \(t\)-test at the \(5\%\) significance level to test whether there is any difference in the mean tensile strengths of steel rods from the two machines.
9231 P41 - Jun 2025 - Q1 - 7 marks
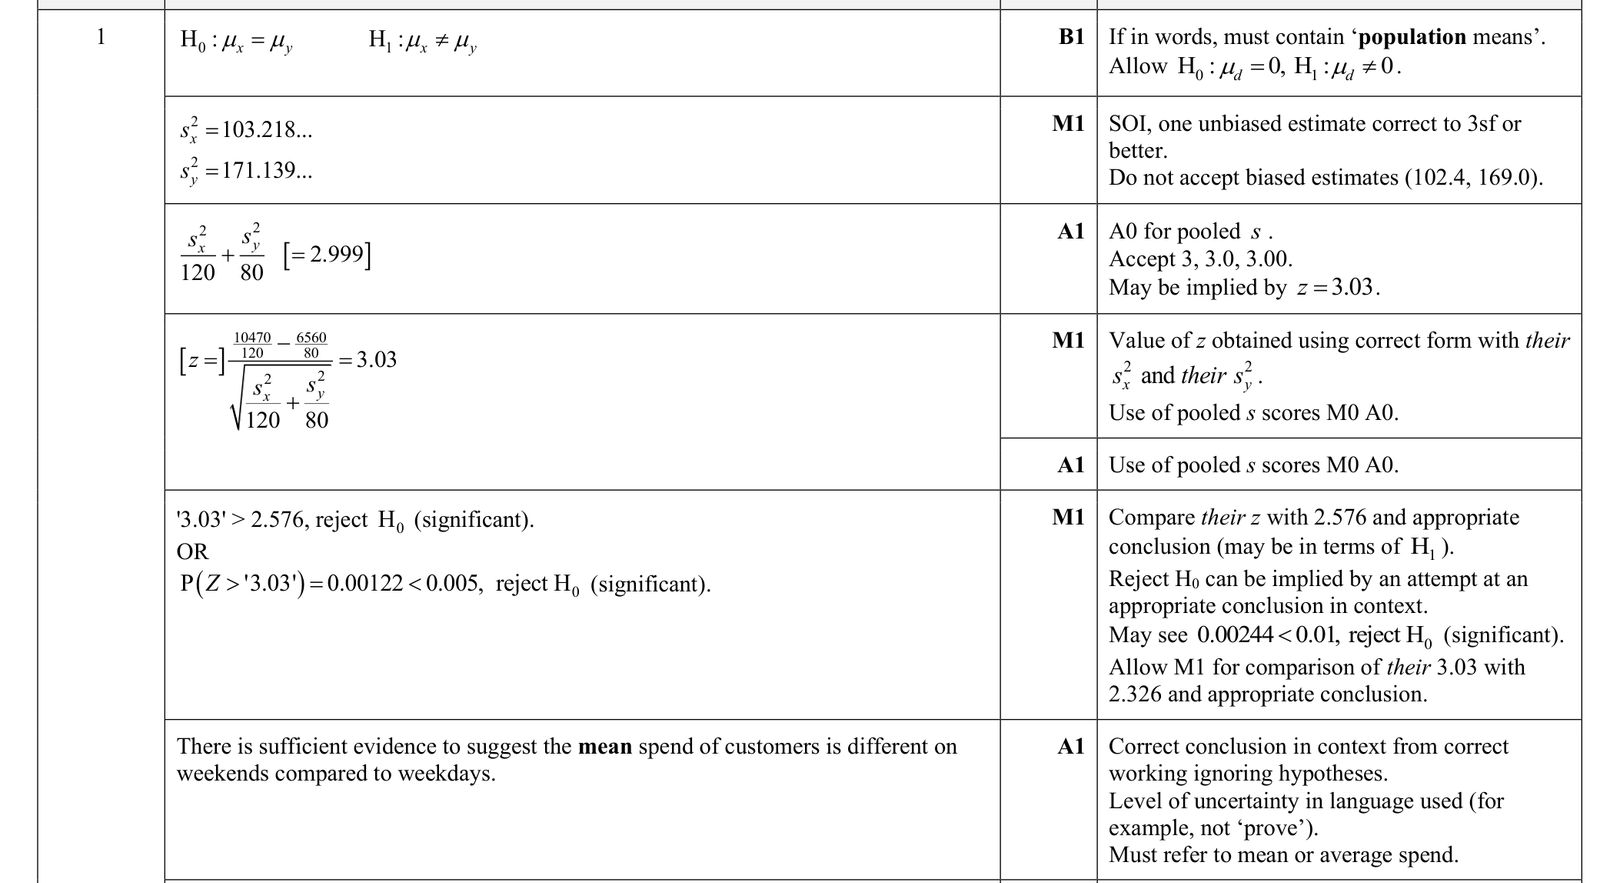
The manager of a hardware store is interested in whether there is a difference in the amount spent per customer on weekdays ( \(\$ x\) ) compared to weekends ( \(\$ y\) ). Random samples of 120 customers on weekdays and 80 customers on weekends are taken and the amount spent by each customer is recorded. The results are summarised as follows.
\(\sum x=10470 \quad \sum(x-\bar{x})^{2}=12283 \quad \sum y=6560 \quad \sum(y-\bar{y})^{2}=13520\)
Test at the \(1 \%\) significance level whether there is a difference in the mean amount spent per customer on weekdays compared to weekends. You should not assume that the population variances of the amounts spent on weekdays and weekends are equal.
9231 P41 - Jun 2023 - Q2 - 8 marks
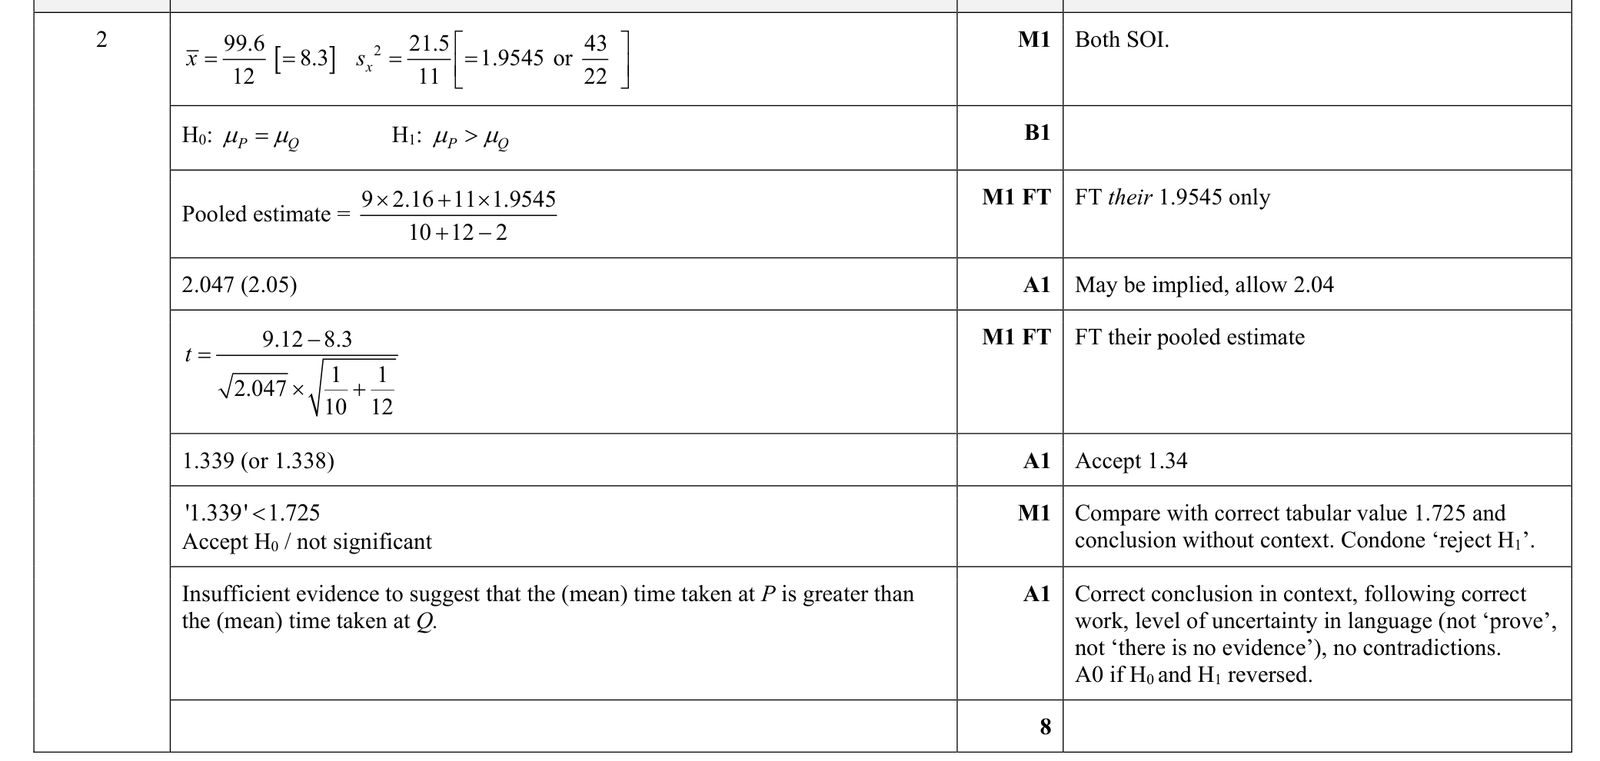
The children at two large schools, \(P\) and \(Q\), are all given the same puzzle to solve. A random sample of size 10 is taken from the children at school \(P\). Their individual times to complete the puzzle give a sample mean of 9.12 minutes and an unbiased variance estimate of 2.16 minutes \({ }^{2}\). A random sample of size 12 is taken from the children at school \(Q\). Their individual times, \(x\) minutes, to complete the puzzle are summarised by
\(\sum x=99.6 \quad \sum(x-\bar{x})^{2}=21.5\)
where \(\bar{x}\) is the sample mean. Times to complete the puzzle are assumed to be normally distributed with the same population variance.
Test at the \(5 \%\) significance level whether the population mean time taken to complete the puzzle by children at school \(P\) is greater than the population mean time taken to complete the puzzle by children at school \(Q\).
9231 P43 - Jun 2023 - Q4 - 9 marks
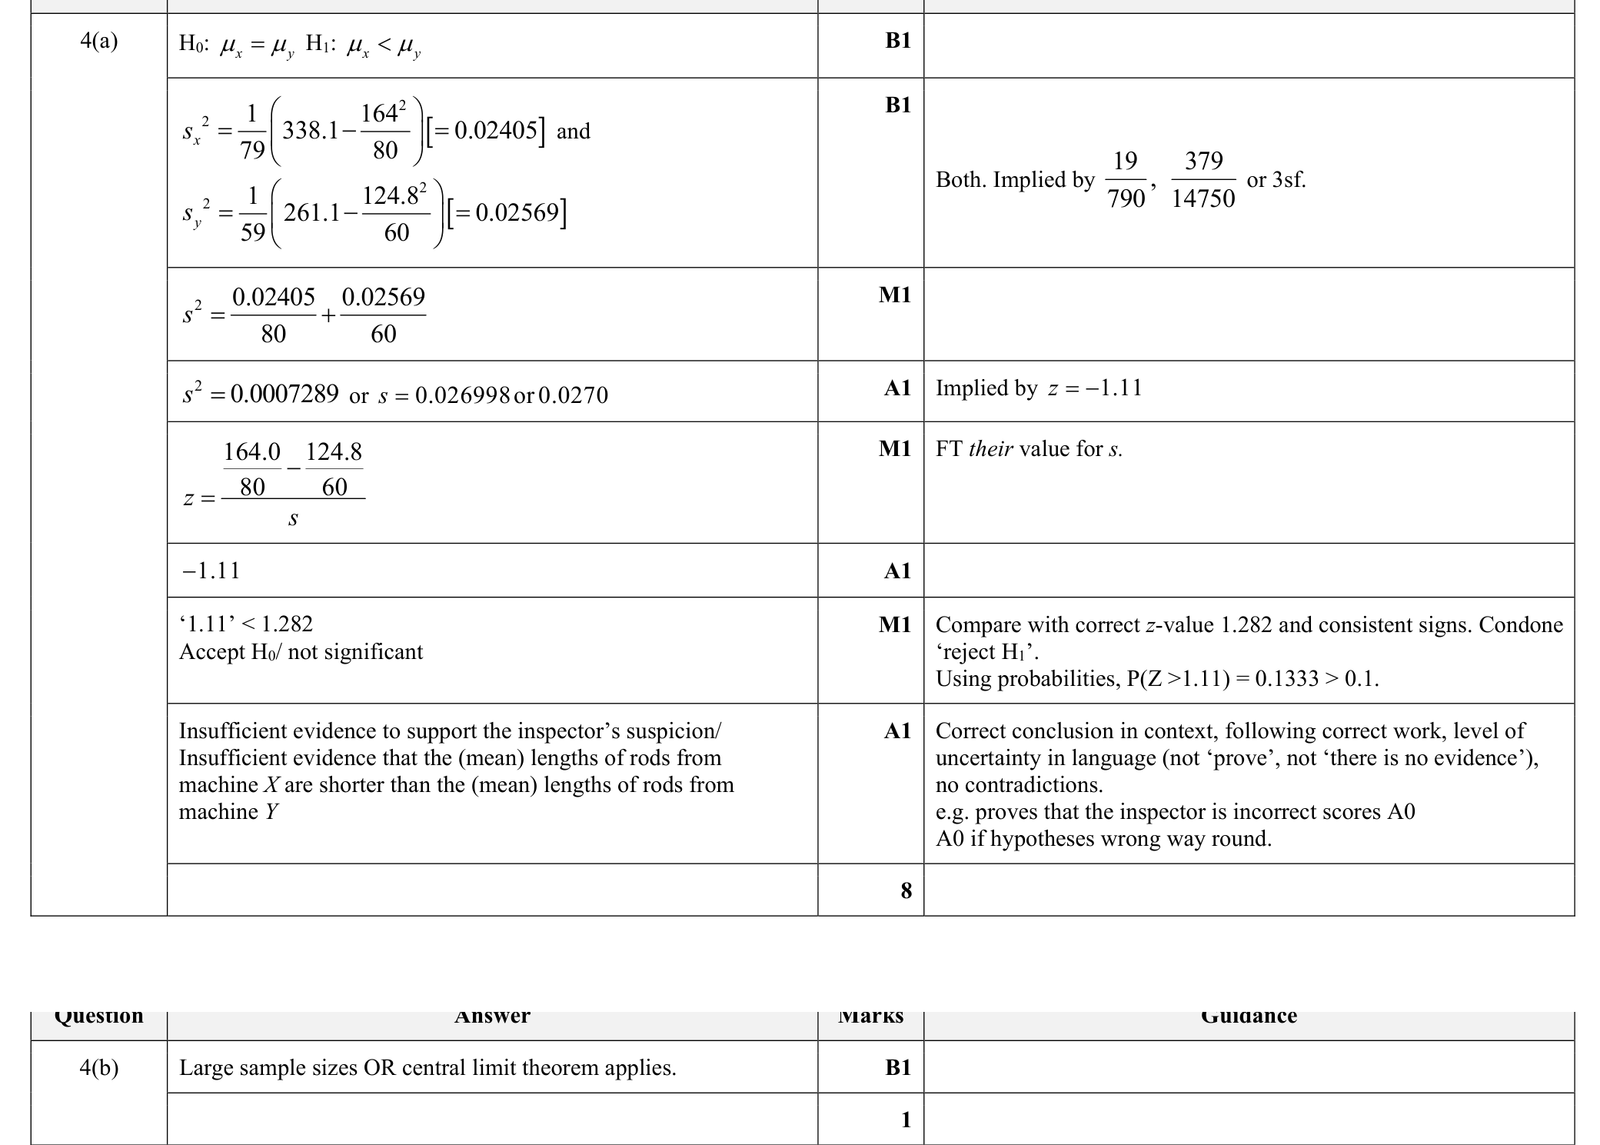
An inspector is checking the lengths of metal rods produced by two machines, \(X\) and \(Y\). These rods should be of the same length, but the inspector suspects that those made by machine \(X\) are shorter, on average, than those made by machine \(Y\). The inspector chooses a random sample of 80 rods made by machine \(X\) and a random sample of 60 rods made by machine \(Y\). The lengths of these rods are \(x \mathrm{~cm}\) and \(y \mathrm{~cm}\) respectively. Her results are summarised as follows.
\(\sum x=164.0 \quad \sum x^{2}=338.1 \quad \sum y=124.8 \quad \sum y^{2}=261.1\)
(a) Test at the 10\% significance level whether the data supports the inspector's suspicion.
(b) Give a reason why it is not necessary to make any assumption about the distributions of the lengths of the rods.
9231 P43 - Jun 2022 - Q6 - 12 marks
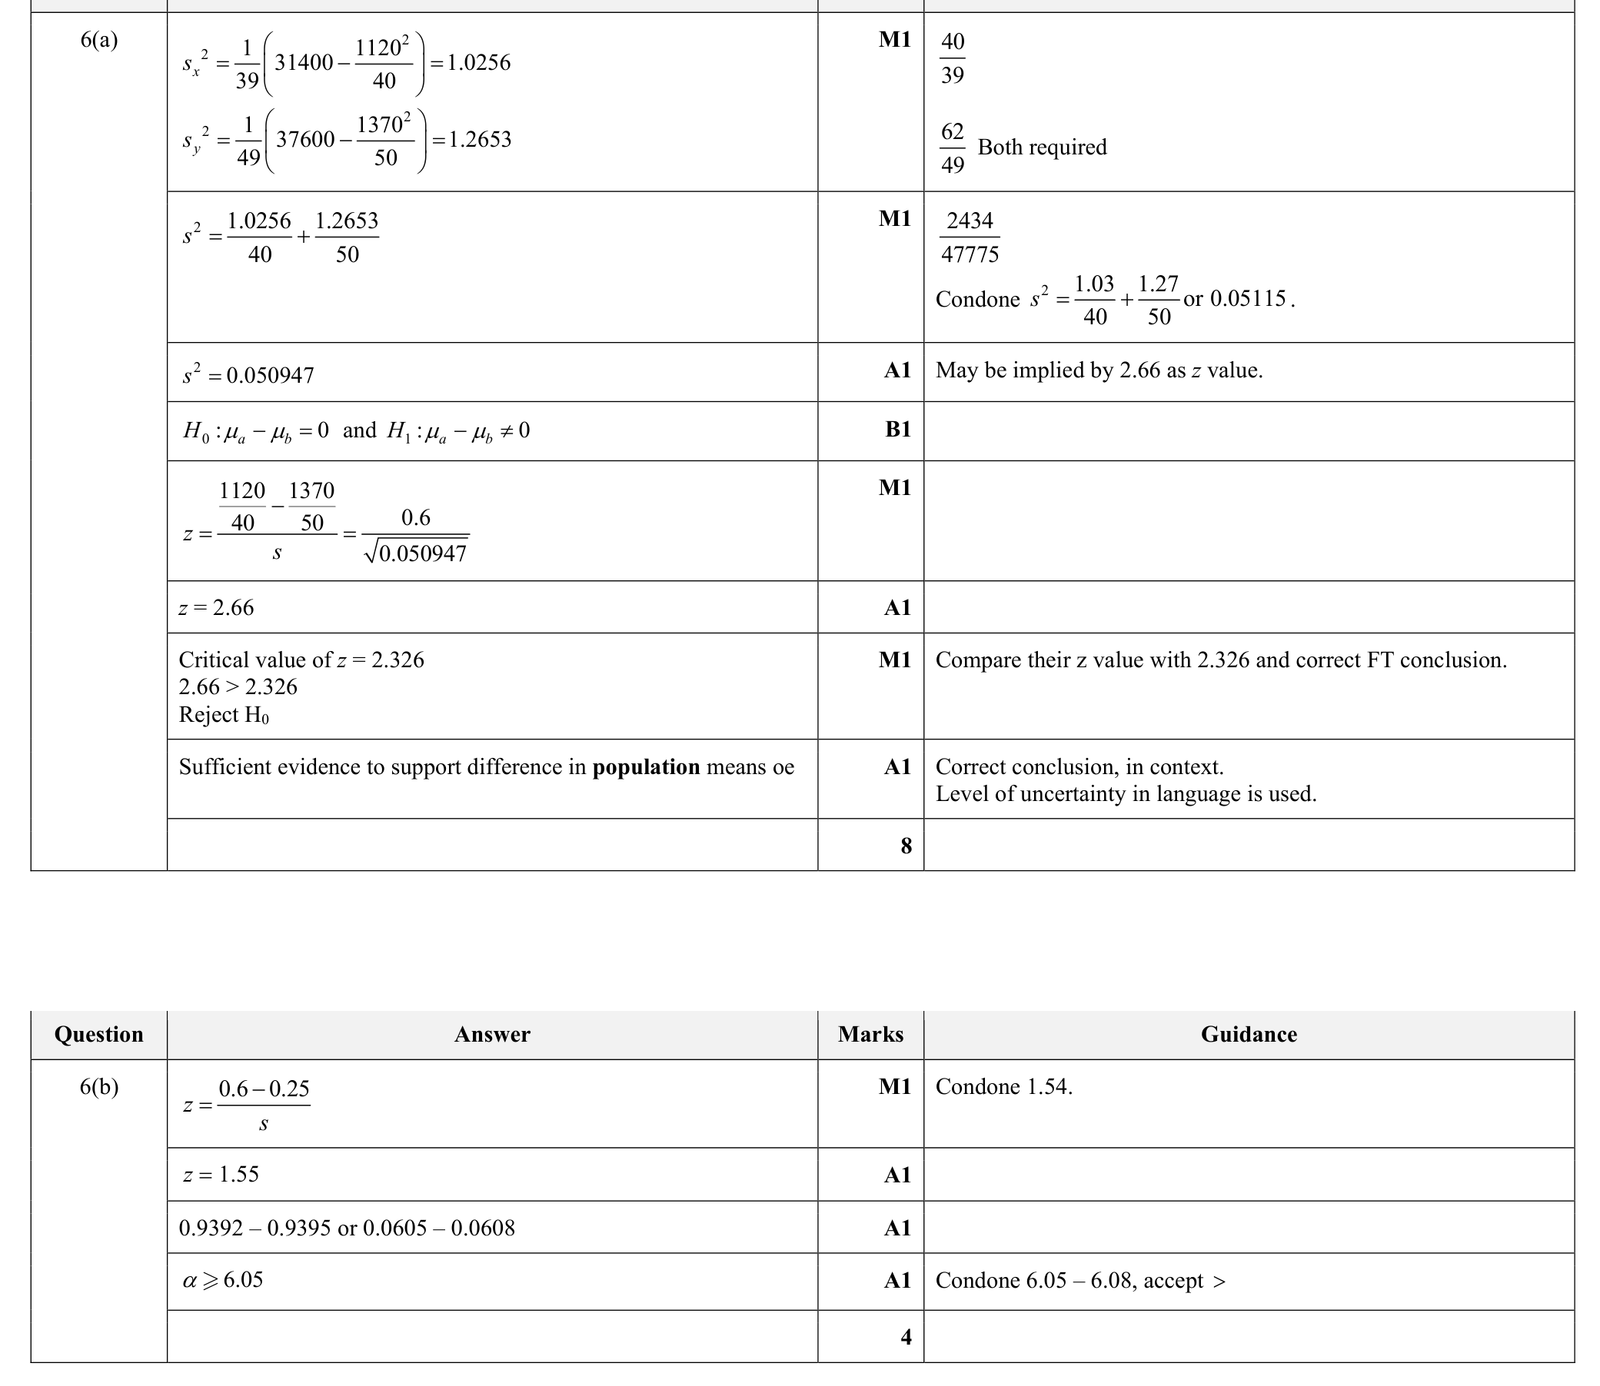
A company has two machines, \(A\) and \(B\), which independently fill small bottles with a liquid. The volumes of liquid per bottle, in suitable units, filled by machines \(A\) and \(B\) are denoted by \(x\) and \(y\) respectively. A scientist at the company takes a random sample of 40 bottles filled by machine \(A\) and a random sample of 50 bottles filled by machine \(B\). The results are summarised as follows.
\(\sum x=1120 \quad \sum x^{2}=31400 \quad \sum y=1370 \quad \sum y^{2}=37600\)
The population means of the volumes of liquid in the bottles filled by machines \(A\) and \(B\) are denoted by \(\mu_{A}\) and \(\mu_{B}\).
(a) Test at the 2% significance level whether there is any difference between \(\mu_{A}\) and \(\mu_{B}\).
(b) Find the set of values of \(\alpha\) for which there would be evidence at the \(\alpha \%\) significance level that \(\mu_{A}-\mu_{B}\) is greater than 0.25 .
9231 P41 - Nov 2022 - Q6 - 9 marks
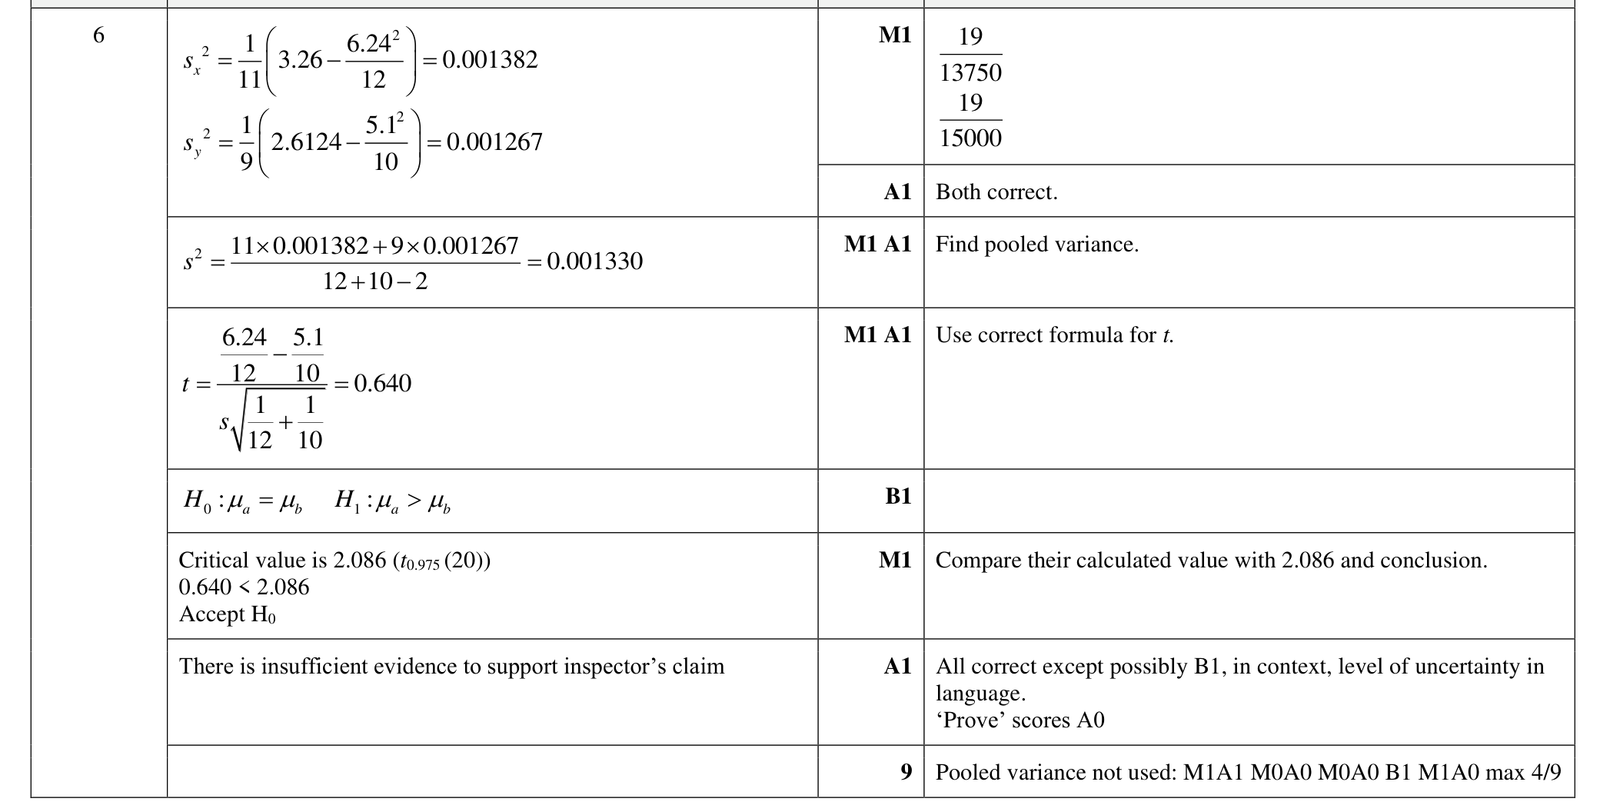
A company manufactures copper pipes. The pipes are produced by two different machines, \(A\) and \(B\). An inspector claims that the mean diameter of the pipes produced by machine \(A\) is greater than the mean diameter of the pipes produced by machine \(B\). He takes a random sample of 12 pipes produced by machine \(A\) and measures their diameters, \(x\) cm. His results are summarised as follows.
\(\sum x=6.24 \quad \sum x^2=3.26\)
He also takes a random sample of 10 pipes produced by machine \(B\) and measures their diameters in cm. His results are as follows.
| 0.48 | 0.53 | 0.47 | 0.54 | 0.54 | 0.55 | 0.46 | 0.55 | 0.50 | 0.48 |
The diameters of the pipes produced by each machine are assumed to be normally distributed with equal population variances.
Test at the 2.5% significance level whether the data supports the inspector's claim.
9231 P42 - Nov 2022 - Q3 - 8 marks
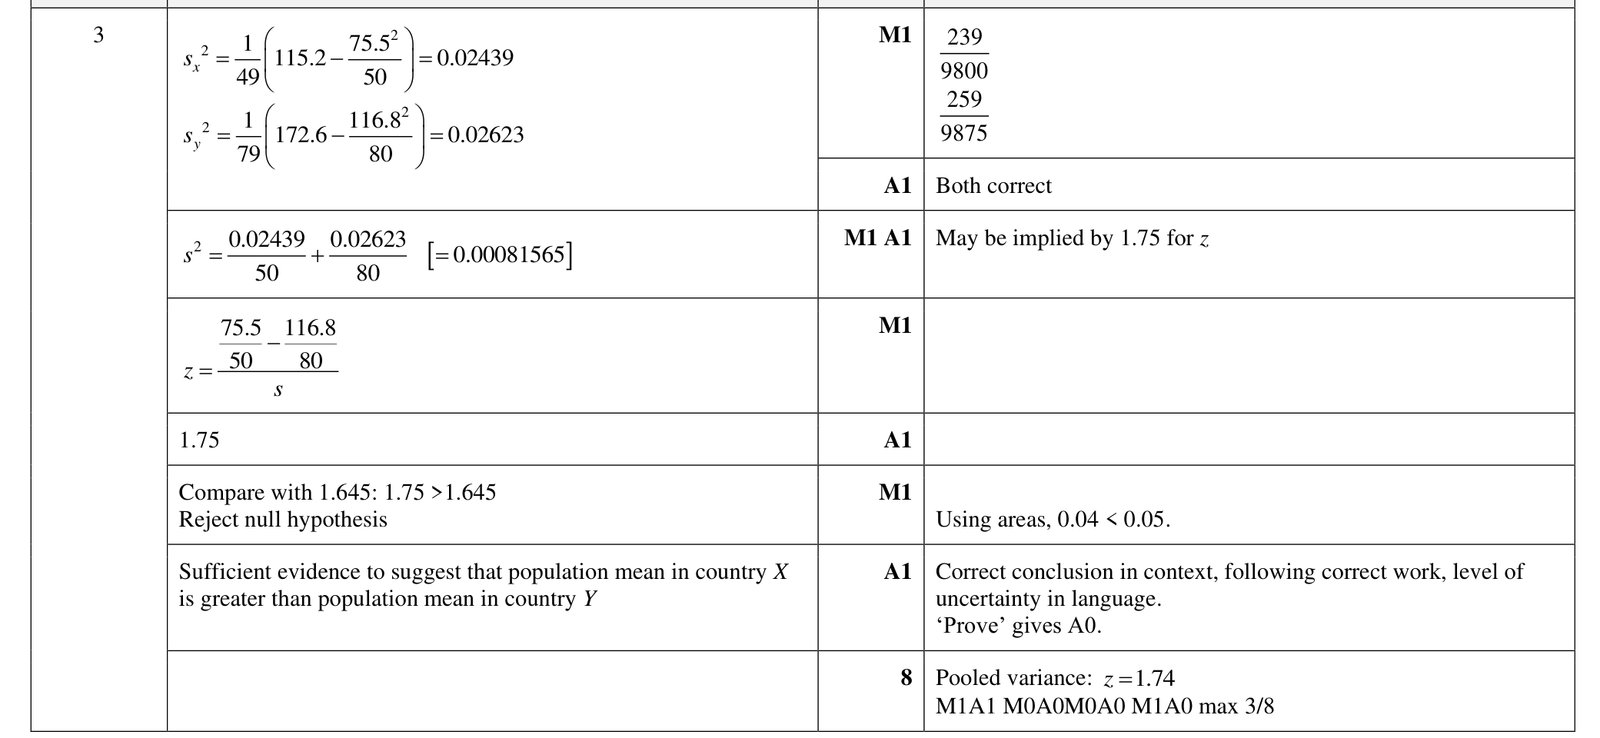
A scientist is investigating the masses of birds of a certain species in country \(X\) and country \(Y\). She takes a random sample of 50 birds from country \(X\) and a random sample of 80 birds from country \(Y\). She records their masses in kg, \(x\) and \(y\), respectively. Her results are summarised as follows.
\(\sum x=75.5 \quad \sum x^2=115.2 \quad \sum y=116.8 \quad \sum y^2=172.6\)
The population mean masses of these birds in countries \(X\) and \(Y\) are \(\mu_x\) kg and \(\mu_y\) kg respectively.
Test, at the 5% significance level, the null hypothesis \(\mu_x=\mu_y\) against the alternative hypothesis \(\mu_x\gt \mu_y\). State your conclusion in the context of the question.
9231 P41 - Jun 2021 - Q4 - 8 marks
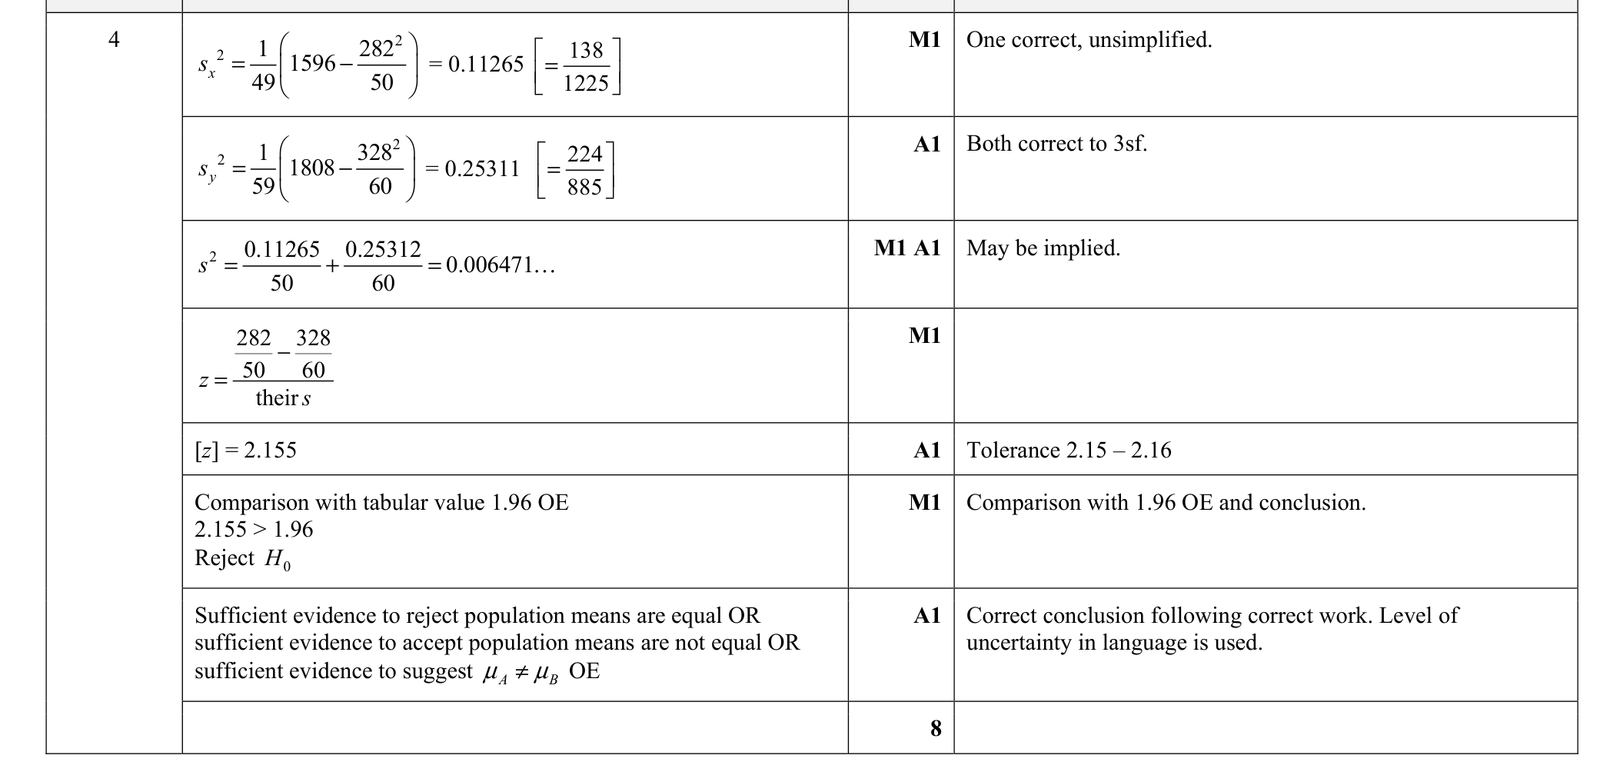
A scientist is investigating the lengths of the leaves of birch trees in different regions. He takes a random sample of 50 leaves from birch trees in region \(A\) and a random sample of 60 leaves from birch trees in region \(B\). He records their lengths in \(\mathrm{cm}, x\) and \(y\), respectively. His results are summarised as follows.
\(\sum x=282 \quad \sum x^{2}=1596 \quad \sum y=328 \quad \sum y^{2}=1808\)
The population mean lengths of leaves from birch trees in regions \(A\) and \(B\) are \(\mu_{A} \mathrm{~cm}\) and \(\mu_{B} \mathrm{~cm}\) respectively.
Carry out a test at the \(5 \%\) significance level to test the null hypothesis \(\mu_{A}=\mu_{B}\) against the alternative hypothesis \(\mu_{A} \neq \mu_{B}\).
9231 P42 - Nov 2021 - Q6 - 10 marks
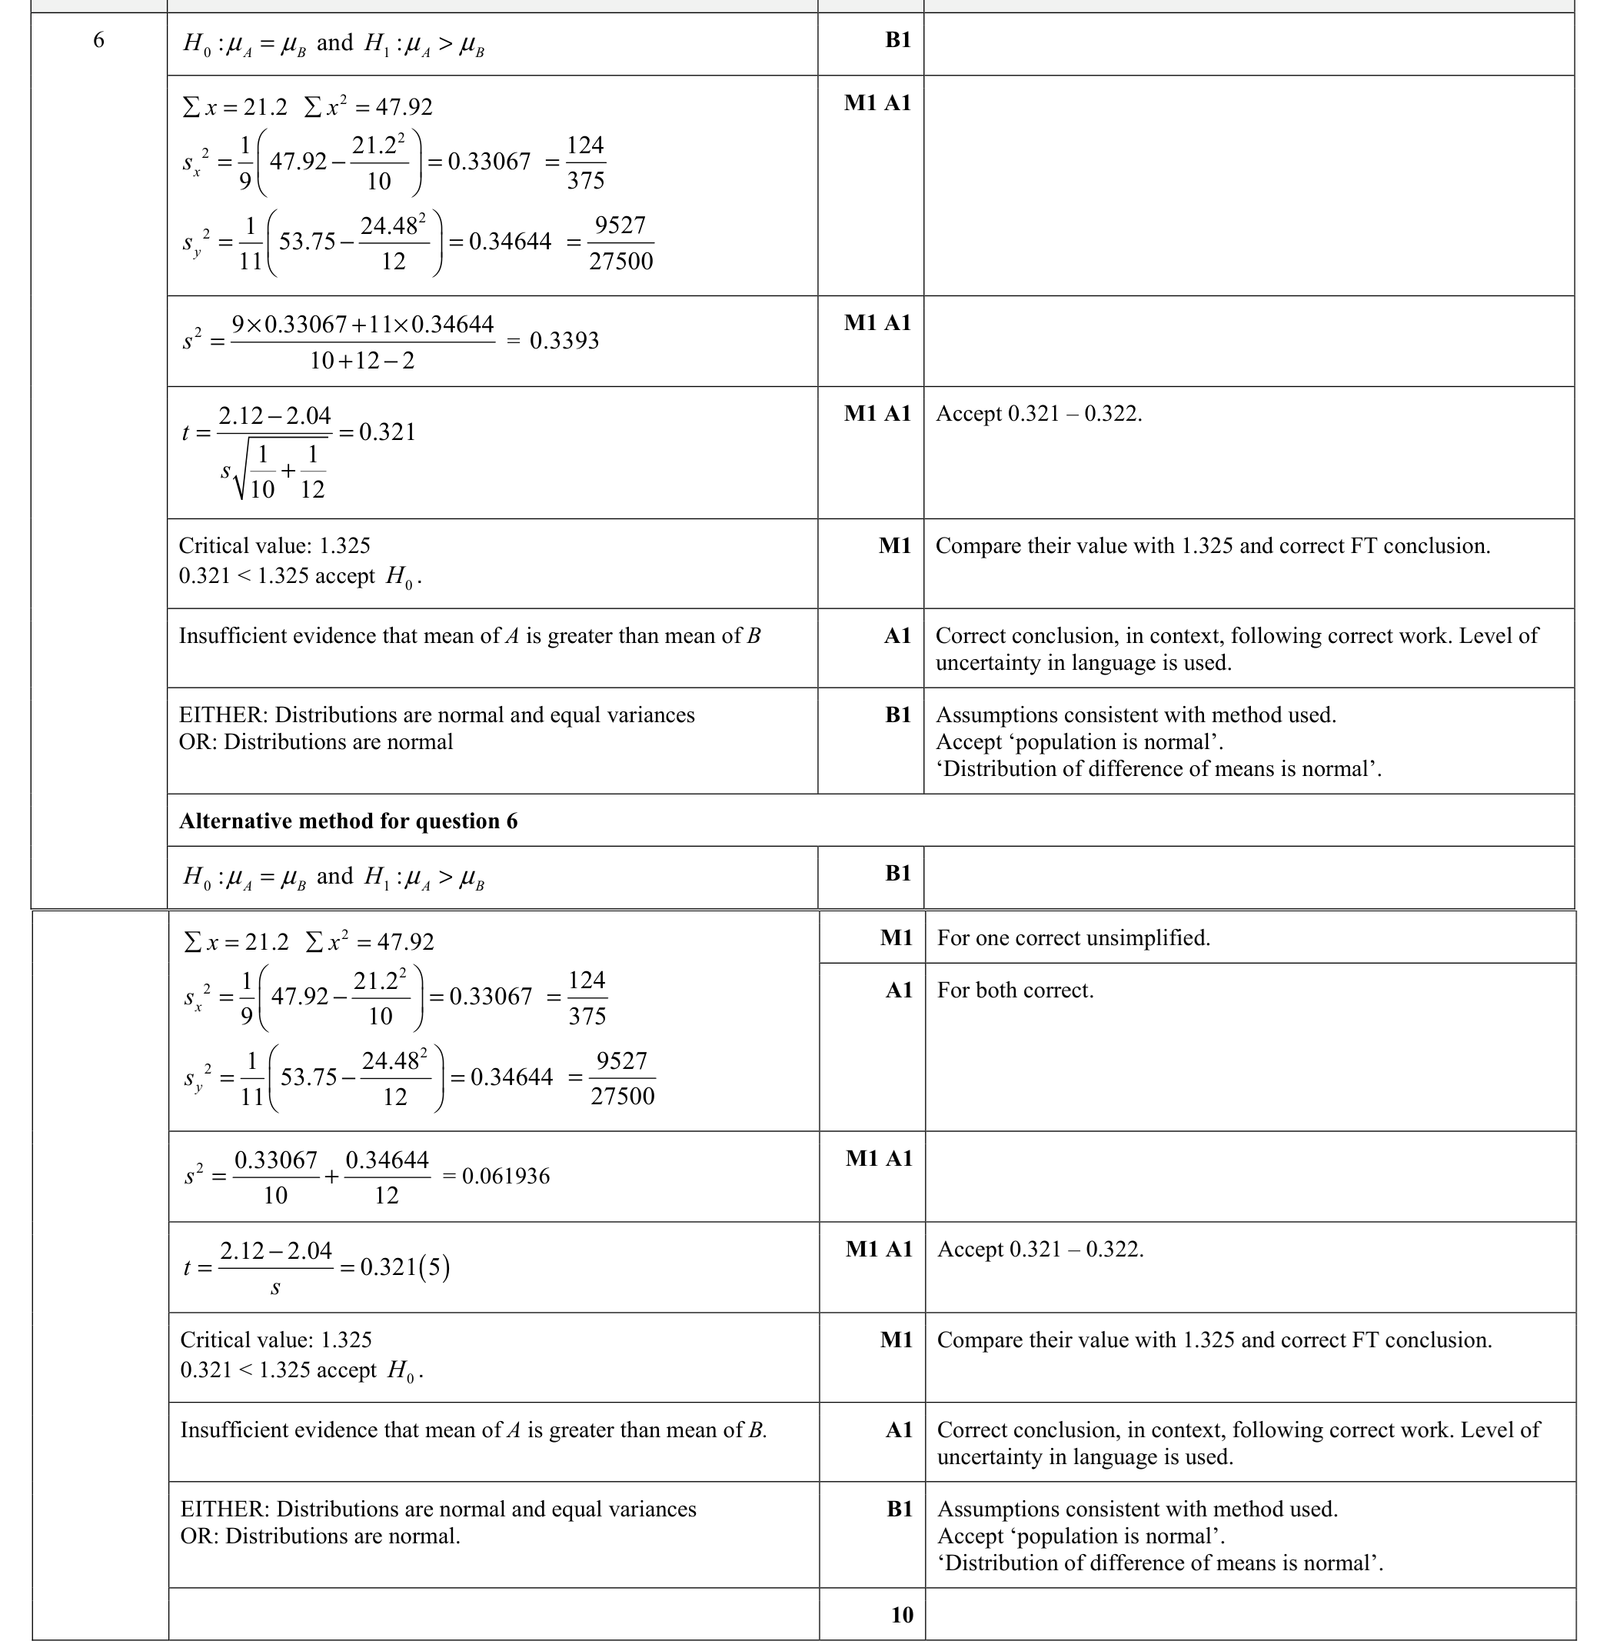
A scientist is investigating the masses of a particular type of fish found in lakes \(A\) and \(B\). He chooses a random sample of 10 fish of this type from lake \(A\) and records their masses, \(x \mathrm{~kg}\), as follows.
| 2.1 | 1.8 | 0.9 | 3.0 | 2.4 | 2.6 | 1.8 | 2.2 | 1.9 | 2.5 |
The scientist also chooses a random sample of 12 fish of this type from lake \(B\), but he only has a summary of their masses, \(y \mathrm{~kg}\), as follows.
\(\sum y=24.48 \quad \sum y^{2}=53.75\)
Test at the \(10 \%\) significance level whether the mean mass of fish of this type in lake \(A\) is greater than the mean mass of fish of this type in lake \(B\). You should state any assumptions that you need to make for the test to be valid.
9231 P41 - Jun 2020 - Q4 - 9 marks
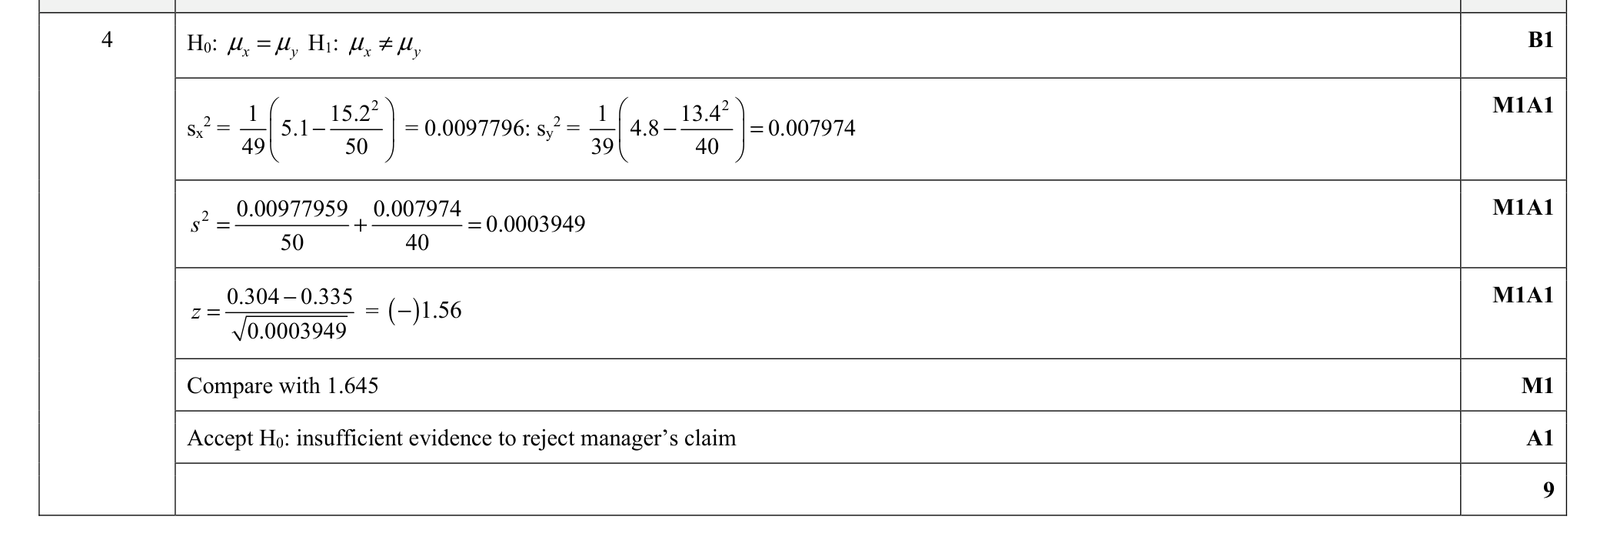
A company has two different machines, \(X\) and \(Y\), each of which fills empty cups with coffee. The manager is investigating the volumes of coffee, \(x\) and \(y\), measured in appropriate units, in the cups filled by machines \(X\) and \(Y\) respectively. She chooses a random sample of 50 cups filled by machine \(X\) and a random sample of 40 cups filled by machine \(Y\). The volumes are summarised as follows.
\(\sum x=15.2 \quad \sum x^{2}=5.1 \quad \sum y=13.4 \quad \sum y^{2}=4.8\)
The manager claims that there is no difference between the mean volume of coffee in cups filled by machine \(X\) and the mean volume of coffee in cups filled by machine \(Y\).
Test the manager's claim at the \(10 \%\) significance level.
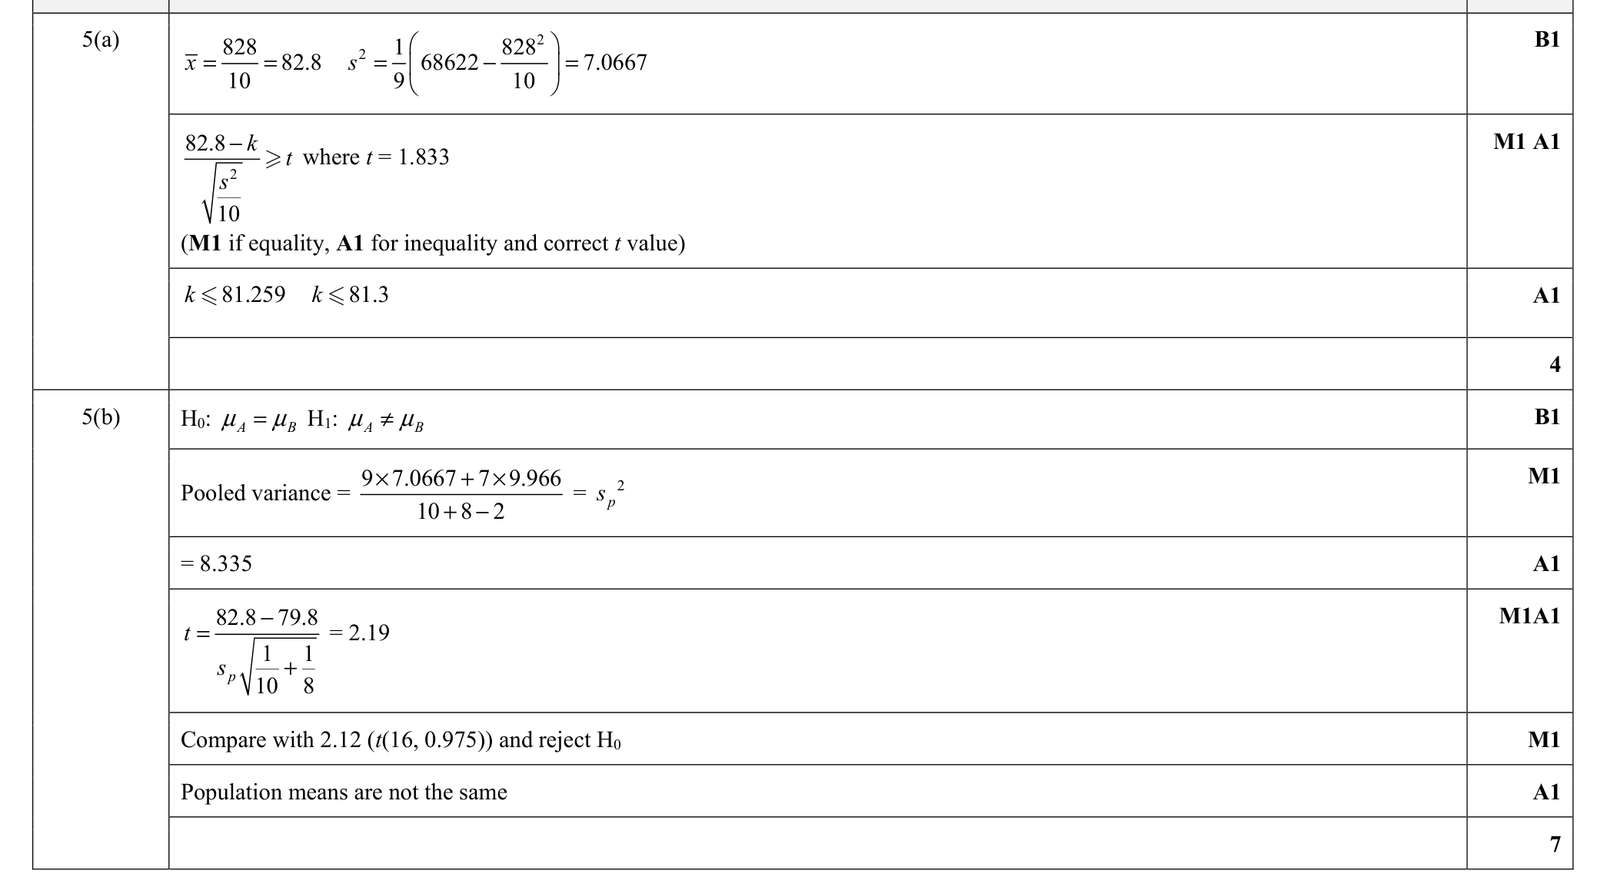
9231 P43 - Jun 2020 - Q5 - 11 marks
Students at two colleges, \(A\) and \(B\), are competing in a computer games challenge.
(a) The time taken for a randomly chosen student from college \(A\) to complete the challenge has a normal distribution with mean \(\mu\) minutes. The times taken, \(x\) minutes, are recorded for a random sample of 10 students chosen from college \(A\). The results are summarised as follows.
\(\sum x=828 \quad \sum x^{2}=68622\)
A test is carried out on the data at the \(5 \%\) significance level and the result supports the claim that \(\mu\gt k\).
Find the greatest possible value of \(k\).
(b) A random sample of 8 students is chosen from college \(B\). Their times to complete the same challenge give a sample mean of 79.8 minutes and an unbiased variance estimate of 9.966 minutes \(^{2}\).
Use a 2 -sample test at the \(5 \%\) significance level to test whether the mean time for students at college \(B\) to complete the challenge is the same as the mean time for students at college \(A\) to complete the challenge. You should assume that the two distributions are normal and have the same population variance.