9709 P51 - Jun 2026 - Q3 - 9 marks
Aldeny and Farnlee are two ski resorts. The table shows the number of centimetres of snow that fell each week for the first 15 weeks of last year.
\[\begin{array}{c|rrrrrrrr}\text{Aldeny}&10&18&21&26&35&42&37&36\\\text{Farnlee}&8&11&17&31&26&20&24&21\end{array}\] \[\begin{array}{c|rrrrrrr}\text{Aldeny (continued)}&21&19&22&18&16&7&5\\\text{Farnlee (continued)}&14&36&28&15&22&8&12\end{array}\]
(a) Draw a back-to-back stem-and-leaf diagram to represent this information, with Aldeny on the left-hand side. [4]
(b) Find the median and the interquartile range of the number of centimetres of snow in Aldeny. [3]
The lower quartile, median and upper quartile of the number of centimetres of snow in Farnlee are 12, 20 and 26 respectively.
(c) State two comparisons between the number of centimetres of snow in Aldeny and Farnlee. [2]


9709 P52 - Jun 2026 - Q6 - 8 marks
The heights, in cm, of the 15 rugby players in each of two teams, the Hippos and the Zebras, are shown in the following table.
| Team | Heights (cm) |
|---|---|
| Hippos | 165, 168, 172, 172, 176, 178, 181, 184, 185, 188, 188, 190, 191, 192, 195 |
| Zebras | 183, 192, 172, 167, 184, 189, 171, 194, 191, 179, 186, 182, 177, 175, 186 |
(a) Draw a back-to-back stem-and-leaf diagram to represent this information, with Hippos on the left-hand side. [4]
(b) Find the interquartile range of the heights of the players in the Hippos team. [2]
The player in the Hippos with height 184 cm is injured. A new player replaces him, and this causes the mean height of the 15 players in the team to increase by 0.5 cm.
(c) Find the height of the new player. [2]


9709 P53 - Nov 2025 - Q6 - 10 marks
Last Saturday, a cycling competition for teams of 11 cyclists took place. For each cyclist, the time taken to complete the course was recorded to the nearest minute. The times taken by the cyclists from two teams, the Linnets and the Puffins, are shown in the following table.
| Linnets | 48 | 51 | 54 | 57 | 59 | 60 | 64 | 64 | 65 | 68 | 70 |
|---|---|---|---|---|---|---|---|---|---|---|---|
| Puffins | 45 | 49 | 51 | 55 | 55 | 58 | 59 | 62 | 64 | 64 | 74 |
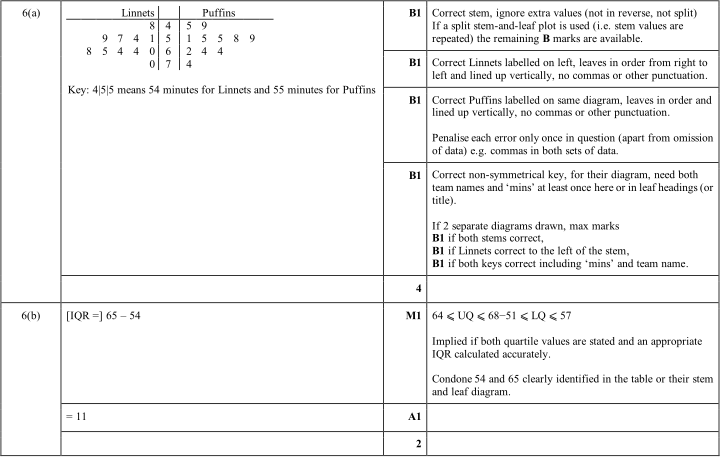
(a) Draw a back-to-back stem-and-leaf diagram to represent this information, with Linnets on the left-hand side. [4]
(b) Find the interquartile range of the times taken by the Linnets. [2]
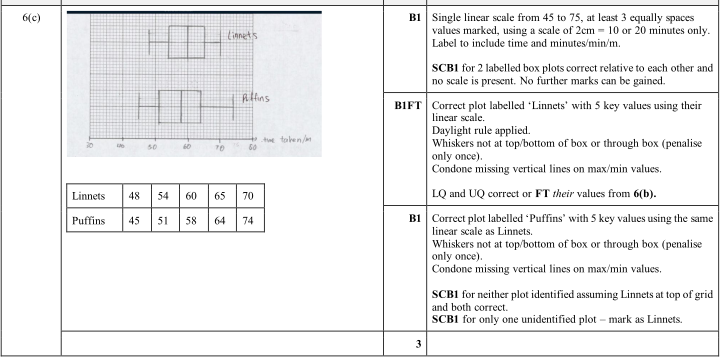
(c) On the grid below, draw a box-and-whisker plot to represent the information for the Linnets and the Puffins. [3]

(d) Make one comparison between the times taken by the Linnets and the times taken by the Puffins. [1]



9709 P55 - Nov 2025 - Q4 - 11 marks
The heights, in cm, of 15 players from each of two sports teams, Pelicans and Swans, are given in the table.
| Pelicans | 156 | 160 | 164 | 165 | 167 | 170 | 171 | 173 | 178 | 182 | 182 | 184 | 185 | 186 | 187 |
|---|---|---|---|---|---|---|---|---|---|---|---|---|---|---|---|
| Swans | 170 | 180 | 183 | 165 | 174 | 158 | 170 | 181 | 162 | 178 | 174 | 163 | 191 | 182 | 174 |
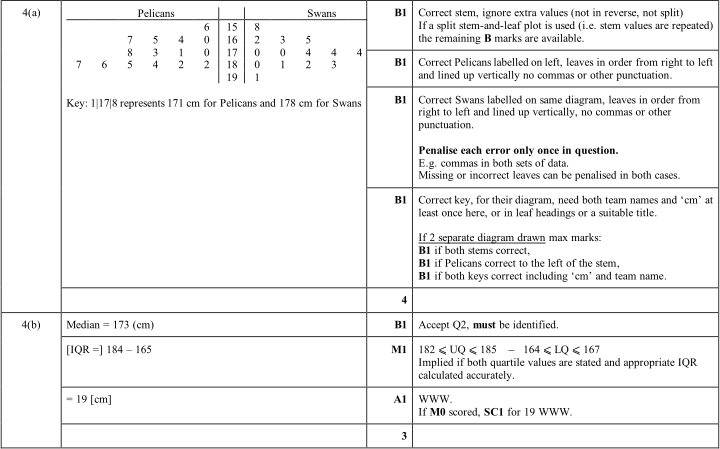
(a) Draw a back-to-back stem-and-leaf diagram to represent the heights of the players from Pelicans and Swans, with Pelicans on the left-hand side. [4]
(b) Find the median and the interquartile range of the heights of the Pelicans. [3]
For the Swans, the lower quartile of the heights is 165 cm, the median is 174 cm and the upper quartile is 181 cm.
(c) Represent the data shown in the back-to-back stem-and-leaf diagram by a pair of box-and-whisker plots in a single diagram. [3]
(d) Make one comparison between the heights of the Pelicans players and the heights of the Swans players. [1]



9709 P51 - Jun 2025 - Q3 - 12 marks
Last Sunday, teams of runners took part in a charity event. The time taken, in seconds, to run 50 m was recorded, correct to 1 decimal place, for each runner. The times recorded for 11 runners from each of the Gulls and the Herons are shown in the table.
| Gulls | 7.9 | 8.2 | 8.3 | 8.6 | 8.6 | 8.8 | 9.2 | 9.7 | 9.8 | 10.0 | 10.4 |
|---|---|---|---|---|---|---|---|---|---|---|---|
| Herons | 9.5 | 9.9 | 8.5 | 8.1 | 9.2 | 10.8 | 8.3 | 9.7 | 9.3 | 9.9 | 8.7 |
(a) Draw a back-to-back stem-and-leaf diagram to represent this information, with Gulls on the left-hand side. [4]
(b) Find the median and the interquartile range of the times of the runners from the Gulls. [3]
Two other teams of runners, the Eagles and the Swifts, also took part in the event. The recorded times in seconds for 20 runners from the Eagles and 30 runners from the Swifts are denoted by \(x\) and \(y\) respectively. It is given that \(\sum x=175.0\) and that the mean of \(y\) is 8.4.
(c) Find the mean of the times taken by all 50 runners. [2]
It is given that \(\sum x^2=1823.0\). It is also known that the standard deviation of the times taken by all 50 runners is 1.38 seconds.
(d) Find the value of \(\sum y^2\), correct to 1 decimal place. [3]


9709 P55 - Jun 2025 - Q5 - 10 marks
The Smarts and the Teasers are two quiz teams that each contain 11 members. Both complete a puzzle and the following table gives the times taken, in minutes, by the members of each team.
| Smarts | 38 | 30 | 13 | 29 | 18 | 22 | 28 | 18 | 11 | 9 | 41 |
|---|---|---|---|---|---|---|---|---|---|---|---|
| Teasers | 39 | 37 | 18 | 36 | 25 | 25 | 32 | 21 | 15 | 12 | 39 |
(a) Represent this information in a back-to-back stem-and-leaf diagram with Smarts on the left-hand side. [4]
For the Teasers, the values of the lower quartile, median and upper quartile are 18, 25 and 37 minutes respectively.
(b) On a single diagram draw box-and-whisker plots for the two teams. [4]
(c) Make two comparisons between the times for the two teams. [2]


Exam-style:stem-and-leaf diagrams — problem 1 · Maths4U Original · 6 marks
Maths4U Original: Exam-style:stem-and-leaf diagrams notes & examples
Maths4U Original · M4U-EXT-9709-S1-T26-P01
The complete data set, measured in minutes, is \(10,13,13,16,19,22,22,25,31\). Treat these nine observations as a population.
| Stem | Leaf |
|---|---|
| 1 | 0 3 3 6 9 |
| 2 | 2 2 5 |
| 3 | 1 |
Key: 2 | 7 represents 27 minutes.
- Find the mean in minutes. Explain your reasoning. [2]
- Find the population variance in square minutes. Explain your reasoning. [2]
- Find the median in minutes. Explain your reasoning. [2]
Exam-style:stem-and-leaf diagrams — problem 2 · Maths4U Original · 6 marks
Maths4U Original: Exam-style:stem-and-leaf diagrams notes & examples
Maths4U Original · M4U-EXT-9709-S1-T26-P02
The complete data set, measured in minutes, is \(11,15,15,19,23,27,27,31,39\). Treat these nine observations as a population.
| Stem | Leaf |
|---|---|
| 1 | 1 5 5 9 |
| 2 | 3 7 7 |
| 3 | 1 9 |
Key: 2 | 7 represents 27 minutes.
- Find the mean in minutes. Explain your reasoning. [2]
- Find the population variance in square minutes. Explain your reasoning. [2]
- Find the median in minutes. Explain your reasoning. [2]