9709 P32 - Jun 2019 - Q10
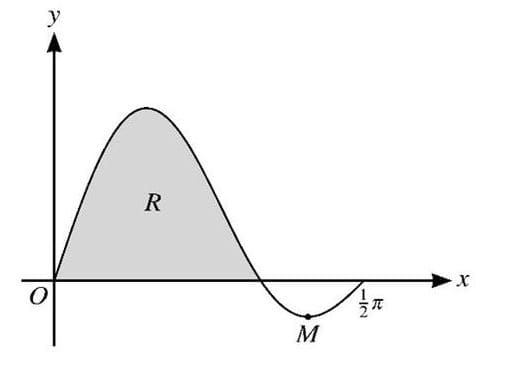
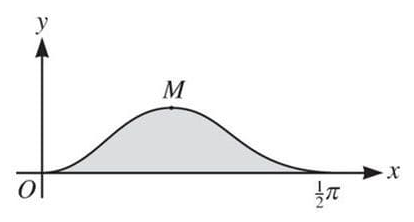
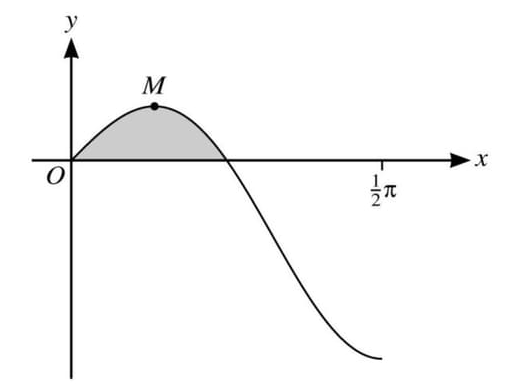
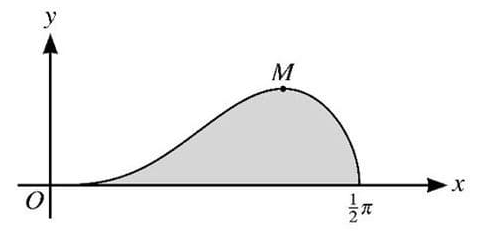
The diagram shows the curve \(y = \sin 3x \cos x\) for \(0 \leq x \leq \frac{1}{2}\pi\) and its minimum point \(M\). The shaded region \(R\) is bounded by the curve and the \(x\)-axis.
(i) By expanding \(\sin(3x + x)\) and \(\sin(3x - x)\) show that \(\sin 3x \cos x = \frac{1}{2}(\sin 4x + \sin 2x)\).
(ii) Using the result of part (i) and showing all necessary working, find the exact area of the region \(R\).
(iii) Using the result of part (i), express \(\frac{dy}{dx}\) in terms of \(\cos 2x\) and hence find the \(x\)-coordinate of \(M\), giving your answer correct to 2 decimal places.
9709 P31 - Nov 2015 - Q10
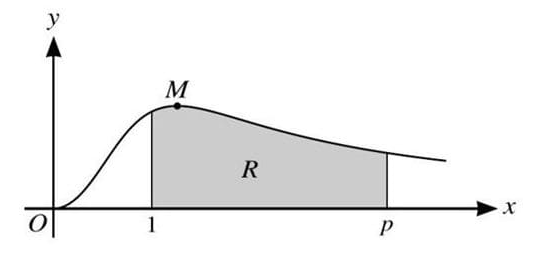
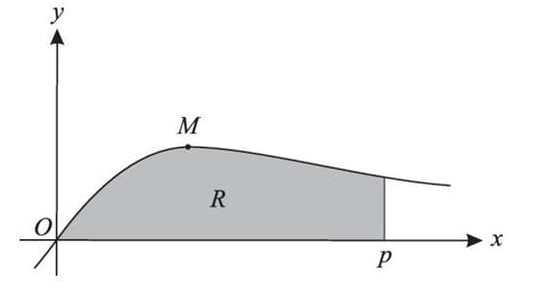
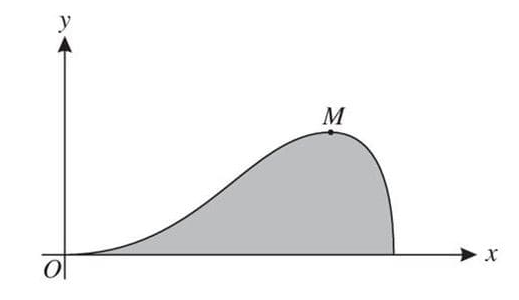
The diagram shows the curve \(y = \frac{x^2}{1 + x^3}\) for \(x \geq 0\), and its maximum point \(M\). The shaded region \(R\) is enclosed by the curve, the \(x\)-axis and the lines \(x = 1\) and \(x = p\).
(i) Find the exact value of the \(x\)-coordinate of \(M\).
(ii) Calculate the value of \(p\) for which the area of \(R\) is equal to 1. Give your answer correct to 3 significant figures.
9709 P31 - Jun 2012 - Q5
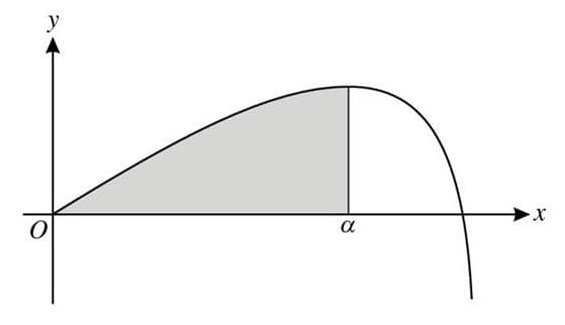
The diagram shows the curve
\(y = 8 \sin \frac{1}{2}x - \tan \frac{1}{2}x\)
for \(0 \leq x < \pi\). The \(x\)-coordinate of the maximum point is \(\alpha\) and the shaded region is enclosed by the curve and the lines \(x = \alpha\) and \(y = 0\).
(i) Show that \(\alpha = \frac{2}{3}\pi\).
(ii) Find the exact value of the area of the shaded region.
9709 P33 - Jun 2010 - Q5
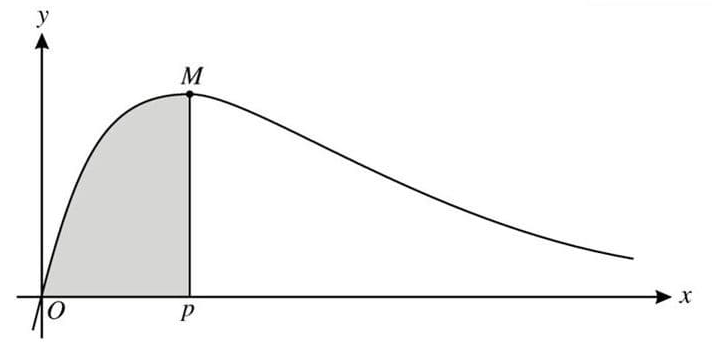
The diagram shows the curve \(y = e^{-x} - e^{-2x}\) and its maximum point \(M\). The \(x\)-coordinate of \(M\) is denoted by \(p\).
(i) Find the exact value of \(p\).
(ii) Show that the area of the shaded region bounded by the curve, the \(x\)-axis and the line \(x = p\) is equal to \(\frac{1}{8}\).
9709 P3 - Jun 2005 - Q9
The diagram shows part of the curve \(y = \frac{x}{x^2 + 1}\) and its maximum point \(M\). The shaded region \(R\) is bounded by the curve and by the lines \(y = 0\) and \(x = p\).
- Calculate the \(x\)-coordinate of \(M\).
- Find the area of \(R\) in terms of \(p\).
- Hence calculate the value of \(p\) for which the area of \(R\) is 1, giving your answer correct to 3 significant figures.
9709 P31 - Nov 2023 - Q9
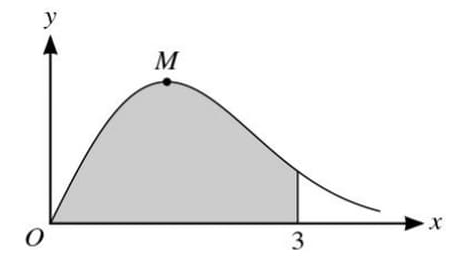
The diagram shows the curve \(y = xe^{-\frac{1}{4}x^2}\), for \(x \geq 0\), and its maximum point \(M\).
(a) Find the exact coordinates of \(M\).
(b) Using the substitution \(x = \sqrt{u}\), or otherwise, find by integration the exact area of the shaded region bounded by the curve, the \(x\)-axis and the line \(x = 3\).
9709 P33 - Jun 2013 - Q9
The diagram shows the curve \(y = \\sin^2 2x \\cos x\) for \(0 \leq x \leq \frac{1}{2} \pi\), and its maximum point \(M\).
(i) Find the \(x\)-coordinate of \(M\).
(ii) Using the substitution \(u = \\sin x\), find by integration the area of the shaded region bounded by the curve and the \(x\)-axis.
9709 P33 - Jun 2011 - Q8
The diagram shows the curve \(y = 5 \sin^3 x \cos^2 x\) for \(0 \leq x \leq \frac{1}{2} \pi\), and its maximum point \(M\).
(i) Find the \(x\)-coordinate of \(M\).
(ii) Using the substitution \(u = \cos x\), find by integration the area of the shaded region bounded by the curve and the \(x\)-axis.
9709 P3 - Jun 2009 - Q10
The diagram shows the curve \(y = x^2 \sqrt{1-x^2}\) for \(x \geq 0\) and its maximum point \(M\).
(i) Find the exact value of the \(x\)-coordinate of \(M\).
(ii) Show, by means of the substitution \(x = \sin \theta\), that the area \(A\) of the shaded region between the curve and the \(x\)-axis is given by
\(A = \frac{1}{4} \int_0^{\frac{\pi}{2}} \sin^2 2\theta \ d\theta.\)
(iii) Hence obtain the exact value of \(A\).
9709 P32 - Jun 2023 - Q10
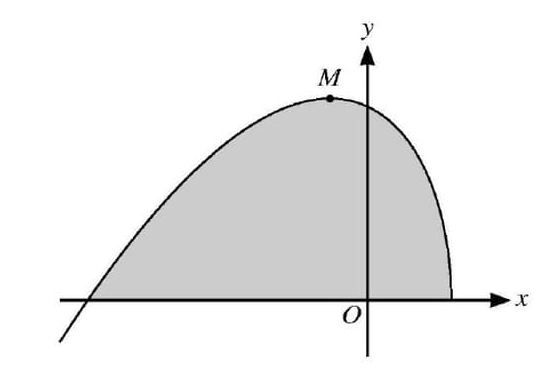
The diagram shows the curve \(y = (x + 5) \sqrt{3 - 2x}\) and its maximum point \(M\).
(a) Find the exact coordinates of \(M\).
(b) Using the substitution \(u = 3 - 2x\), find by integration the area of the shaded region bounded by the curve and the \(x\)-axis. Give your answer in the form \(a \sqrt{13}\), where \(a\) is a rational number.
9709 P32 - Nov 2022 - Q8
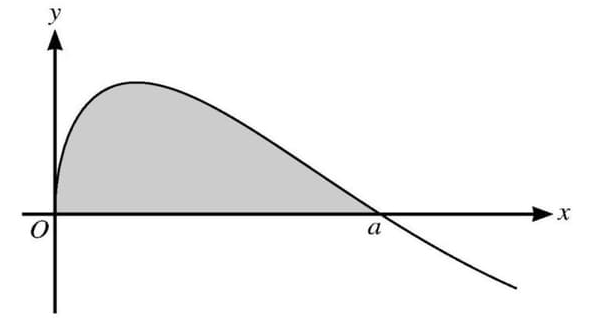
The diagram shows part of the curve \(y = \\sin \\sqrt{x}\). This part of the curve intersects the x-axis at the point where \(x = a\).
(a) State the exact value of \(a\).
(b) Using the substitution \(u = \\sqrt{x}\), find the exact area of the shaded region in the first quadrant bounded by this part of the curve and the x-axis.
9709 P32 - Mar 2022 - Q11
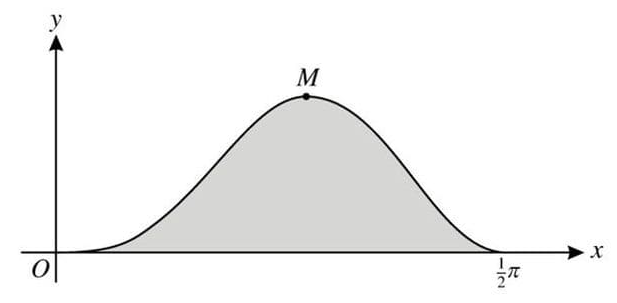
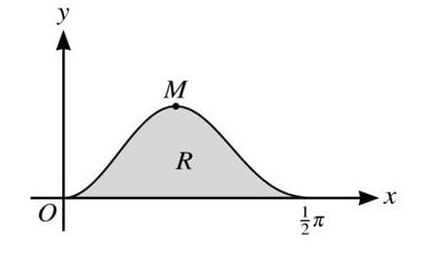
The diagram shows the curve \(y = \sin x \cos 2x\) for \(0 \leq x \leq \frac{1}{2}\pi\), and its maximum point \(M\).
(a) Find the \(x\)-coordinate of \(M\), giving your answer correct to 3 significant figures.
(b) Using the substitution \(u = \cos x\), find the area of the shaded region enclosed by the curve and the \(x\)-axis in the first quadrant, giving your answer in a simplified exact form.
9709 P32 - Jun 2020 - Q6
The diagram shows the curve \(y = \frac{x}{1 + 3x^4}\), for \(x \geq 0\), and its maximum point \(M\).
(a) Find the \(x\)-coordinate of \(M\), giving your answer correct to 3 decimal places.
(b) Using the substitution \(u = \sqrt{3}x^2\), find by integration the exact area of the shaded region bounded by the curve, the \(x\)-axis and the line \(x = 1\).

9709 P32 - Mar 2019 - Q10
The diagram shows the curve \(y = \\sin^3 x \\sqrt{\\cos x}\) for \(0 \leq x \leq \frac{1}{2} \pi\), and its maximum point \(M\).
(i) Using the substitution \(u = \\cos x\), find by integration the exact area of the shaded region bounded by the curve and the \(x\)-axis.
(ii) Showing all your working, find the \(x\)-coordinate of \(M\), giving your answer correct to 3 decimal places.
9709 P31 - Nov 2018 - Q7
The diagram shows the curve \(y = 5 \sin^2 x \cos^3 x\) for \(0 \leq x \leq \frac{1}{2} \pi\), and its maximum point \(M\). The shaded region \(R\) is bounded by the curve and the \(x\)-axis.
(i) Find the \(x\)-coordinate of \(M\), giving your answer correct to 3 decimal places.
(ii) Using the substitution \(u = \sin x\) and showing all necessary working, find the exact area of \(R\).
9709 P31 - Jun 2017 - Q10
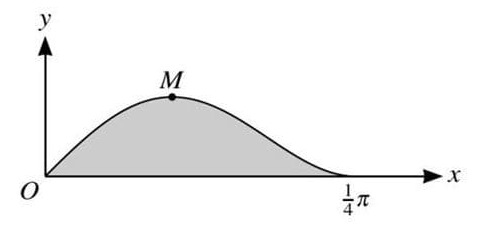
The diagram shows the curve \(y = \\sin x \\cos^2 2x\) for \(0 \leq x \leq \frac{1}{4} \pi\) and its maximum point \(M\).
(i) Using the substitution \(u = \\cos x\), find by integration the exact area of the shaded region bounded by the curve and the \(x\)-axis.
(ii) Find the \(x\)-coordinate of \(M\). Give your answer correct to 2 decimal places.
9709 P33 - Jun 2014 - Q9
The diagram shows the curve \(y = e^{2\sin x} \cos x\) for \(0 \leq x \leq \frac{1}{2}\pi\), and its maximum point \(M\).
(i) Using the substitution \(u = \sin x\), find the exact value of the area of the shaded region bounded by the curve and the axes.
(ii) Find the \(x\)-coordinate of \(M\), giving your answer correct to 3 decimal places.
9709 P32 - Jun 2012 - Q9
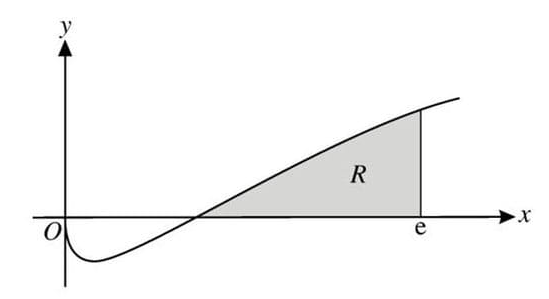
The diagram shows the curve \(y = x^{\frac{1}{2}} \ln x\). The shaded region between the curve, the x-axis and the line \(x = e\) is denoted by \(R\).
(i) Find the equation of the tangent to the curve at the point where \(x = 1\), giving your answer in the form \(y = mx + c\).
(ii) Find by integration the volume of the solid obtained when the region \(R\) is rotated completely about the x-axis. Give your answer in terms of \(\pi\) and \(e\).
9709 P3 - Jun 2008 - Q9
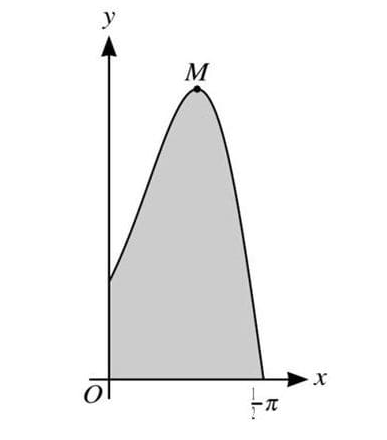
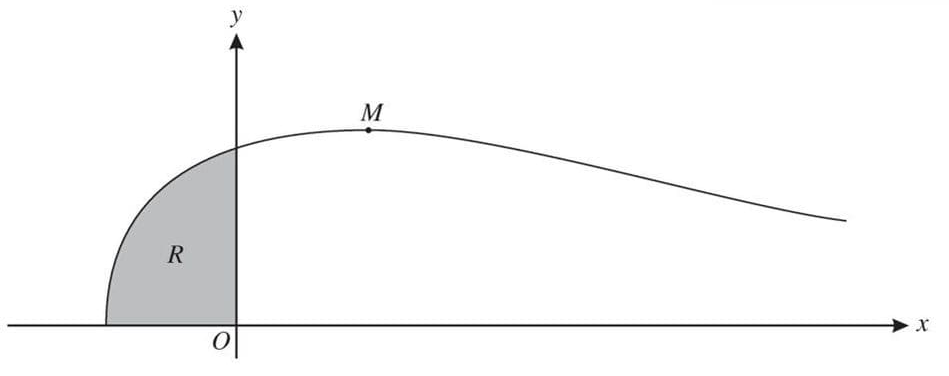
The diagram shows the curve \(y = e^{-\frac{1}{2}x} \sqrt{1 + 2x}\) and its maximum point \(M\). The shaded region between the curve and the axes is denoted by \(R\).
(i) Find the \(x\)-coordinate of \(M\).
(ii) Find by integration the volume of the solid obtained when \(R\) is rotated completely about the \(x\)-axis. Give your answer in terms of \(\pi\) and \(e\).
9709 P32 - Mar 2022 - Q8
(a) Find the quotient and remainder when \(8x^3 + 4x^2 + 2x + 7\) is divided by \(4x^2 + 1\).
(b) Hence find the exact value of \(\int_0^{\frac{1}{2}} \frac{8x^3 + 4x^2 + 2x + 7}{4x^2 + 1} \, dx\).
9709 P3 - Nov 2007 - Q1
Find the exact value of the constant k for which \(\int_{1}^{k} \frac{1}{2x-1} \, dx = 1\).
9709 P3 - Jun 2007 - Q5
(i) Express \(\cos \theta + (\sqrt{3}) \sin \theta\) in the form \(R \cos(\theta - \alpha)\), where \(R > 0\) and \(0 < \alpha < \frac{1}{2} \pi\), giving the exact values of \(R\) and \(\alpha\).
(ii) Hence show that \(\int_{0}^{\frac{1}{2}\pi} \frac{1}{(\cos \theta + (\sqrt{3}) \sin \theta)^2} \, d\theta = \frac{1}{\sqrt{3}}\).
9709 P31 - Nov 2019 - Q9
(i) By first expanding \(\cos(2x + x)\), show that \(\cos 3x \equiv 4 \cos^3 x - 3 \cos x\).
(ii) Hence solve the equation \(\cos 3x + 3 \cos x + 1 = 0\), for \(0 \leq x \leq \pi\).
(iii) Find the exact value of \(\int_{\frac{1}{6}\pi}^{\frac{1}{3}\pi} \cos^3 x \, dx\).
9709 P33 - Jun 2018 - Q7
(i) Express \(\cos \theta + 2 \sin \theta\) in the form \(R \cos(\theta - \alpha)\), where \(R > 0\) and \(0 < \alpha < \frac{1}{2}\pi\). Give the exact values of \(R\) and \(\tan \alpha\).
(ii) Hence, showing all necessary working, show that \(\int_0^{\frac{1}{4}\pi} \frac{15}{(\cos \theta + 2 \sin \theta)^2} \, d\theta = 5.\)
9709 P32 - Jun 2017 - Q7
(i) Prove that if \(y = \frac{1}{\cos \theta}\) then \(\frac{dy}{d\theta} = \sec \theta \tan \theta\).
(ii) Prove the identity \(\frac{1 + \sin \theta}{1 - \sin \theta} \equiv 2 \sec^2 \theta + 2 \sec \theta \tan \theta - 1\).
(iii) Hence find the exact value of \(\int_{0}^{\frac{\pi}{4}} \frac{1 + \sin \theta}{1 - \sin \theta} \, d\theta\).
9709 P33 - Jun 2013 - Q4
(i) Express \((\sqrt{3}) \cos x + \sin x\) in the form \(R \cos(x - \alpha)\), where \(R > 0\) and \(0 < \alpha < \frac{1}{2}\pi\), giving the exact values of \(R\) and \(\alpha\).
(ii) Hence show that
\(\int_{\frac{1}{6}\pi}^{\frac{1}{2}\pi} \frac{1}{((\sqrt{3}) \cos x + \sin x)^2} \, dx = \frac{1}{4}\sqrt{3}.\)
9709 P31 - Jun 2013 - Q9
(i) Express \(4 \cos \theta + 3 \sin \theta\) in the form \(R \cos(\theta - \alpha)\), where \(R > 0\) and \(0 < \alpha < \frac{1}{2}\pi\). Give the value of \(\alpha\) correct to 4 decimal places.
(ii) Hence
(a) solve the equation \(4 \cos \theta + 3 \sin \theta = 2\) for \(0 < \theta < 2\pi\),
(b) find \(\int \frac{50}{(4 \cos \theta + 3 \sin \theta)^2} \, d\theta\).
9709 P33 - Nov 2012 - Q7
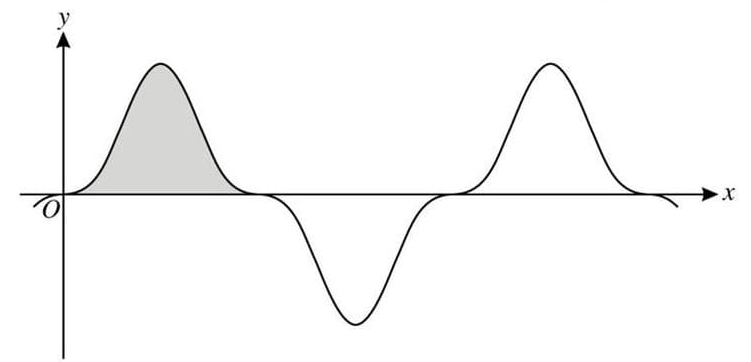
The diagram shows part of the curve \(y = \\sin^3 2x \\cos^3 2x\). The shaded region shown is bounded by the curve and the \(x\)-axis and its exact area is denoted by \(A\).
(i) Use the substitution \(u = \\sin 2x\) in a suitable integral to find the value of \(A\). [6]
(ii) Given that \(\\int_0^{k\\pi} |\\sin^3 2x \\cos^3 2x| \, dx = 40A\), find the value of the constant \(k\). [2]
9709 P31 - Nov 2012 - Q5
(i) By differentiating \(\frac{1}{\cos x}\), show that if \(y = \sec x\) then \(\frac{dy}{dx} = \sec x \tan x\).
(ii) Show that \(\frac{1}{\sec x - \tan x} \equiv \sec x + \tan x\).
(iii) Deduce that \(\frac{1}{(\sec x - \tan x)^2} \equiv 2 \sec^2 x - 1 + 2 \sec x \tan x\).
(iv) Hence show that \(\int_0^{\frac{1}{4}\pi} \frac{1}{(\sec x - \tan x)^2} \, dx = \frac{1}{4}(8\sqrt{2} - \pi)\).
9709 P33 - Nov 2011 - Q10
(i) Use the substitution \(u = \tan x\) to show that, for \(n \neq -1\),
\(\int_0^{\frac{\pi}{4}} (\tan^{n+2} x + \tan^n x) \, dx = \frac{1}{n+1}.\)
(ii) Hence find the exact value of
(a) \(\int_0^{\frac{\pi}{4}} (\sec^4 x - \sec^2 x) \, dx,\)
(b) \(\int_0^{\frac{\pi}{4}} (\tan^9 x + 5 \tan^7 x + 5 \tan^5 x + \tan^3 x) \, dx.\)