Exam-Style Problems
⬅ Back to SubchapterNov 2023 p52 q4
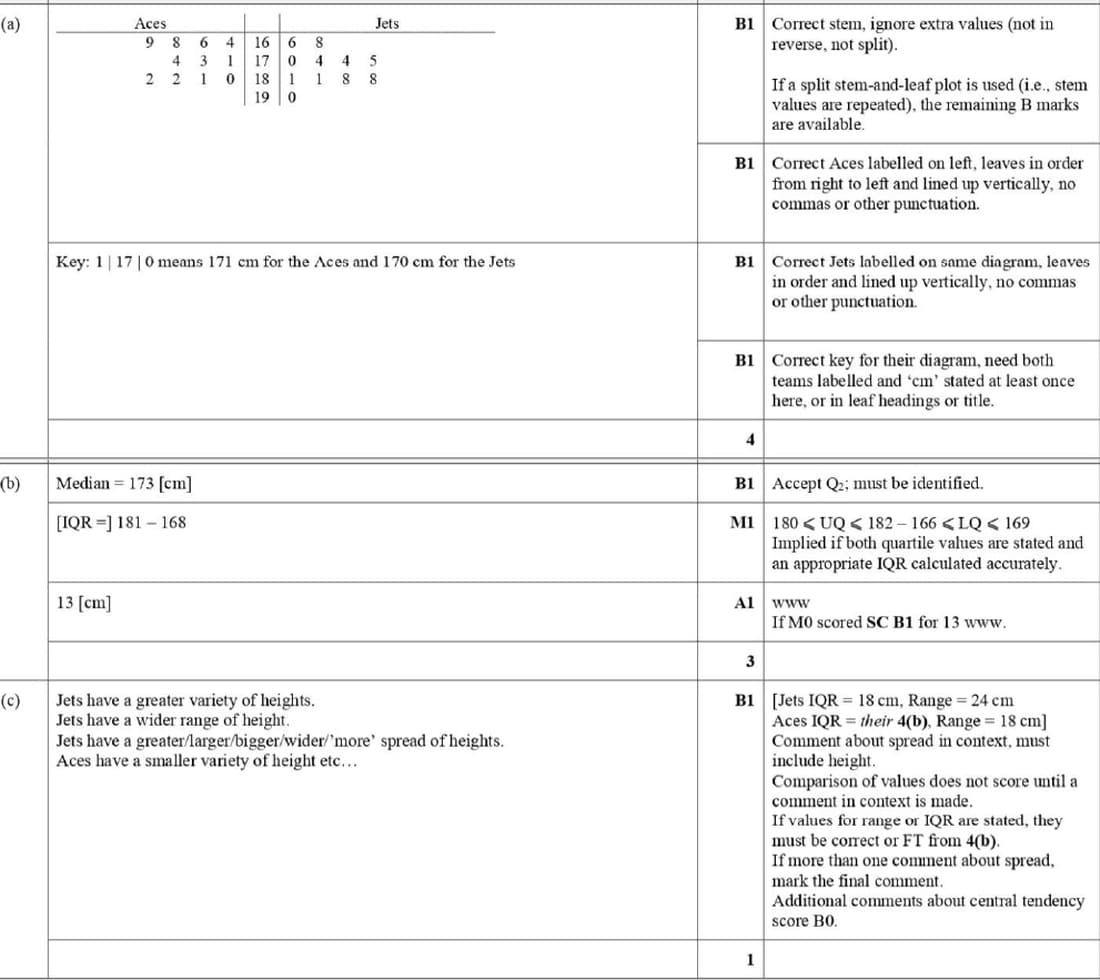
The heights, in cm, of the 11 players in each of two teams, the Aces and the Jets, are shown in the following table.
| Aces | 180 | 174 | 169 | 182 | 181 | 166 | 173 | 182 | 168 | 171 | 164 |
|---|---|---|---|---|---|---|---|---|---|---|---|
| Jets | 175 | 174 | 188 | 168 | 166 | 174 | 181 | 181 | 170 | 188 | 190 |
- Draw a back-to-back stem-and-leaf diagram to represent this information with the Aces on the left-hand side of the diagram.
- Find the median and the interquartile range of the heights of the players in the Aces.
- Give one comment comparing the spread of the heights of the Aces with the spread of the heights of the Jets.
Nov 2018 p63 q7
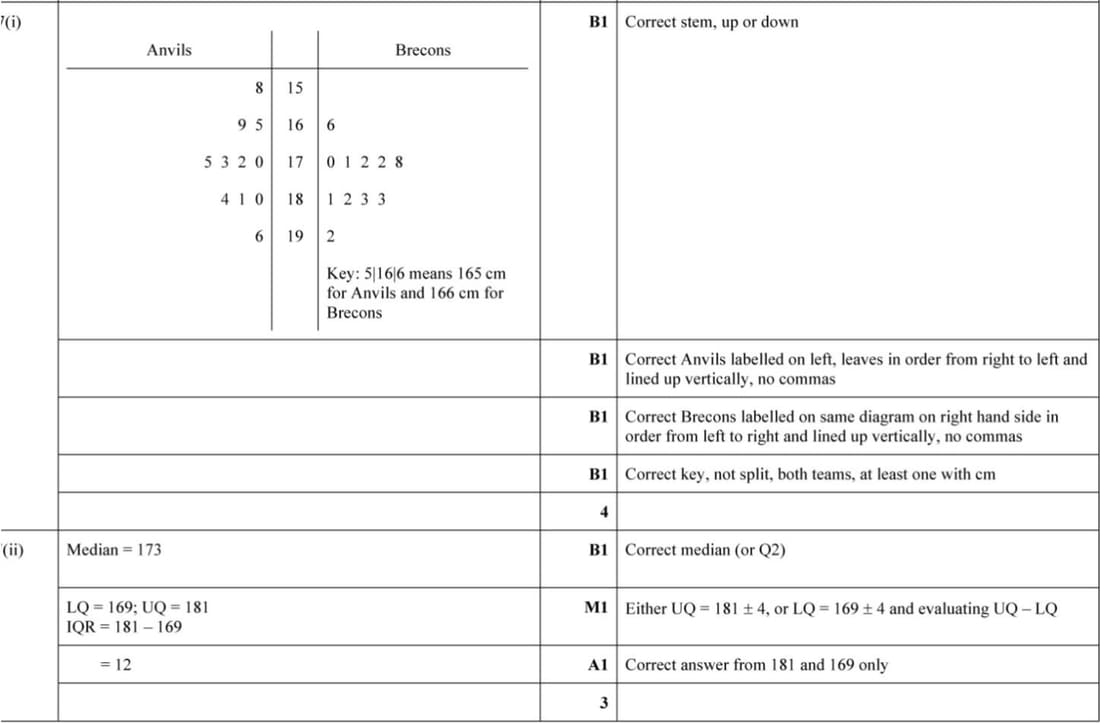
The heights, in cm, of the 11 members of the Anvils athletics team and the 11 members of the Brecons swimming team are shown below.
| Anvils | 173 | 158 | 180 | 196 | 175 | 165 | 170 | 169 | 181 | 184 | 172 |
|---|---|---|---|---|---|---|---|---|---|---|---|
| Brecons | 166 | 170 | 171 | 172 | 178 | 181 | 182 | 183 | 183 | 192 |
- Draw a back-to-back stem-and-leaf diagram to represent this information, with Anvils on the left-hand side of the diagram and Brecons on the right-hand side.
- Find the median and the interquartile range for the heights of the Anvils.
Nov 2017 p63 q5
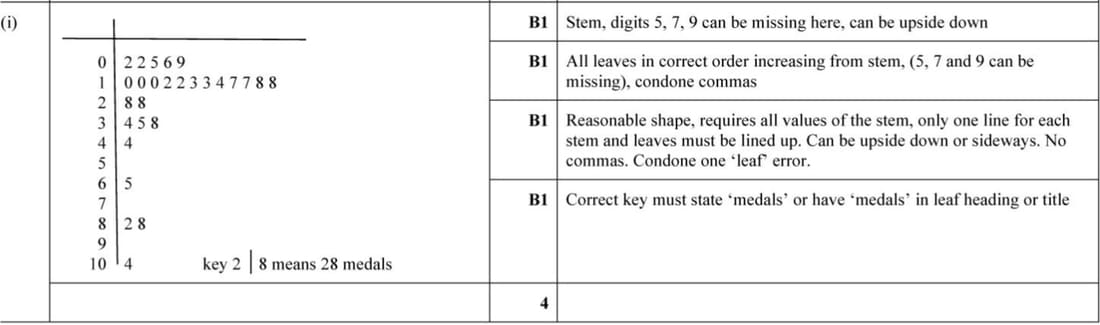
The number of Olympic medals won in the 2012 Olympic Games by the top 27 countries is shown below.
104, 88, 82, 65, 44, 38, 35, 34, 28, 28, 18, 18, 17, 17, 14, 13, 13, 12, 12, 10, 10, 10, 9, 6, 5, 2, 2
Draw a stem-and-leaf diagram to illustrate the data.
Nov 2016 p61 q7
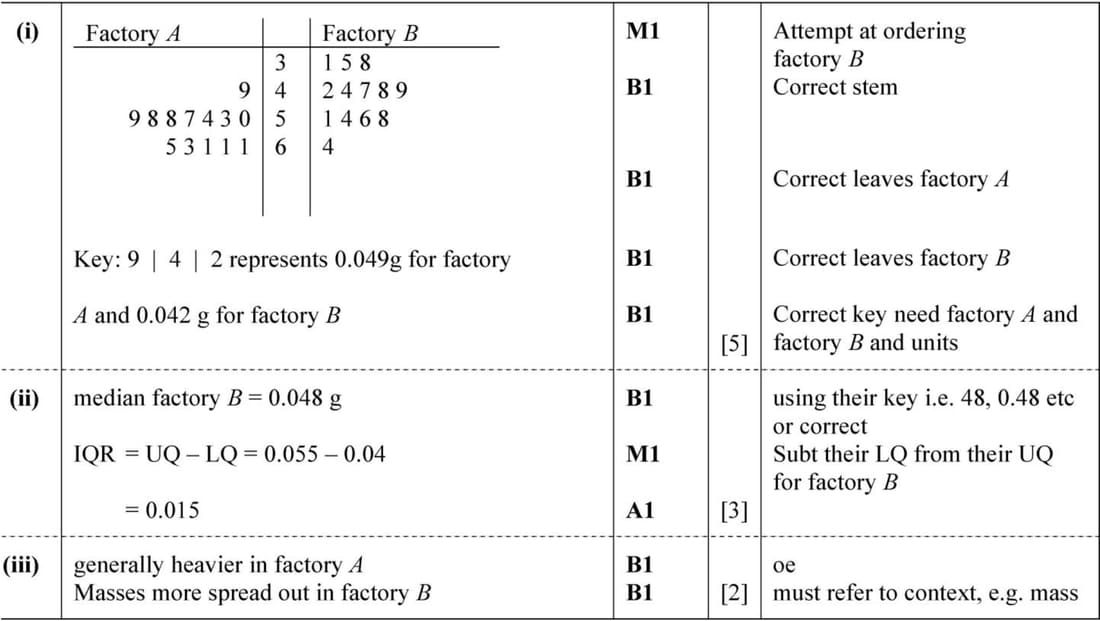
The masses, in grams, of components made in factory A and components made in factory B are shown below.
Factory A
| 0.049 | 0.050 | 0.053 | 0.054 | 0.057 | 0.058 | 0.058 |
| 0.059 | 0.061 | 0.061 | 0.061 | 0.063 | 0.065 |
Factory B
| 0.031 | 0.056 | 0.049 | 0.044 | 0.038 | 0.048 | 0.051 |
| 0.064 | 0.035 | 0.042 | 0.047 | 0.054 | 0.058 |
(i) Draw a back-to-back stem-and-leaf diagram to represent the masses of components made in the two factories.
(ii) Find the median and the interquartile range for the masses of components made in factory B.
(iii) Make two comparisons between the masses of components made in factory A and the masses of those made in factory B.
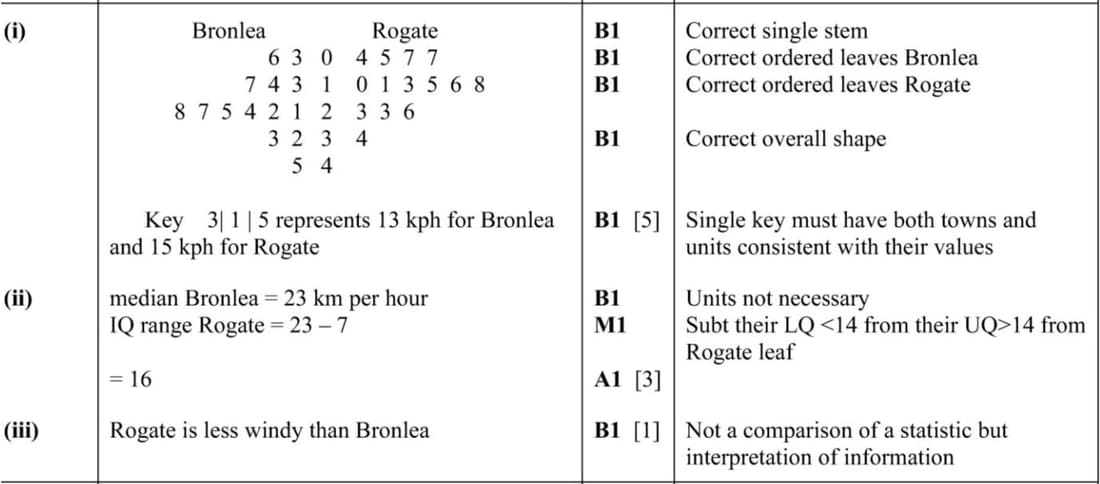
June 2016 p62 q5
The following are the maximum daily wind speeds in kilometres per hour for the first two weeks in April for two towns, Bronlea and Rogate.
| Bronlea | 21 | 45 | 6 | 33 | 27 | 3 | 32 | 14 | 28 | 24 | 13 | 17 | 25 | 22 |
|---|---|---|---|---|---|---|---|---|---|---|---|---|---|---|
| Rogate | 7 | 5 | 4 | 15 | 23 | 7 | 11 | 13 | 26 | 18 | 23 | 16 | 10 | 34 |
- Draw a back-to-back stem-and-leaf diagram to represent this information.
- Write down the median of the maximum wind speeds for Bronlea and find the interquartile range for Rogate.
- Use your diagram to make one comparison between the maximum wind speeds in the two towns.
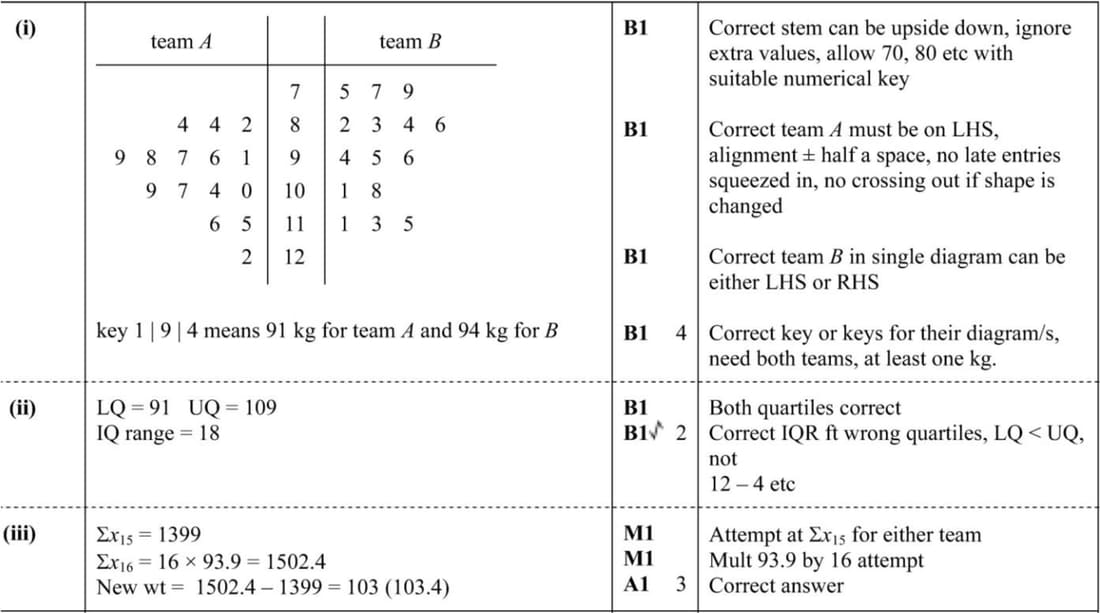
Nov 2015 p62 q5
The weights, in kilograms, of the 15 rugby players in each of two teams, A and B, are shown below.
| Team A | 97 | 98 | 104 | 84 | 100 | 109 | 115 | 99 | 122 | 82 | 116 | 96 | 84 | 107 | 91 |
|---|---|---|---|---|---|---|---|---|---|---|---|---|---|---|---|
| Team B | 75 | 79 | 94 | 101 | 96 | 77 | 111 | 108 | 83 | 84 | 86 | 115 | 82 | 113 | 95 |
- Represent the data by drawing a back-to-back stem-and-leaf diagram with team A on the left-hand side of the diagram and team B on the right-hand side.
- Find the interquartile range of the weights of the players in team A.
- A new player joins team B as a substitute. The mean weight of the 16 players in team B is now \(93.9\ \text{kg}\). Find the weight of the new player.
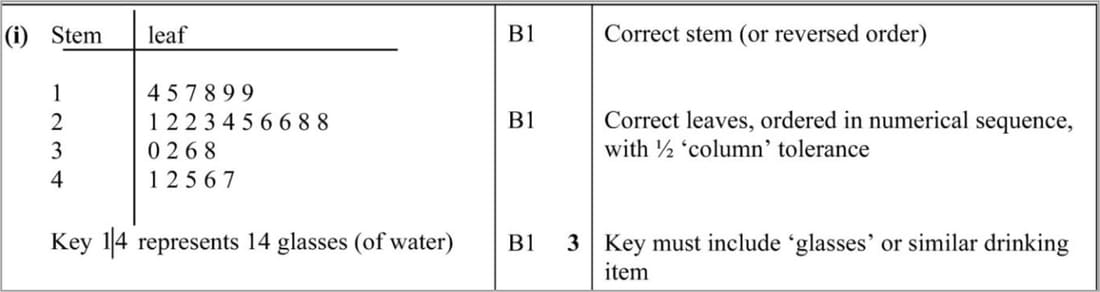
Nov 2014 p63 q4i
A random sample of 25 people recorded the number of glasses of water they drank in a particular week. The results are shown below.
23, 19, 32, 14, 25, 22, 26, 36, 45, 42, 47, 28, 17, 38, 15, 46, 18, 26, 22, 41, 19, 21, 28, 24, 30
Draw a stem-and-leaf diagram to represent the data.
June 2014 p63 q1
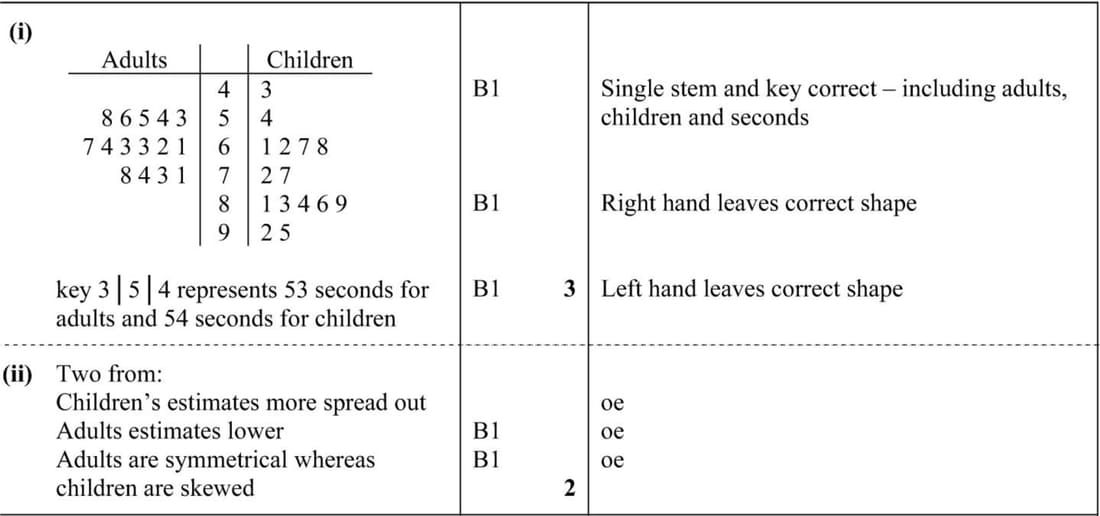
Some adults and some children each tried to estimate, without using a watch, the number of seconds that had elapsed in a fixed time-interval. Their estimates are shown below.
| Adults | 55 | 58 | 67 | 74 | 63 | 61 | 63 | 71 | 56 | 53 | 54 | 78 | 73 | 64 | 62 |
|---|---|---|---|---|---|---|---|---|---|---|---|---|---|---|---|
| Children | 86 | 95 | 89 | 72 | 61 | 84 | 77 | 92 | 81 | 54 | 43 | 68 | 62 | 67 | 83 |
- Draw a back-to-back stem-and-leaf diagram to represent the data.
- Make two comparisons between the estimates of the adults and the children.
June 2013 p62 q5
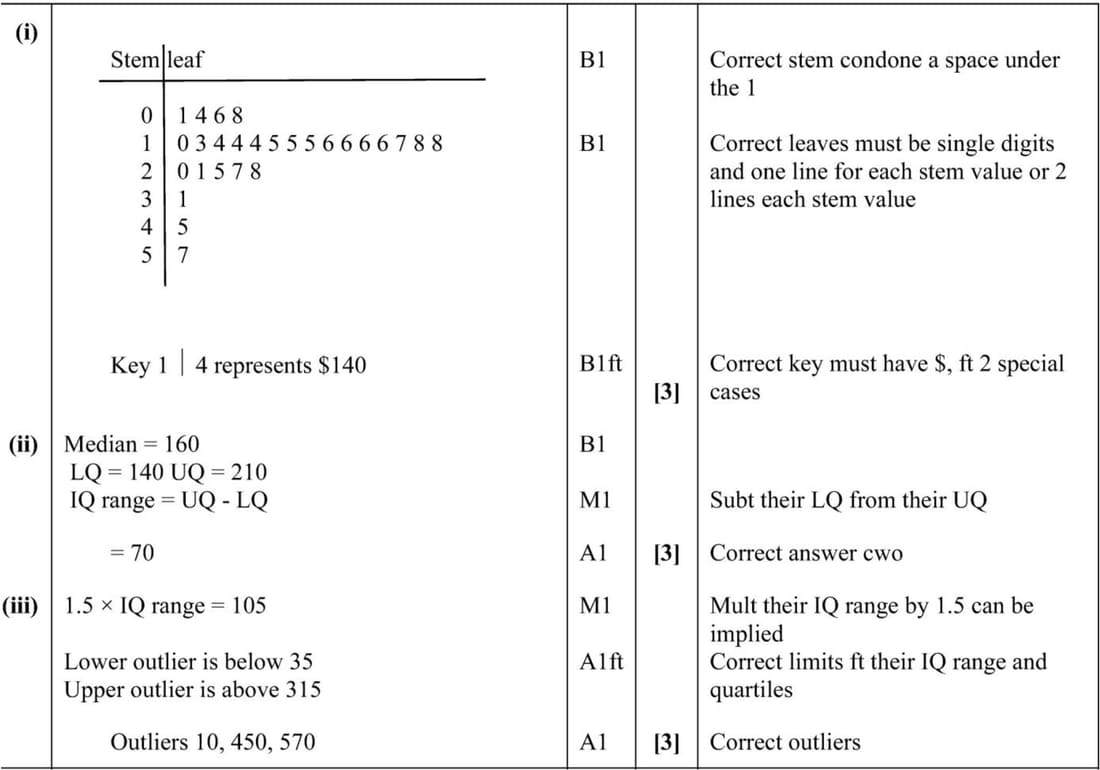
The following are the annual amounts of money spent on clothes, to the nearest $10, by 27 people.
| 10 | 40 | 60 | 80 | 100 | 130 | 140 | 140 | 140 |
| 150 | 150 | 150 | 160 | 160 | 160 | 160 | 170 | 180 |
| 180 | 200 | 210 | 250 | 270 | 280 | 310 | 450 | 570 |
- Construct a stem-and-leaf diagram for the data.
- Find the median and the interquartile range of the data.
- An ‘outlier’ is defined as any data value which is more than 1.5 times the interquartile range above the upper quartile, or more than 1.5 times the interquartile range below the lower quartile. List the outliers.
Nov 2012 p61 q4
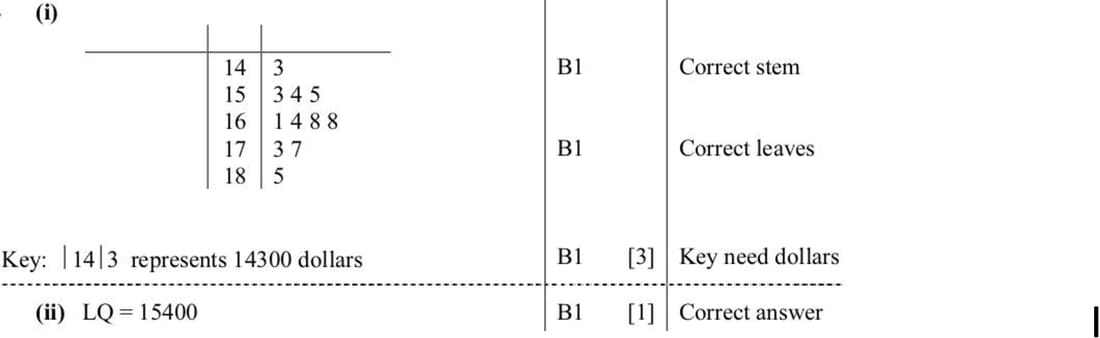
Prices in dollars of 11 caravans in a showroom are as follows.
16 800, 18 500, 17 700, 14 300, 15 500, 15 300, 16 100, 16 800, 17 300, 15 400, 16 400
(i) Represent these prices by a stem-and-leaf diagram.
(ii) Write down the lower quartile of the prices of the caravans in the showroom.
June 2012 p61 q5
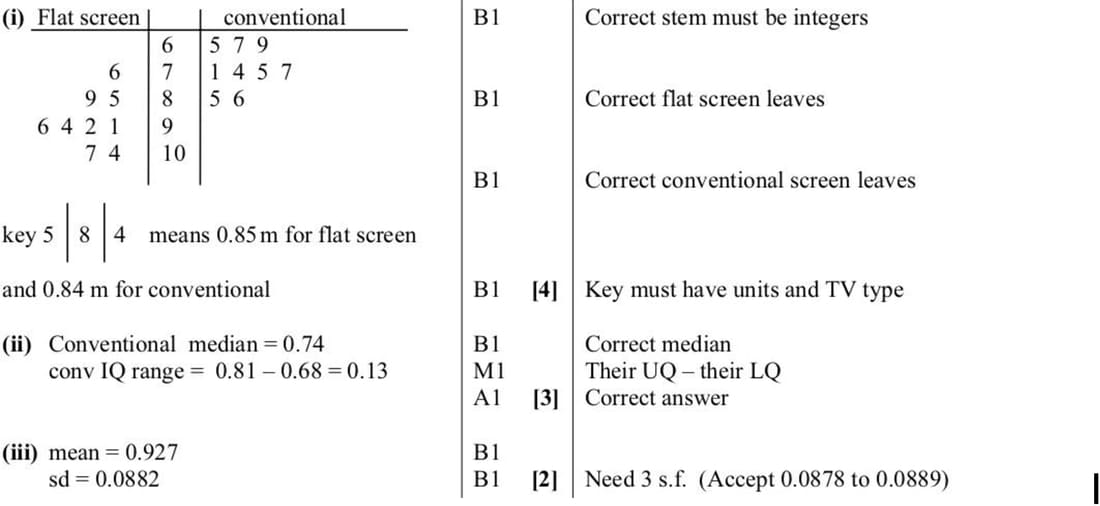
The lengths of the diagonals in metres of the 9 most popular flat screen TVs and the 9 most popular conventional TVs are shown below.
Flat screen: 0.85, 0.94, 0.91, 0.96, 1.04, 0.89, 1.07, 0.92, 0.76
Conventional: 0.69, 0.65, 0.85, 0.77, 0.74, 0.67, 0.71, 0.86, 0.75
- Represent this information on a back-to-back stem-and-leaf diagram.
- Find the median and the interquartile range of the lengths of the diagonals of the 9 conventional TVs.
- Find the mean and standard deviation of the lengths of the diagonals of the 9 flat screen TVs.
June 2023 p53 q4
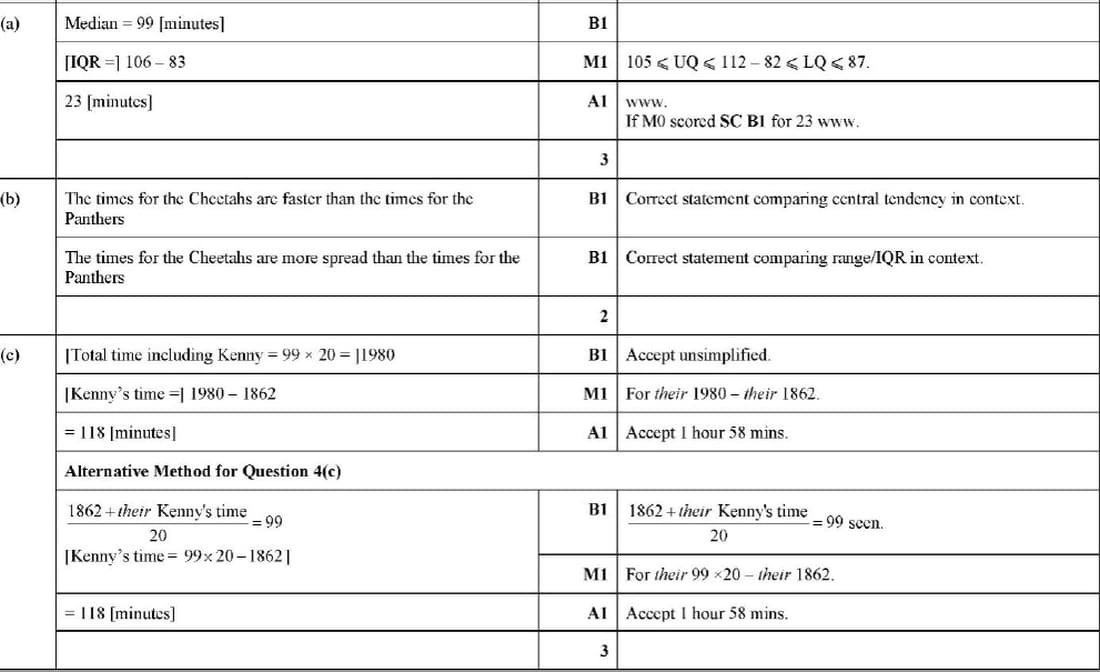
The times taken, in minutes, to complete a cycle race by 19 cyclists from each of two clubs, the Cheetahs and the Panthers, are represented in the following back-to-back stem-and-leaf diagram.
| Cheetahs | Panthers | |
|---|---|---|
| 9 8 | 7 | 4 |
| 8 7 3 2 0 | 8 | 6 8 |
| 9 8 7 | 9 | 1 7 8 8 9 9 |
| 6 5 3 3 | 10 | 2 3 4 4 5 6 |
| 9 8 2 | 11 | 1 2 8 |
| 4 | 12 | 0 6 |
Key: \( 7 \mid 9 \mid 1 \) means 97 minutes for Cheetahs and 91 minutes for Panthers.
(a) Find the median and the interquartile range of the times of the Cheetahs.
The median and interquartile range for the Panthers are 103 minutes and 14 minutes respectively.
(b) Make two comparisons between the times taken by the Cheetahs and the times taken by the Panthers.
Another cyclist, Kenny, from the Cheetahs also took part in the race. The mean time taken by the 20 cyclists from the Cheetahs was 99 minutes.
(c) Find the time taken by Kenny to complete the race.
Nov 2010 p62 q4
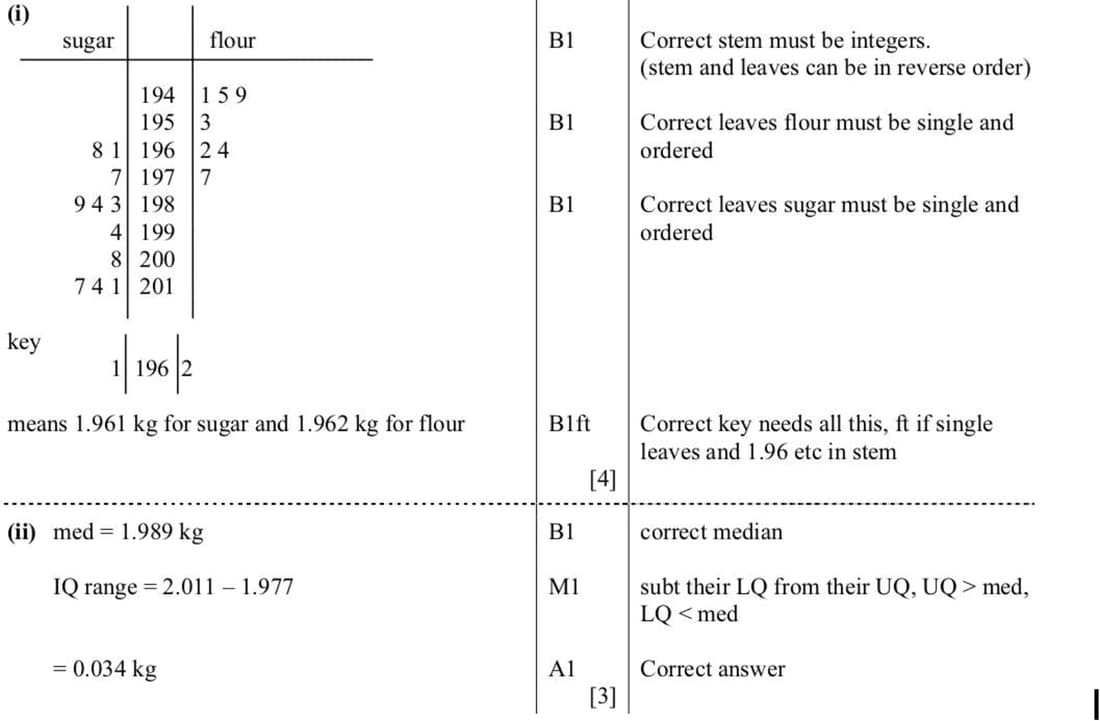
The weights in kilograms of 11 bags of sugar and 7 bags of flour are as follows:
Sugar: 1.961, 1.983, 2.008, 2.014, 1.968, 1.994, 2.011, 2.017, 1.977, 1.984, 1.989
Flour: 1.945, 1.962, 1.949, 1.977, 1.964, 1.941, 1.953
(i) Represent this information on a back-to-back stem-and-leaf diagram with sugar on the left-hand side.
(ii) Find the median and interquartile range of the weights of the bags of sugar.
June 2010 p61 q2
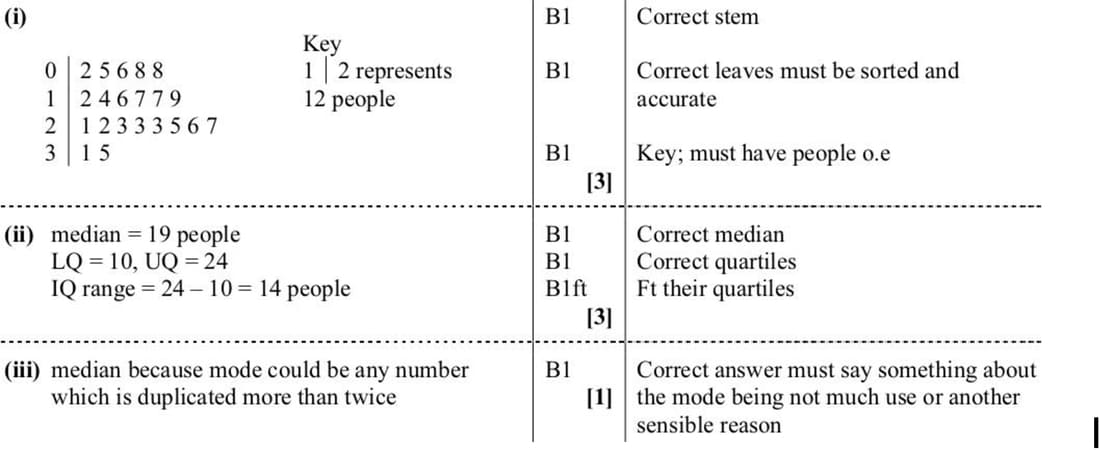
The numbers of people travelling on a certain bus at different times of the day are as follows.
17, 5, 2, 23, 16, 31, 8, 22, 14, 25, 35, 17, 27, 12, 6, 23, 19, 21, 23, 8, 26
(i) Draw a stem-and-leaf diagram to illustrate the information given above. [3]
(ii) Find the median, the lower quartile, the upper quartile and the interquartile range. [3]
(iii) State, in this case, which of the median and mode is preferable as a measure of central tendency, and why. [1]
Nov 2008 p6 q5
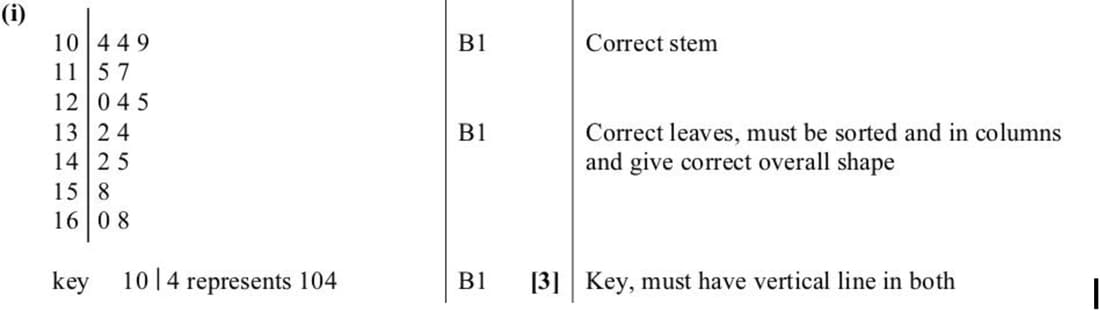
The pulse rates, in beats per minute, of a random sample of 15 small animals are shown in the following table.
115, 120, 158, 132, 125, 104, 142, 160, 145, 104, 162, 117, 109, 124, 134
Draw a stem-and-leaf diagram to represent the data.
June 2008 p6 q1
The stem-and-leaf diagram below represents data collected for the number of hits on an internet site on each day in March 2007. There is one missing value, denoted by \(x\).
Stem-and-leaf diagram:
| Stem | leaf | |
|---|---|---|
| 0 | 0 1 5 6 | (4) |
| 1 | 1 3 5 6 6 8 | (6) |
| 2 | 1 1 2 3 4 4 4 8 9 | (9) |
| 3 | 1 2 2 2 x 8 9 | (7) |
| 4 | 2 5 6 7 9 | (5) |
Key: \( 1 \mid 5 \) represents 15 hits.
(i) Find the median and lower quartile for the number of hits each day.
(ii) The interquartile range is 19. Find the value of \(x\).
June 2007 p6 q4
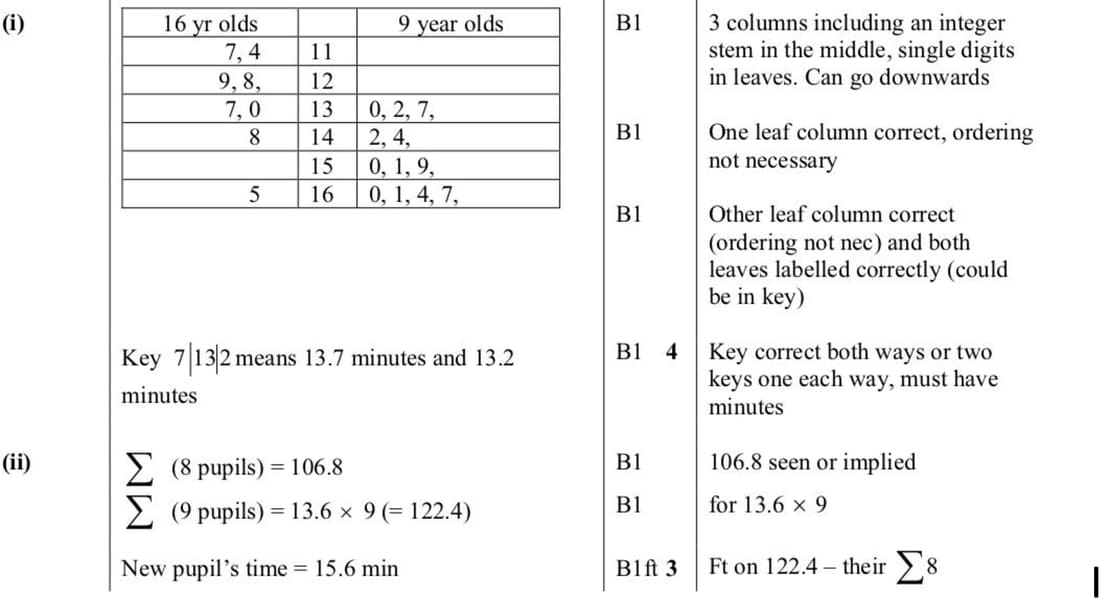
The lengths of time in minutes to swim a certain distance by the members of a class of twelve 9-year-olds and by the members of a class of eight 16-year-olds are shown below.
9-year-olds: 13.0, 16.1, 16.0, 14.4, 15.9, 15.1, 14.2, 13.7, 16.7, 16.4, 15.0, 13.2
16-year-olds: 14.8, 13.0, 11.4, 11.7, 16.5, 13.7, 12.8, 12.9
(i) Draw a back-to-back stem-and-leaf diagram to represent the information above.
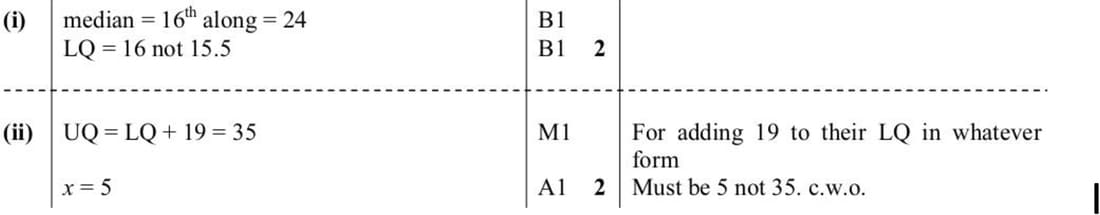
(ii) A new pupil joined the 16-year-old class and swam the distance. The mean time for the class of nine pupils was now 13.6 minutes. Find the new pupil’s time to swim the distance.
June 2003 p6 q1
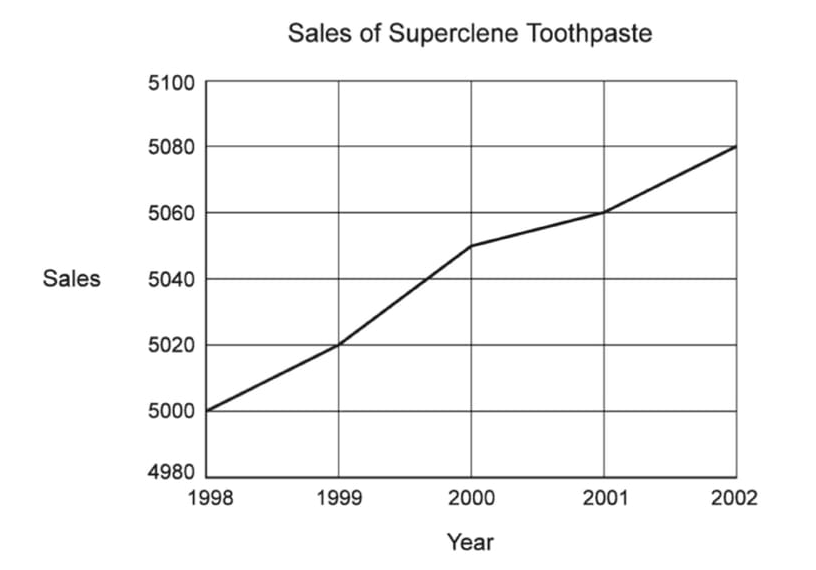
(i) The diagram represents the sales of Superclene toothpaste over the last few years. Give a reason why it is misleading.
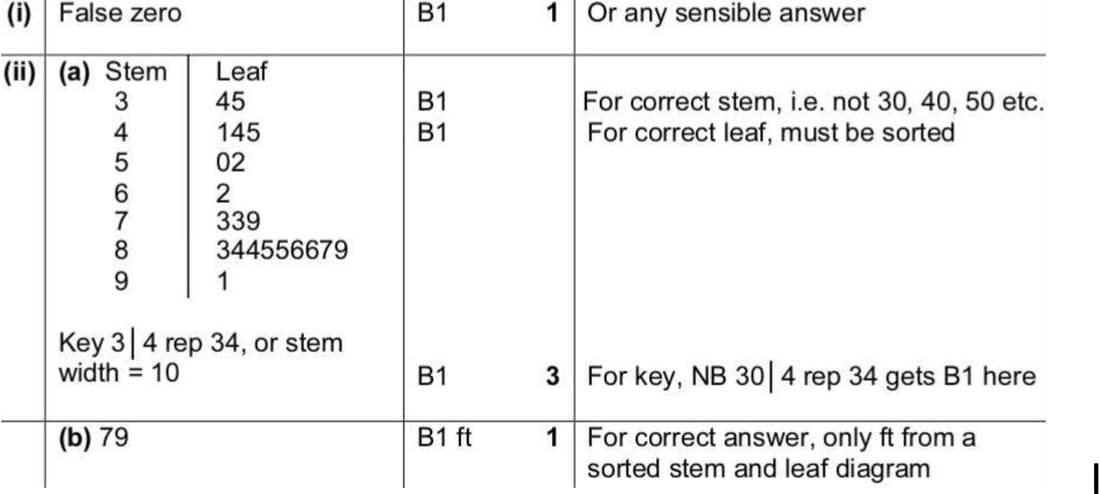
(ii) The following data represent the daily ticket sales at a small theatre during three weeks.
52, 73, 34, 85, 62, 79, 89, 50, 45, 83, 84, 91, 85, 84, 87, 44, 86, 41, 35, 73, 86.
(a) Construct a stem-and-leaf diagram to illustrate the data.
(b) Use your diagram to find the median of the data.
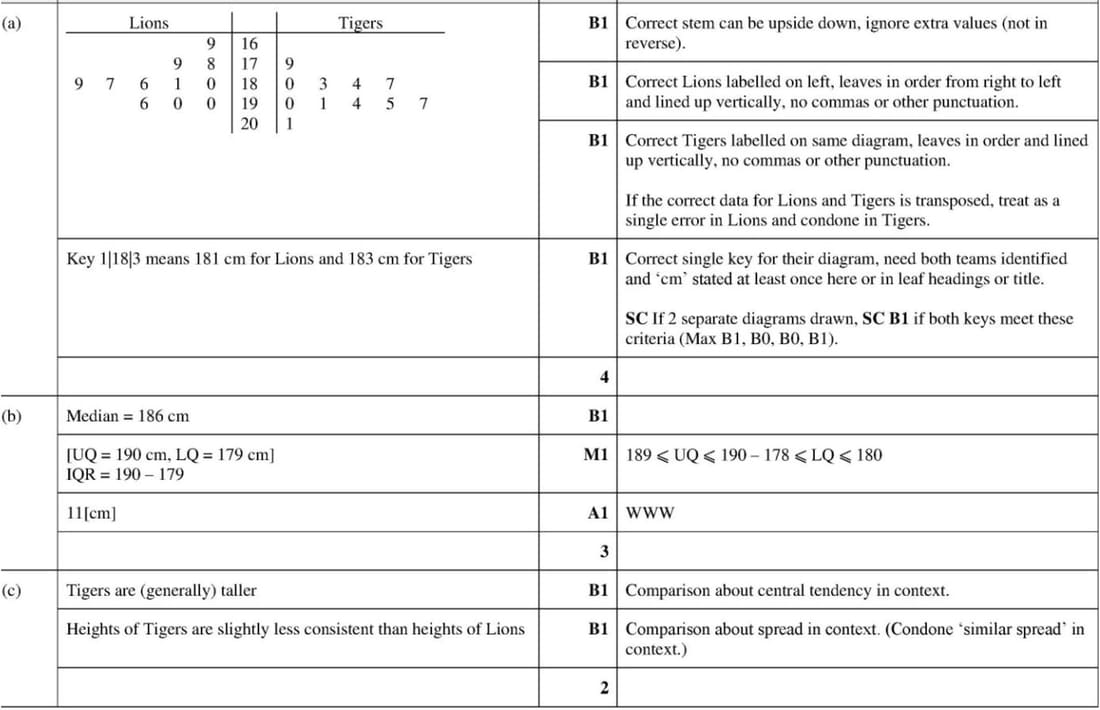
Nov 2022 p51 q3
The Lions and the Tigers are two basketball clubs. The heights, in cm, of the 11 players in each of their first team squads are given in the table.
| Lions | 178 | 186 | 181 | 187 | 179 | 190 | 189 | 190 | 180 | 169 | 196 |
|---|---|---|---|---|---|---|---|---|---|---|---|
| Tigers | 194 | 179 | 187 | 190 | 183 | 201 | 184 | 180 | 195 | 191 | 197 |
- Draw a back-to-back stem-and-leaf diagram to represent this information, with the Lions on the left.
- Find the median and the interquartile range of the heights of the Lions first team squad.
- It is given that for the Tigers, the lower quartile is 183 cm, the median is 190 cm and the upper quartile is 195 cm.
- Make two comparisons between the heights of the players in the Lions first team squad and the heights of the players in the Tigers first team squad.
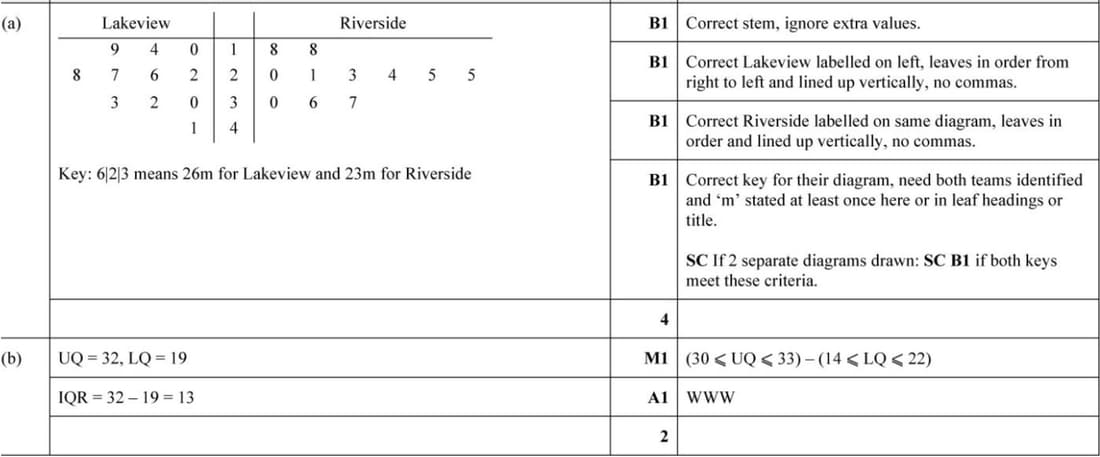
Nov 2021 p53 q2
Lakeview and Riverside are two schools. The pupils at both schools took part in a competition to see how far they could throw a ball. The distances thrown, to the nearest metre, by 11 pupils from each school are shown in the following table.
| Lakeview | 10 | 14 | 19 | 22 | 26 | 27 | 28 | 30 | 32 | 33 | 41 |
|---|---|---|---|---|---|---|---|---|---|---|---|
| Riverside | 23 | 36 | 21 | 18 | 37 | 25 | 18 | 20 | 24 | 30 | 25 |
- Draw a back-to-back stem-and-leaf diagram to represent this information, with Lakeview on the left-hand side.
- Find the interquartile range of the distances thrown by the 11 pupils at Lakeview school.
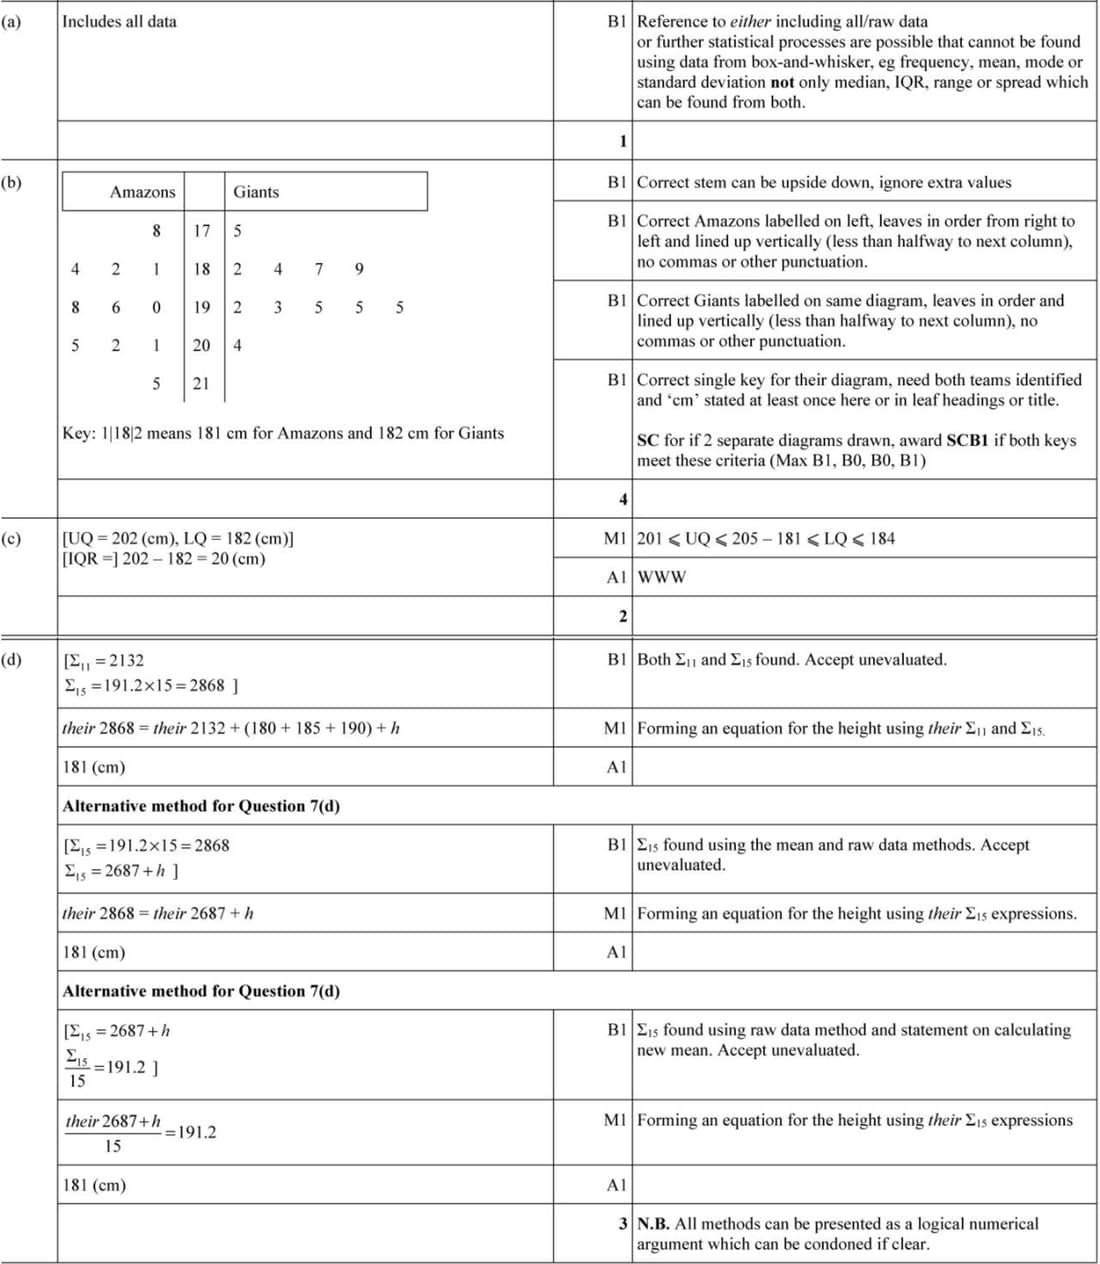
June 2021 p52 q7
The heights, in cm, of the 11 basketball players in each of two clubs, the Amazons and the Giants, are shown below.
| Amazons | 205 | 198 | 181 | 182 | 190 | 215 | 201 | 178 | 202 | 196 | 184 |
|---|---|---|---|---|---|---|---|---|---|---|---|
| Giants | 175 | 182 | 184 | 187 | 189 | 192 | 193 | 195 | 195 | 195 | 204 |
- State one advantage of using a stem-and-leaf diagram compared to a box-and-whisker plot to illustrate this information.
- Represent the data by drawing a back-to-back stem-and-leaf diagram with Amazons on the left-hand side of the diagram.
- Find the interquartile range of the heights of the players in the Amazons.
- Four new players join the Amazons. The mean height of the 15 players in the Amazons is now \(191.2\) cm. The heights of three of the new players are \(180\) cm, \(185\) cm and \(190\) cm. Find the height of the fourth new player.
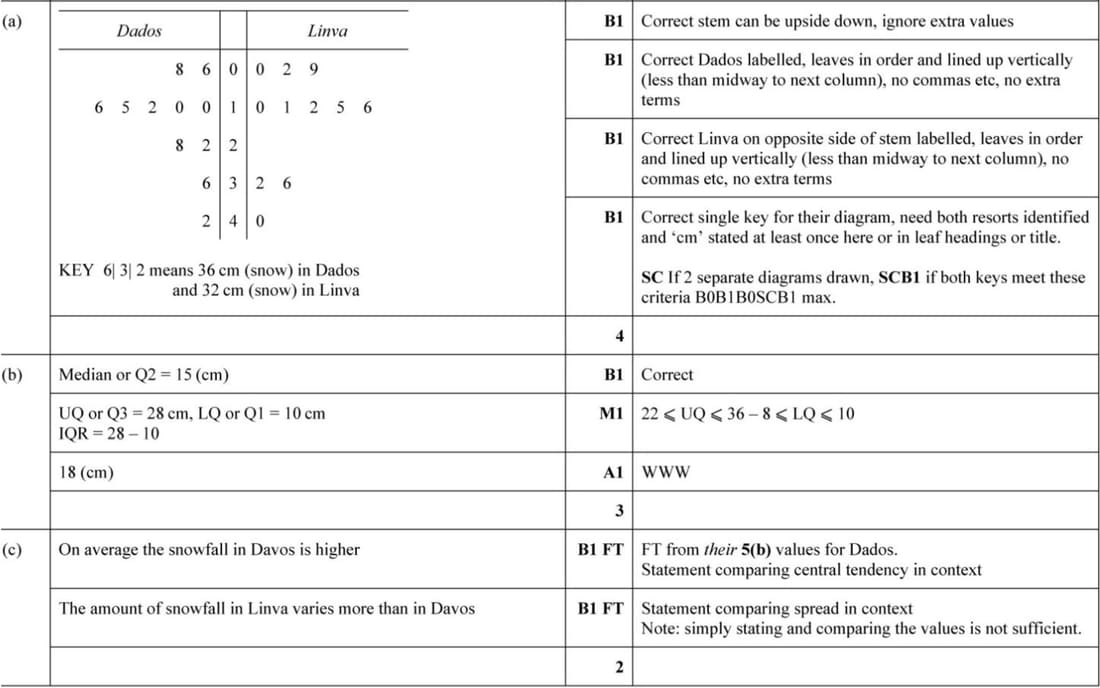
Nov 2020 p52 q5
The following table gives the weekly snowfall, in centimetres, for 11 weeks in 2018 at two ski resorts, Dados and Linva.
| Dados | 6 | 8 | 12 | 15 | 10 | 36 | 42 | 28 | 10 | 22 | 16 |
|---|---|---|---|---|---|---|---|---|---|---|---|
| Linva | 2 | 11 | 15 | 16 | 0 | 32 | 36 | 40 | 10 | 12 | 9 |
- Represent the information in a back-to-back stem-and-leaf diagram.
- Find the median and the interquartile range for the weekly snowfall in Dados.
- The median, lower quartile and upper quartile of the weekly snowfall for Linva are 12, 9 and 32 cm respectively. Use this information and your answers to part (b) to compare the central tendency and the spread of the weekly snowfall in Dados and Linva.
June 2020 p53 q6
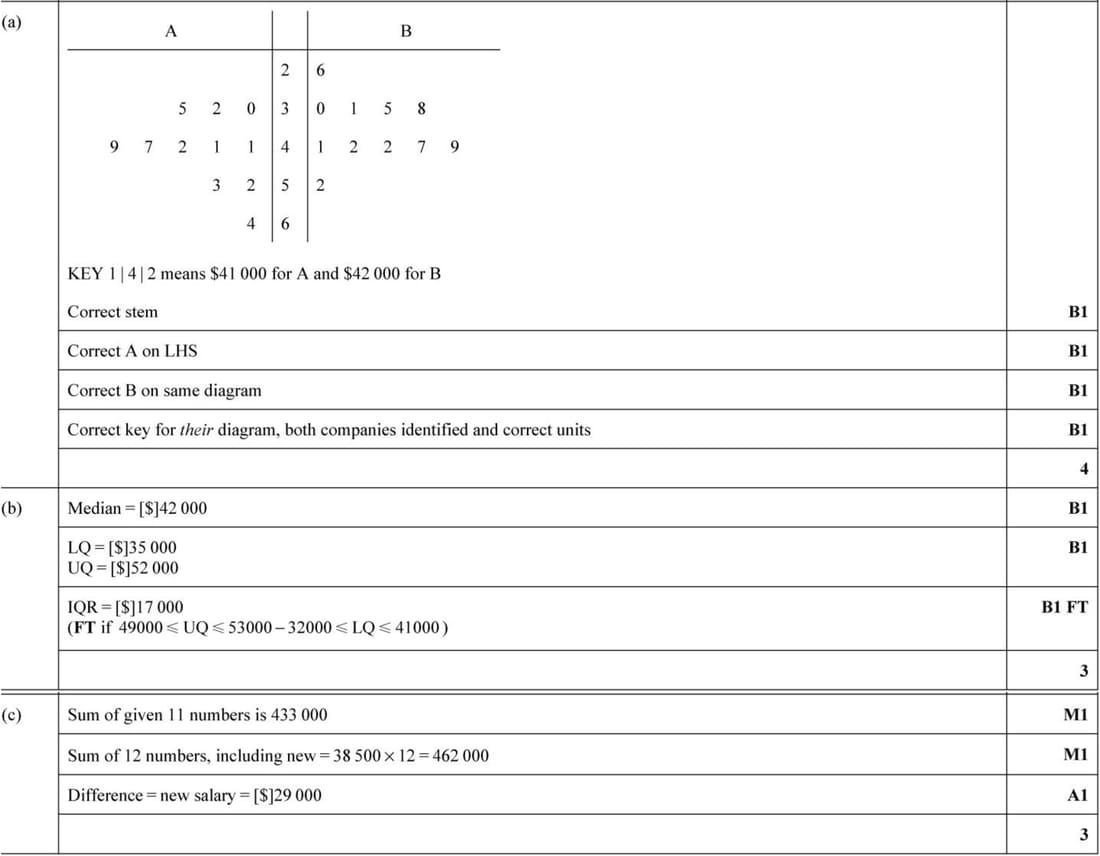
The annual salaries, in thousands of dollars, for 11 employees at each of two companies A and B are shown below.
| Company A | 30 | 32 | 35 | 41 | 41 | 42 | 47 | 49 | 52 | 53 | 64 |
|---|---|---|---|---|---|---|---|---|---|---|---|
| Company B | 26 | 47 | 30 | 52 | 41 | 38 | 35 | 42 | 49 | 31 | 42 |
- Represent the data by drawing a back-to-back stem-and-leaf diagram with company A on the left-hand side of the diagram.
- Find the median and the interquartile range of the salaries of the employees in company A.
- A new employee joins company B. The mean salary of the 12 employees is now $38,500. Find the salary of the new employee.
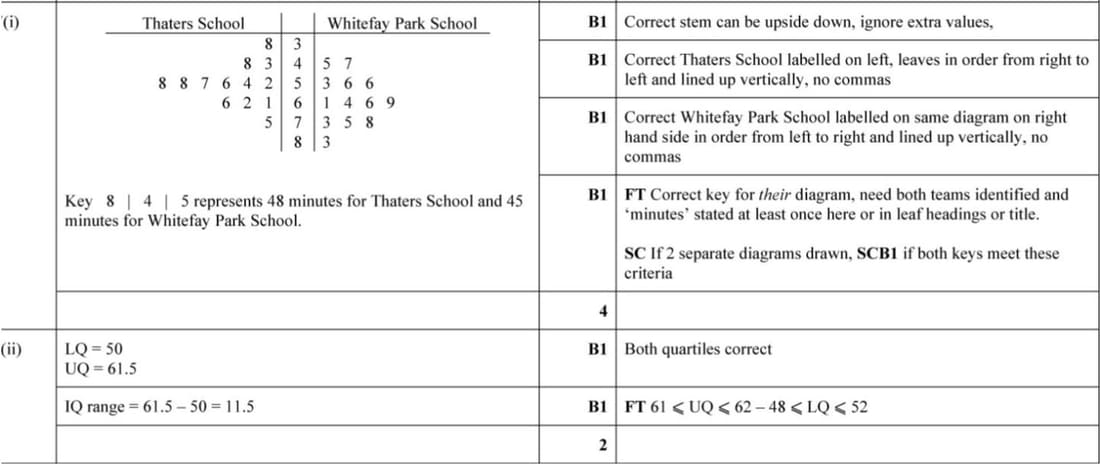
June 2019 p63 q7
The times in minutes taken by 13 pupils at each of two schools in a cross-country race are recorded in the table below.
| Thaters School | 38 | 43 | 48 | 52 | 54 | 56 | 57 | 58 | 58 | 61 | 62 | 66 | 75 |
|---|---|---|---|---|---|---|---|---|---|---|---|---|---|
| Whitefay Park School | 45 | 47 | 53 | 56 | 56 | 61 | 64 | 66 | 69 | 73 | 75 | 78 | 83 |
- Draw a back-to-back stem-and-leaf diagram to illustrate these times with Thaters School on the left.
- Find the interquartile range of the times for pupils at Thaters School.
Feb/Mar 2019 p62 q5
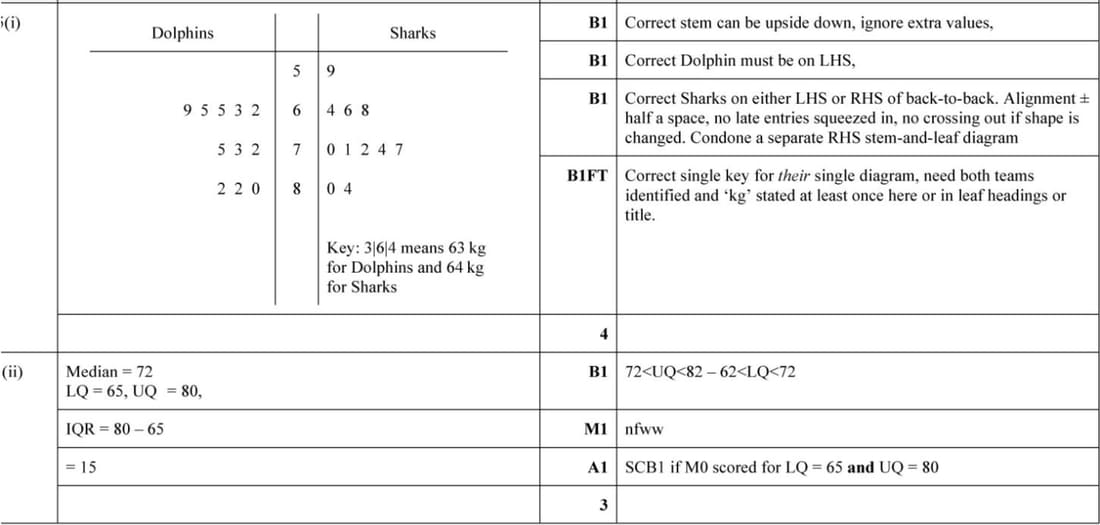
The weights, in kg, of the 11 members of the Dolphins swimming team and the 11 members of the Sharks swimming team are shown below.
| Dolphins | 62 | 75 | 69 | 82 | 63 | 80 | 65 | 65 | 73 | 82 | 72 |
|---|---|---|---|---|---|---|---|---|---|---|---|
| Sharks | 68 | 84 | 59 | 70 | 71 | 64 | 77 | 80 | 66 | 74 | 72 |
- Draw a back-to-back stem-and-leaf diagram to represent this information, with Dolphins on the left-hand side of the diagram and Sharks on the right-hand side.
- Find the median and interquartile range for the Dolphins.