Exam-Style Problems
⬅ Back to SubchapterNov 2023 p41 q3
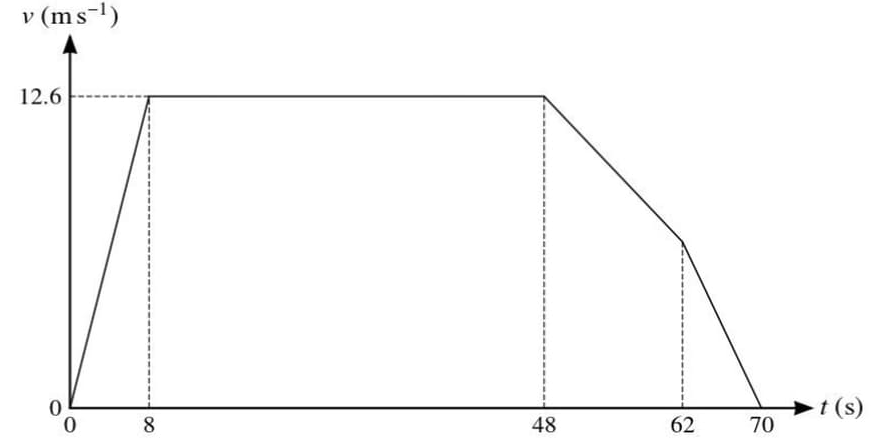
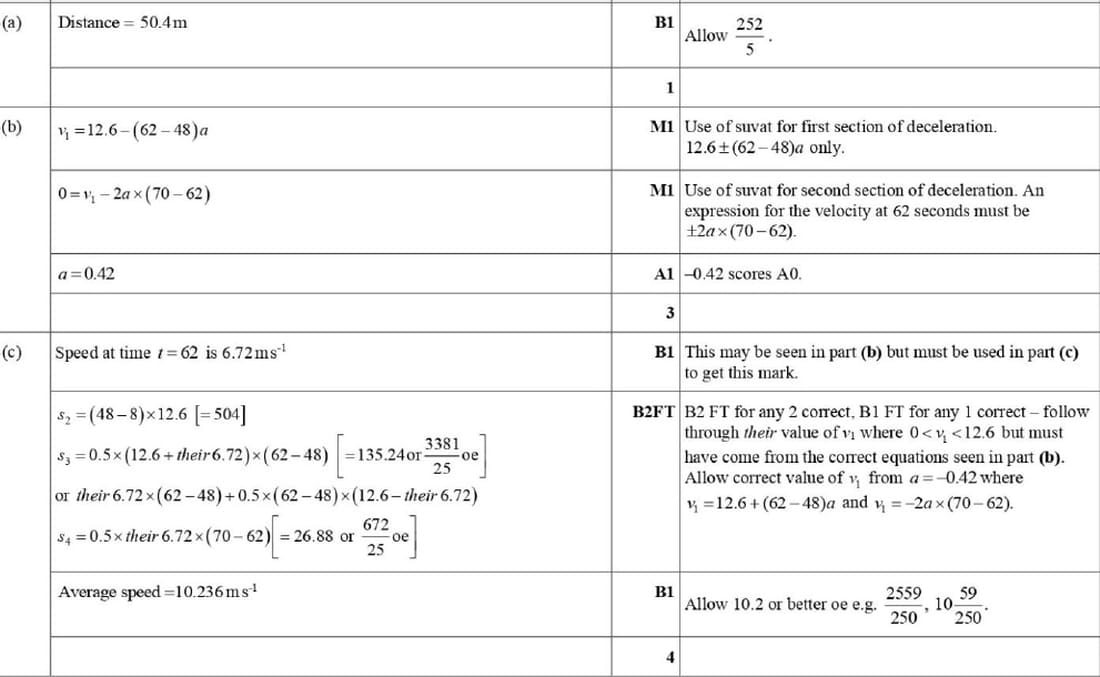
The diagram shows the velocity-time graph for the motion of a bus. The bus starts from rest and accelerates uniformly for 8 seconds until it reaches a speed of 12.6 m/s. The bus maintains this speed for 40 seconds. It then decelerates uniformly in two stages. Between 48 and 62 seconds the bus decelerates at \(a \text{ m/s}^2\) and between 62 and 70 seconds it decelerates at \(2a \text{ m/s}^2\) until coming to rest.
(a) Find the distance covered by the bus in the first 8 seconds.
(b) Find the value of \(a\).
(c) Find the average speed of the bus for the whole journey.
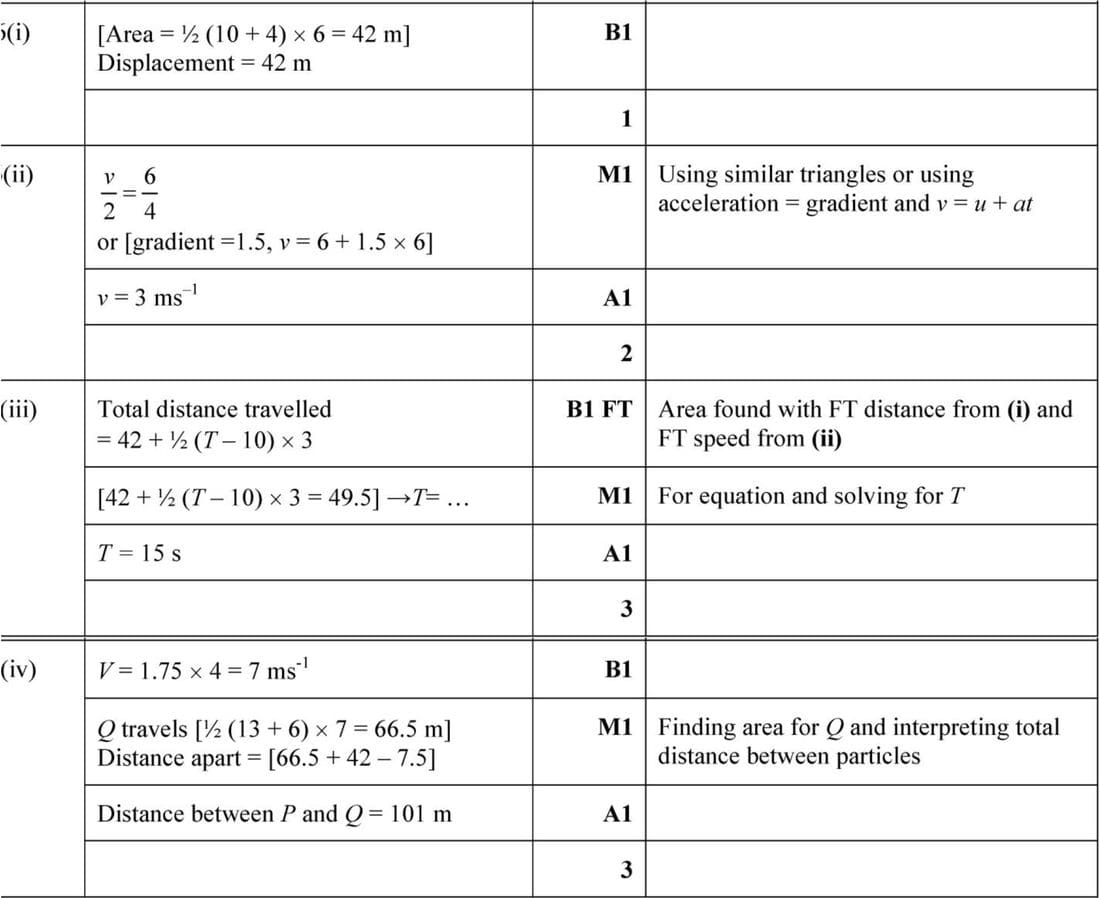
Nov 2017 p43 q6
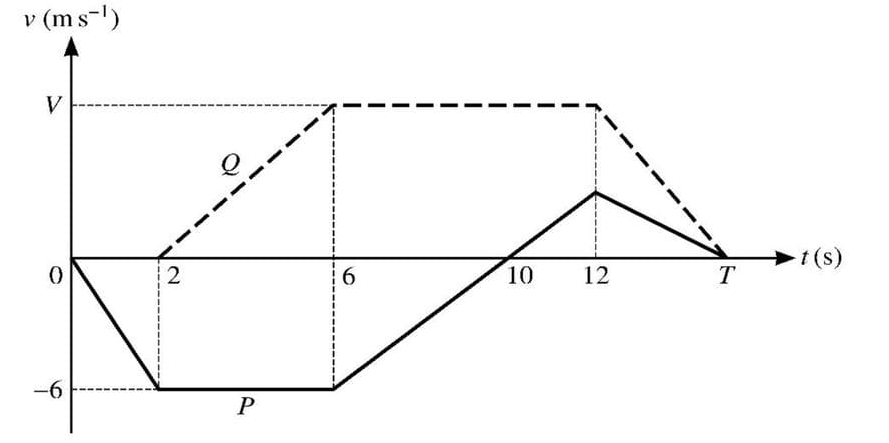
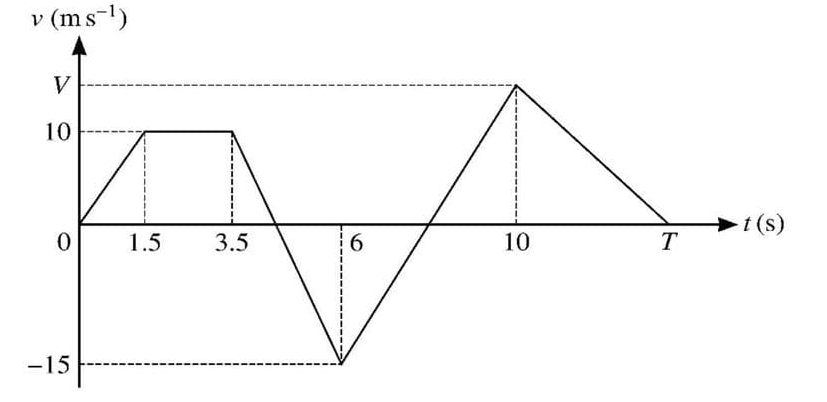
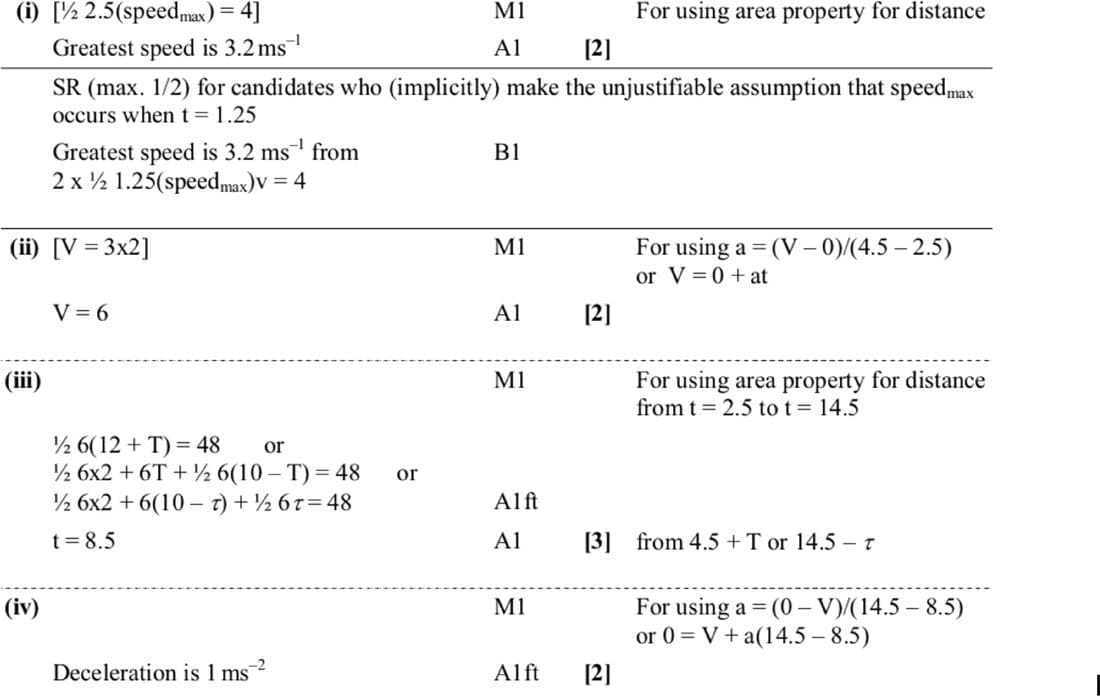
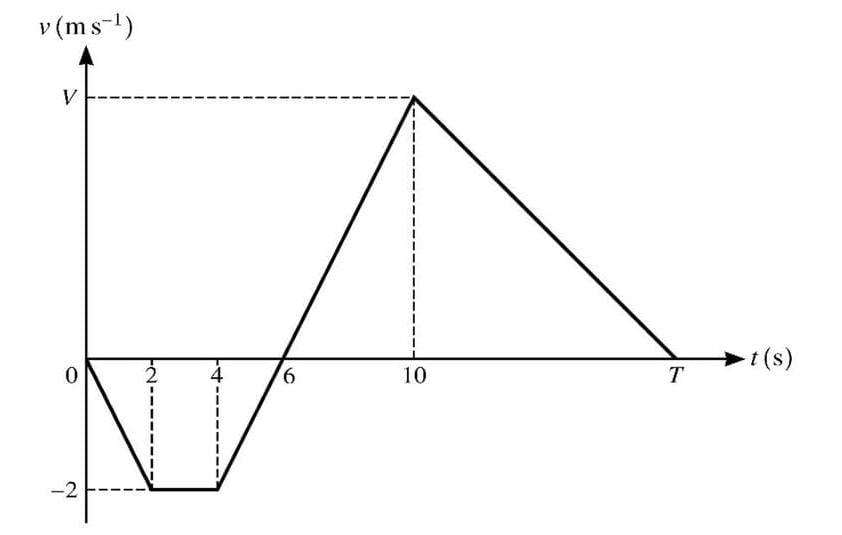
The diagram shows the velocity-time graphs for two particles, P and Q, which are moving in the same straight line. The graph for P consists of four straight line segments. The graph for Q consists of three straight line segments. Both particles start from the same initial position O on the line. Q starts 2 seconds after P and both particles come to rest at time t = T. The greatest velocity of Q is V m s-1.
- Find the displacement of P from O at t = 10. [1]
- Find the velocity of P at t = 12. [2]
- Given that the total distance covered by P during the T seconds of its motion is 49.5 m, find the value of T. [3]
- Given also that the acceleration of Q from t = 2 to t = 6 is 1.75 m s-2, find the value of V and hence find the distance between the two particles when they both come to rest at t = T. [3]
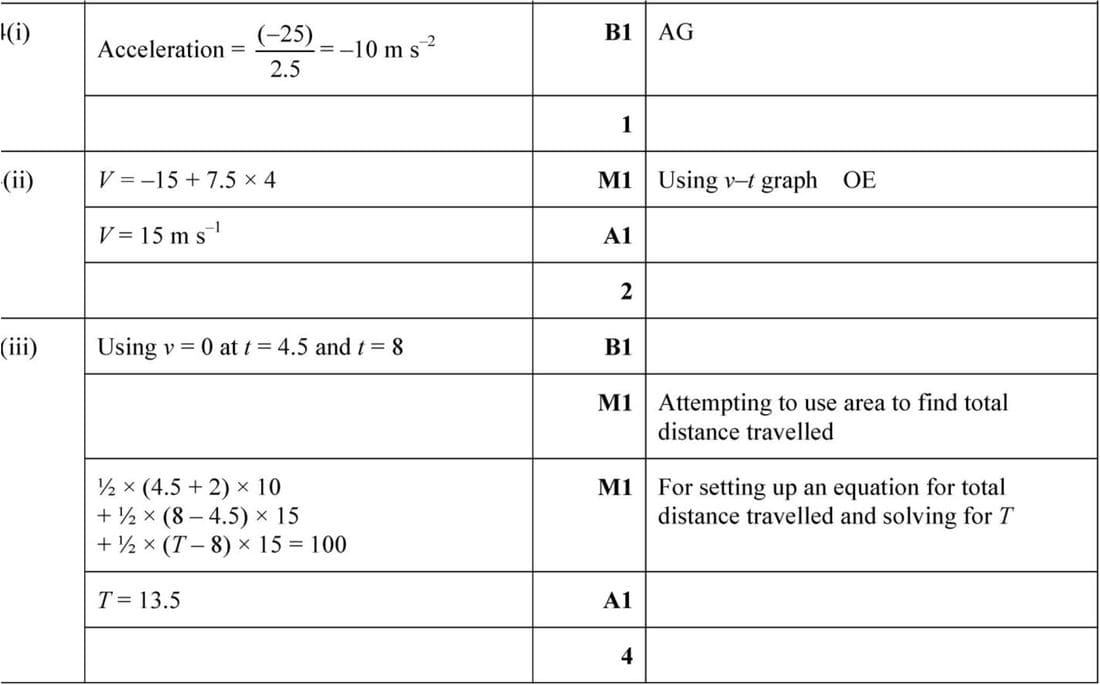
Nov 2017 p41 q4
The diagram shows the velocity-time graph of a particle which moves in a straight line. The graph consists of 5 straight line segments. The particle starts from rest at a point A at time \(t = 0\), and initially travels towards point B on the line.
- Show that the acceleration of the particle between \(t = 3.5\) and \(t = 6\) is \(-10 \text{ m s}^{-2}\).
- The acceleration of the particle between \(t = 6\) and \(t = 10\) is \(7.5 \text{ m s}^{-2}\). When \(t = 10\) the velocity of the particle is \(V \text{ m s}^{-1}\). Find the value of \(V\).
- The particle comes to rest at \(B\) at time \(T \text{ s}\). Given that the total distance travelled by the particle between \(t = 0\) and \(t = T\) is \(100 \text{ m}\), find the value of \(T\).
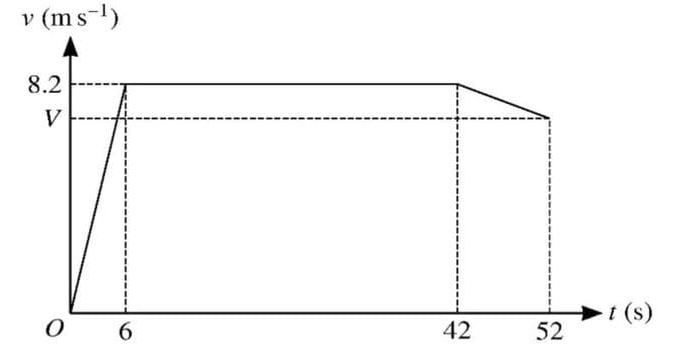
June 2016 p42 q4
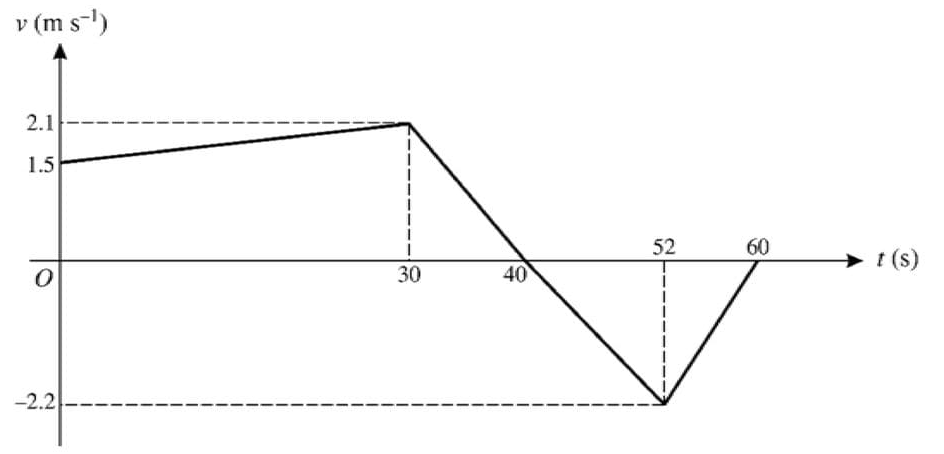
A sprinter runs a race of 400 m. His total time for running the race is 52 s. The diagram shows the velocity-time graph for the motion of the sprinter. He starts from rest and accelerates uniformly to a speed of 8.2 m/s in 6 s. The sprinter maintains a speed of 8.2 m/s for 36 s, and he then decelerates uniformly to a speed of V m/s at the end of the race.
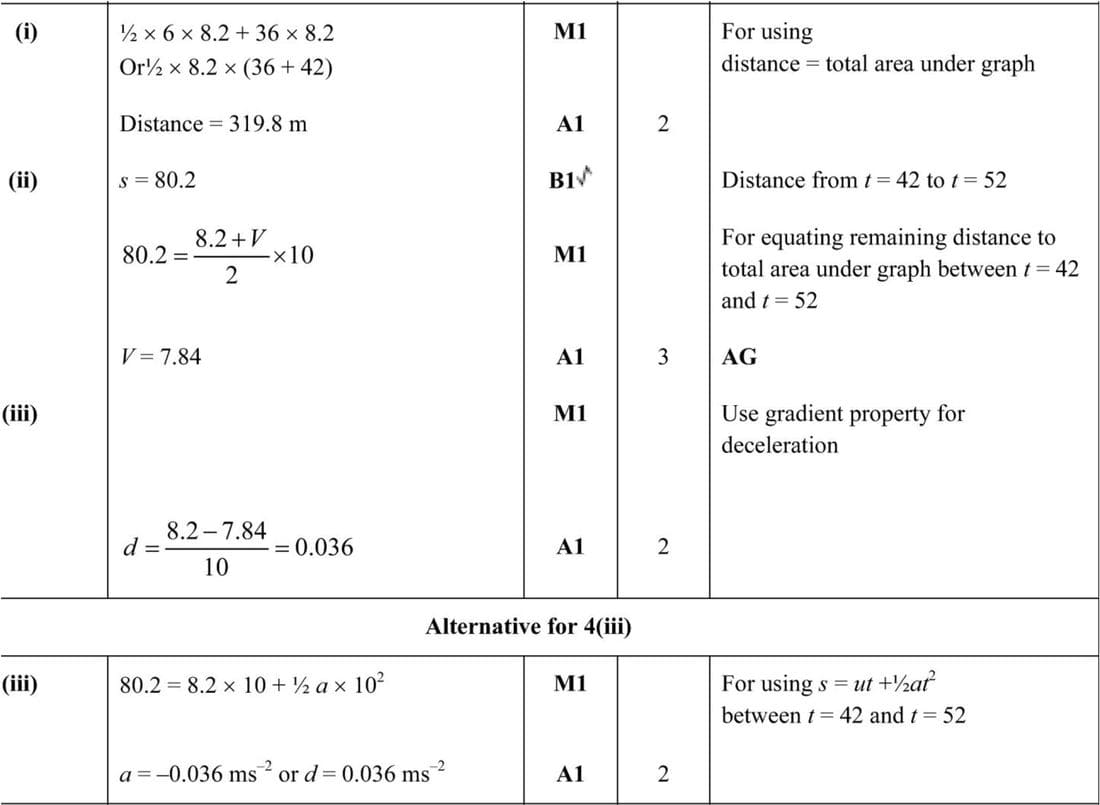
(i) Calculate the distance covered by the sprinter in the first 42 s of the race.
\((ii) Show that V = 7.84.\)
(iii) Calculate the deceleration of the sprinter in the last 10 s of the race.
Nov 2011 p43 q1
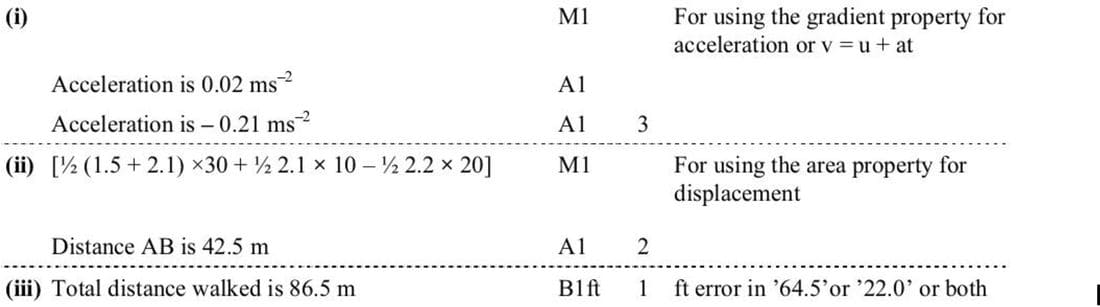
A woman walks in a straight line. The woman’s velocity t seconds after passing through a fixed point A on the line is v m s-1. The graph of v against t consists of 4 straight line segments (see diagram). The woman is at the point B when t = 60. Find
- the woman’s acceleration for 0 < t < 30 and for 30 < t < 40,
- the distance AB,
- the total distance walked by the woman.
Nov 2010 p42 q6
The diagram shows the velocity-time graph for a particle P which travels on a straight line AB, where v ms-1 is the velocity of P at time t s. The graph consists of five straight line segments. The particle starts from rest when t = 0 at a point X on the line between A and B and moves towards A. The particle comes to rest at A when t = 2.5.
(i) Given that the distance XA is 4 m, find the greatest speed reached by P during this stage of the motion.
In the second stage, P starts from rest at A when t = 2.5 and moves towards B. The distance AB is 48 m. The particle takes 12 s to travel from A to B and comes to rest at B. For the first 2 s of this stage P accelerates at 3 m s-2, reaching a velocity of V ms-1. Find
(ii) the value of V,
(iii) the value of t at which P starts to decelerate during this stage,
(iv) the deceleration of P immediately before it reaches B.
June 2010 p41 q2
The diagram shows the velocity-time graph for the motion of a machine’s cutting tool. The graph consists of five straight line segments. The tool moves forward for 8 s while cutting and then takes 3 s to return to its starting position. Find
- the acceleration of the tool during the first 2 s of the motion,
- the distance the tool moves forward while cutting,
- the greatest speed of the tool during the return to its starting position.
June 2005 p4 q6
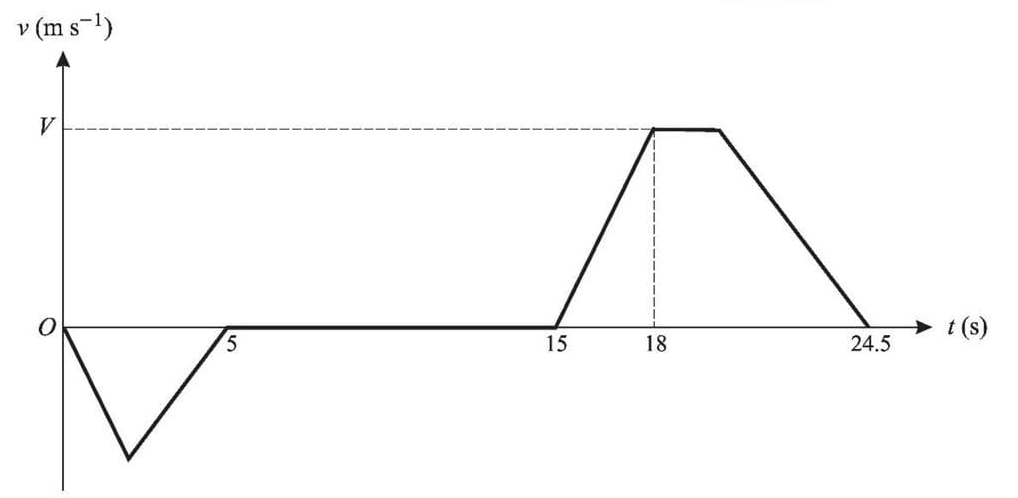
The diagram shows the velocity-time graph for a lift moving between floors in a building. The graph consists of straight line segments. In the first stage the lift travels downwards from the ground floor for 5 s, coming to rest at the basement after travelling 10 m.
(i) Find the greatest speed reached during this stage.
The second stage consists of a 10 s wait at the basement. In the third stage, the lift travels upwards until it comes to rest at a floor 34.5 m above the basement, arriving 24.5 s after the start of the first stage. The lift accelerates at 2 m s-2 for the first 3 s of the third stage, reaching a speed of V m s-1. Find
(ii) the value of V,
(iii) the time during the third stage for which the lift is moving at constant speed,
(iv) the deceleration of the lift in the final part of the third stage.
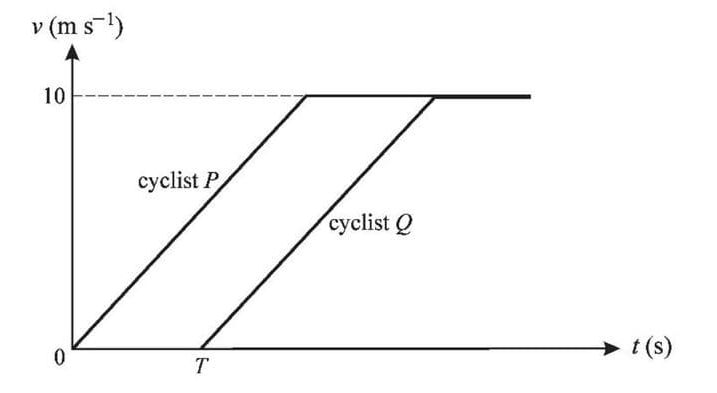
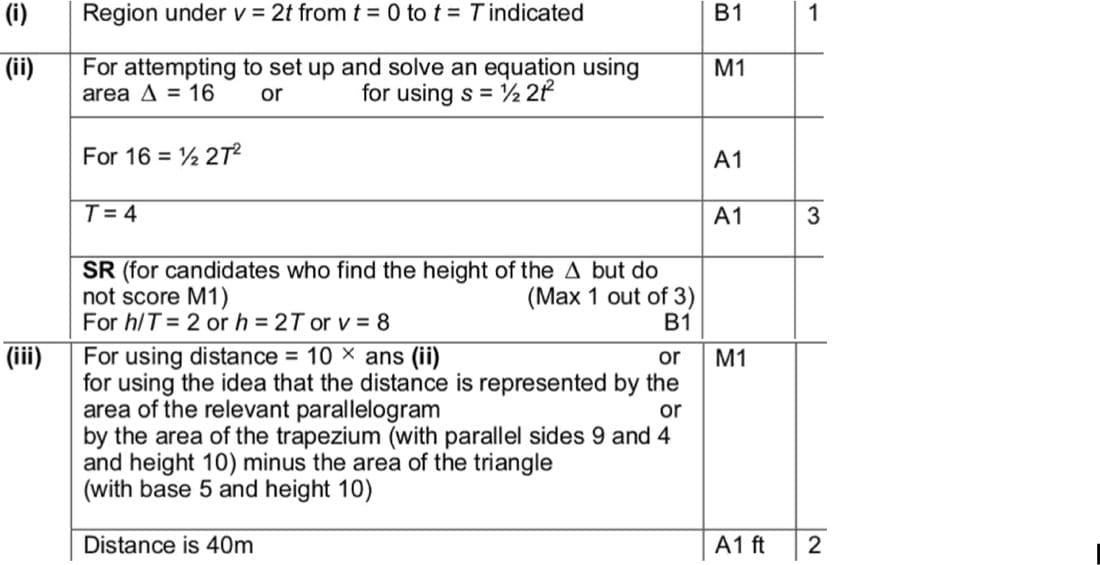
June 2003 p4 q3
The diagram shows the velocity-time graphs for the motion of two cyclists P and Q, who travel in the same direction along a straight path. Both cyclists start from rest at the same point O and both accelerate at 2 m s-2 up to a speed of 10 m s-1. Both then continue at a constant speed of 10 m s-1. Q starts his journey T seconds after P.
- Show in a sketch of the diagram the region whose area represents the displacement of P, from O, at the instant when Q starts.
- Given that P has travelled 16 m at the instant when Q starts, find
- the value of T,
- the distance between P and Q when Q's speed reaches 10 m s-1.
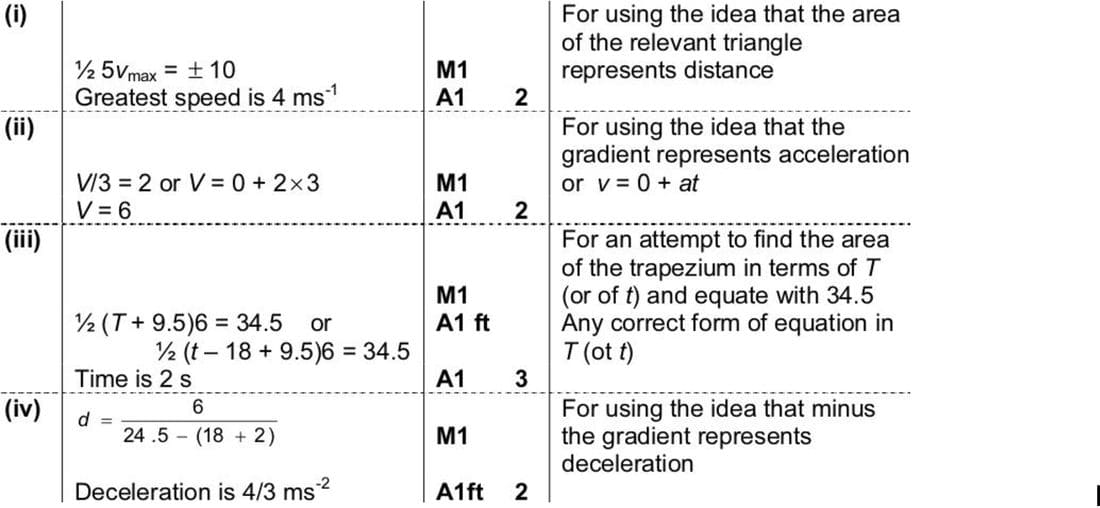
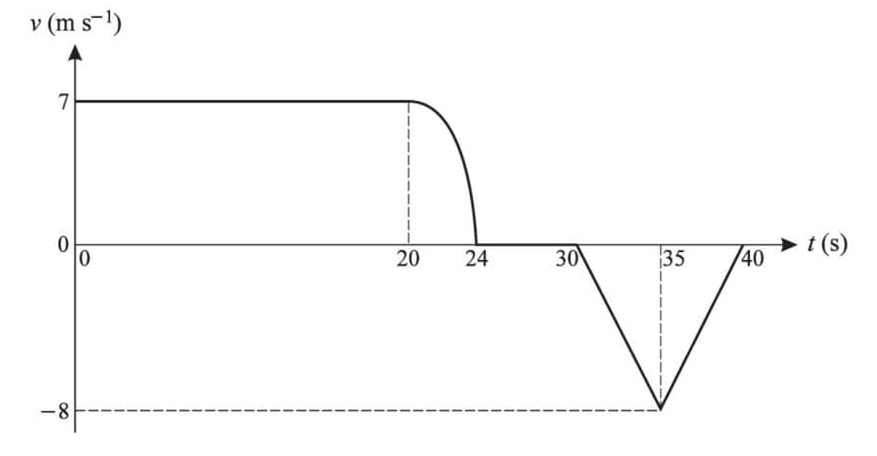
Nov 2002 p4 q2
A man runs in a straight line. He passes through a fixed point A with constant velocity 7 m s-1 at time t = 0. At time t s his velocity is v m s-1. The diagram shows the graph of v against t for the period 0 ≤ t ≤ 40.
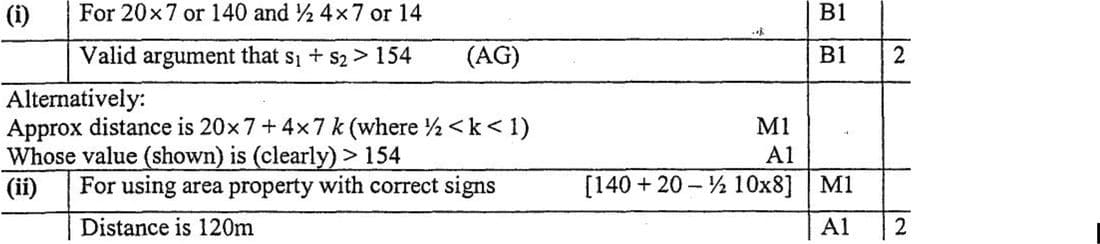
(i) Show that the man runs more than 154 m in the first 24 s.
\((ii) Given that the man runs 20 m in the interval 20 ≤ t ≤ 24, find how far he is from A when t = 40.\)
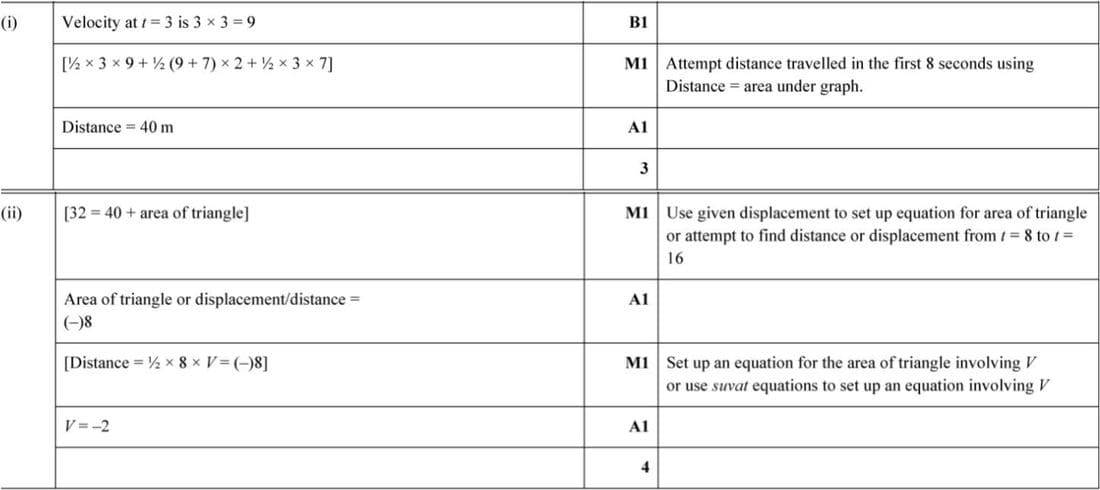
June 2023 p41 q4
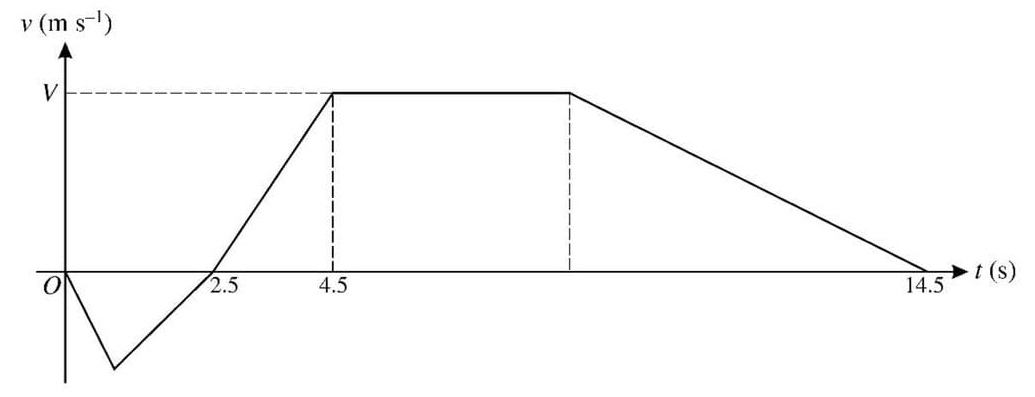
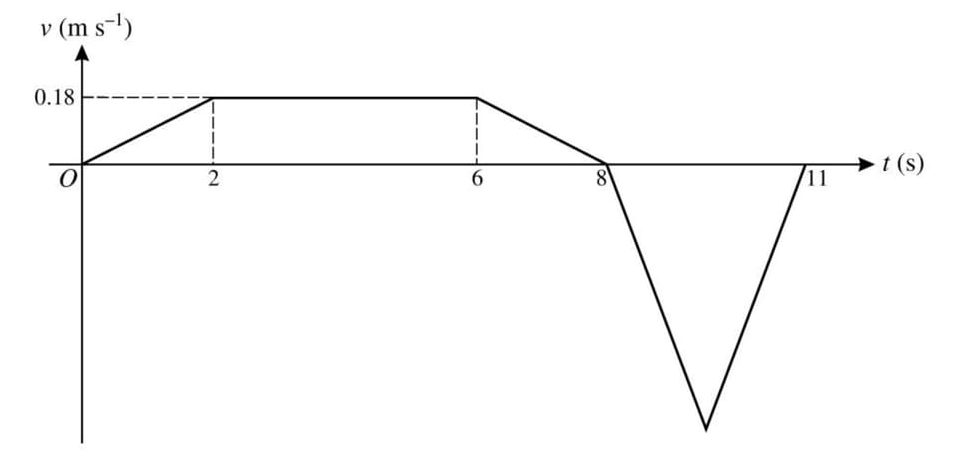
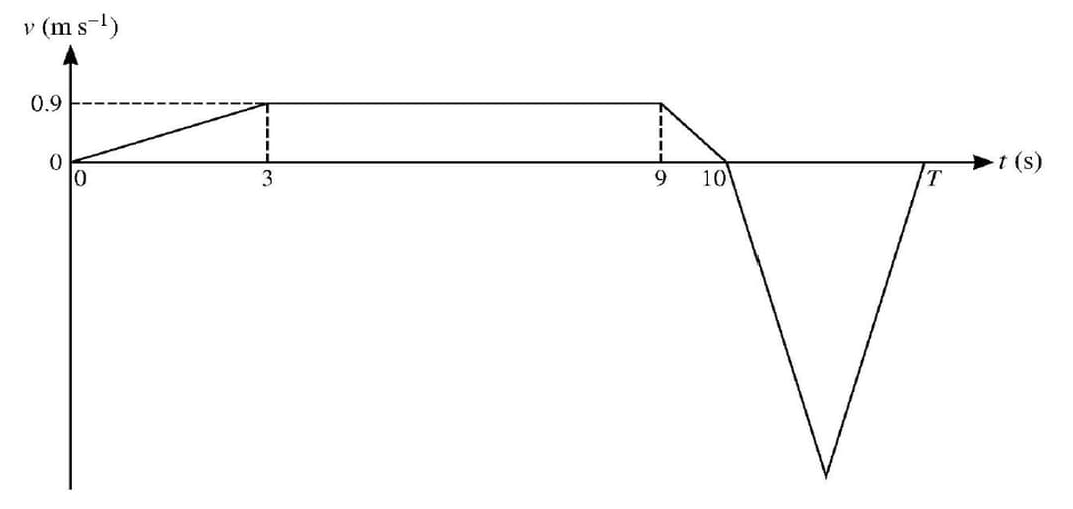
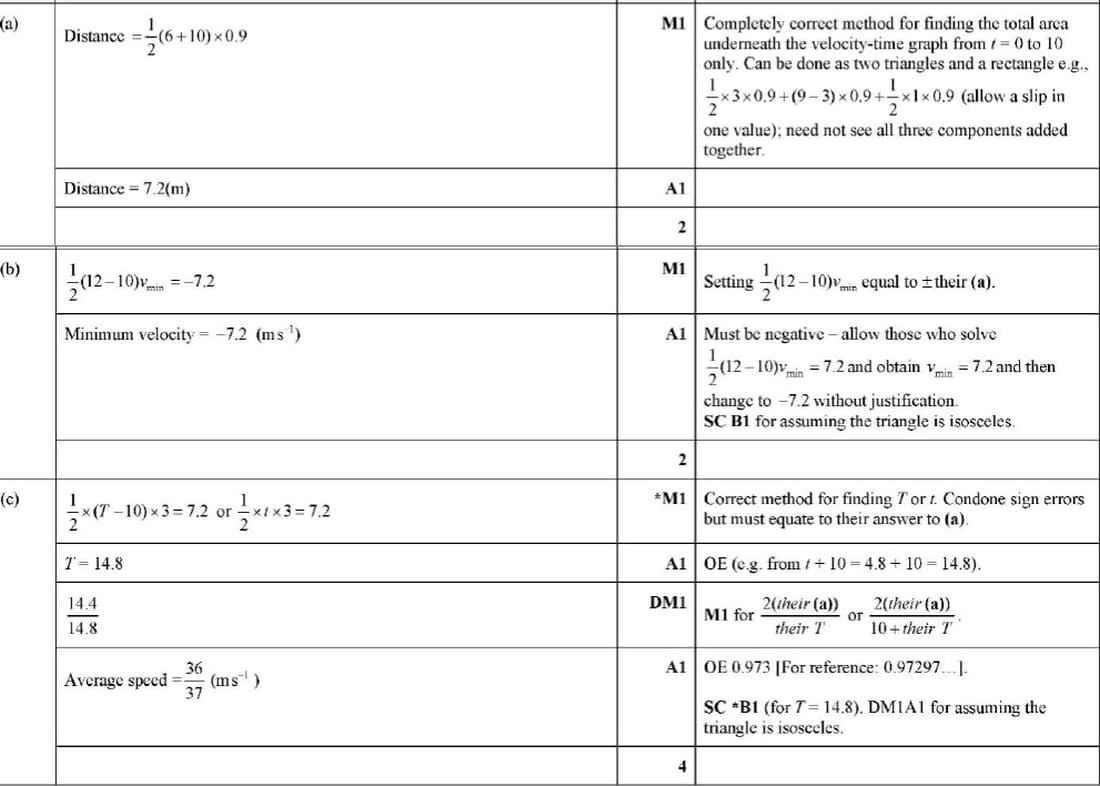
The velocity of a particle at time t s after leaving a fixed point O is v m s-1. The diagram shows a velocity-time graph which models the motion of the particle. The graph consists of 5 straight line segments. The particle accelerates to a speed of 0.9 m s-1 in a period of 3 s, then travels at constant speed for 6 s, and then comes instantaneously to rest 1 s later. The particle then moves back and returns to rest at O at time T s.
- Find the distance travelled by the particle in the first 10 s of its motion.
- Given that T = 12, find the minimum velocity of the particle.
- Given instead that the greatest speed of the particle is 3 m s-1, find the value of T and hence find the average speed of the particle for the whole of the motion.
June 2022 p43 q3
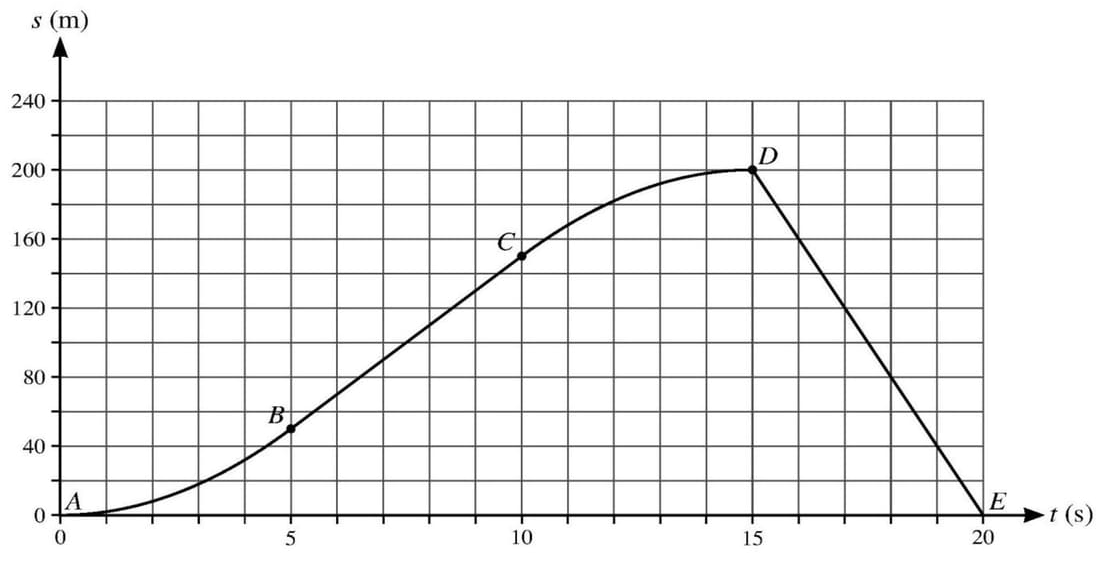
The displacement of a particle moving in a straight line is s metres at time t seconds after leaving a fixed point O. The particle starts from rest and passes through points P, Q and R, at times t = 5, t = 10 and t = 15 respectively, and returns to O at time t = 20. The distances OP, OQ and OR are 50 m, 150 m and 200 m respectively.
The diagram shows a displacement-time graph which models the motion of the particle from t = 0 to t = 20. The graph consists of two curved segments AB and CD and two straight line segments BC and DE.
- Find the speed of the particle between t = 5 and t = 10.
- Find the acceleration of the particle between t = 0 and t = 5, given that it is constant.
- Find the average speed of the particle during its motion.
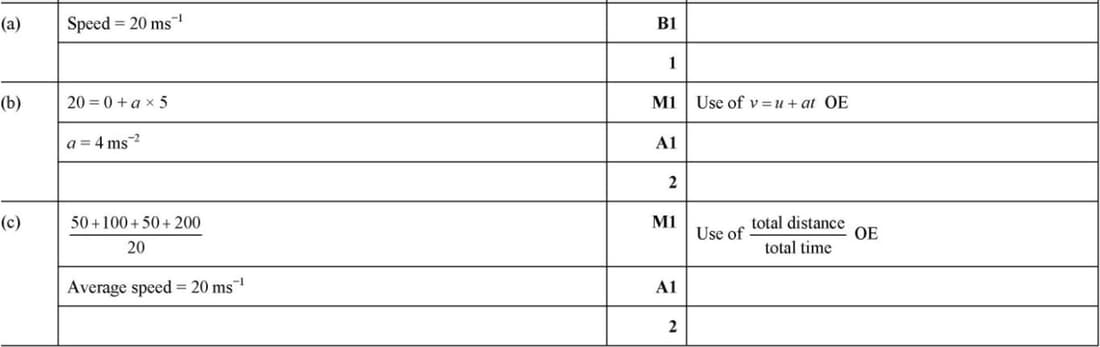
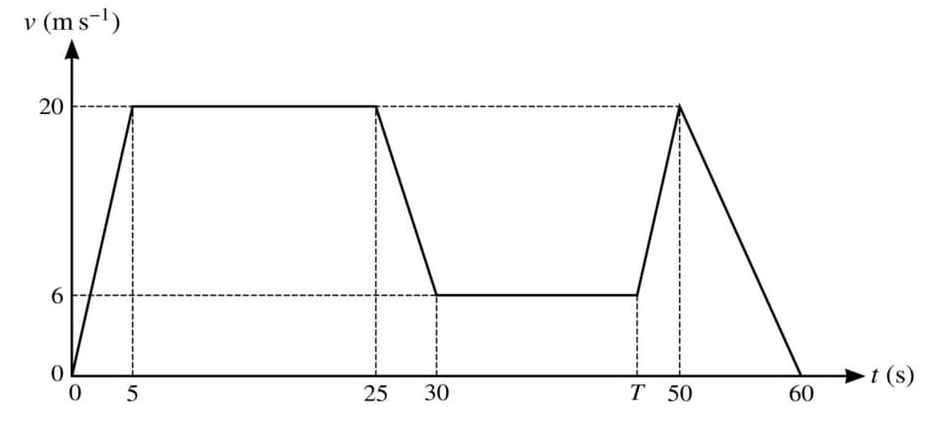
Nov 2021 p42 q1
The diagram shows a velocity-time graph which models the motion of a car. The graph consists of six straight line segments. The car accelerates from rest to a speed of 20 m s-1 over a period of 5 s, and then travels at this speed for a further 20 s. The car then decelerates to a speed of 6 m s-1 over a period of 5 s. This speed is maintained for a further (T - 30) s. The car then accelerates again to a speed of 20 m s-1 over a period of (50 - T) s, before decelerating to rest over a period of 10 s.
- Given that during the two stages of the motion when the car is accelerating, the accelerations are equal, find the value of T.
- Find the total distance travelled by the car during the motion.
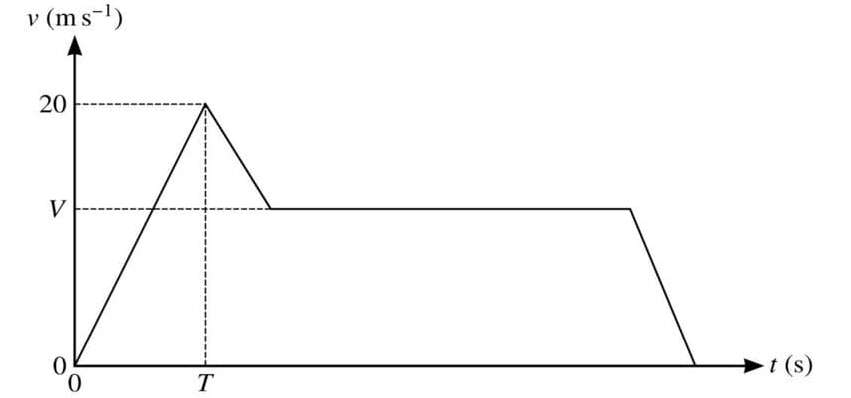
Nov 2020 p42 q4
The diagram shows a velocity-time graph which models the motion of a car. The graph consists of four straight line segments. The car accelerates at a constant rate of 2 m s-2 from rest to a speed of 20 m s-1 over a period of T s. It then decelerates at a constant rate for 5 seconds before travelling at a constant speed of V m s-1 for 27.5 s. The car then decelerates to rest at a constant rate over a period of 5 s.
(a) Find T.
(b) Given that the distance travelled up to the point at which the car begins to move with constant speed is one third of the total distance travelled, find V.
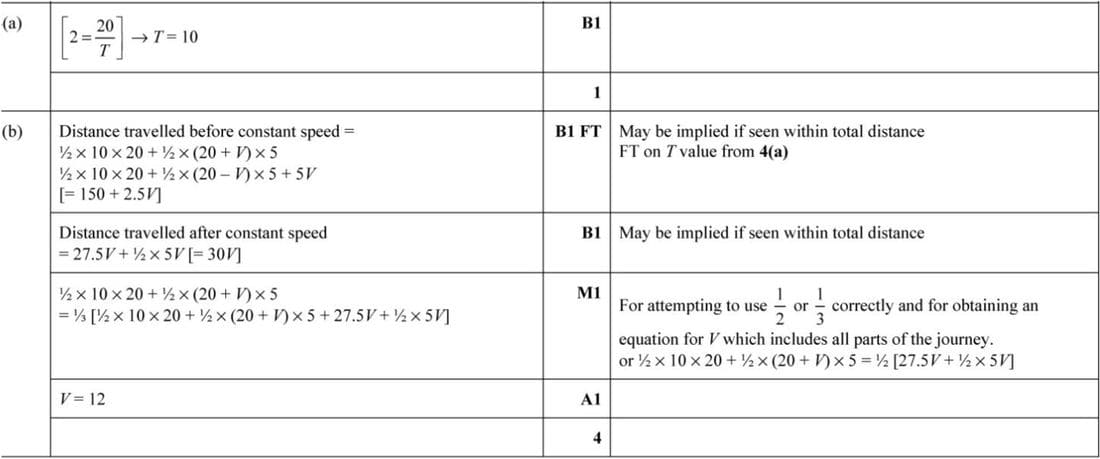
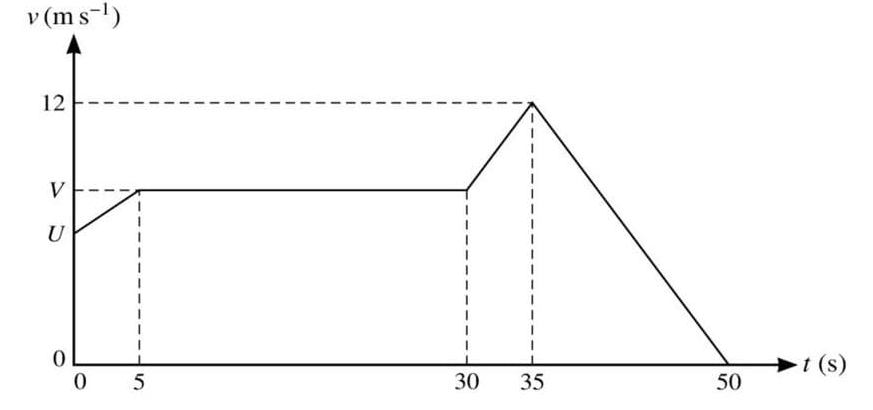
Nov 2019 p42 q2
The diagram shows a velocity-time graph which models the motion of a tractor. The graph consists of four straight line segments. The tractor passes a point O at time \(t = 0\) with speed \(U \text{ m s}^{-1}\). The tractor accelerates to a speed of \(V \text{ m s}^{-1}\) over a period of 5 s, and then travels at this speed for a further 25 s. The tractor then accelerates to a speed of 12 \(\text{ m s}^{-1}\) over a period of 5 s. The tractor then decelerates to rest over a period of 15 s.
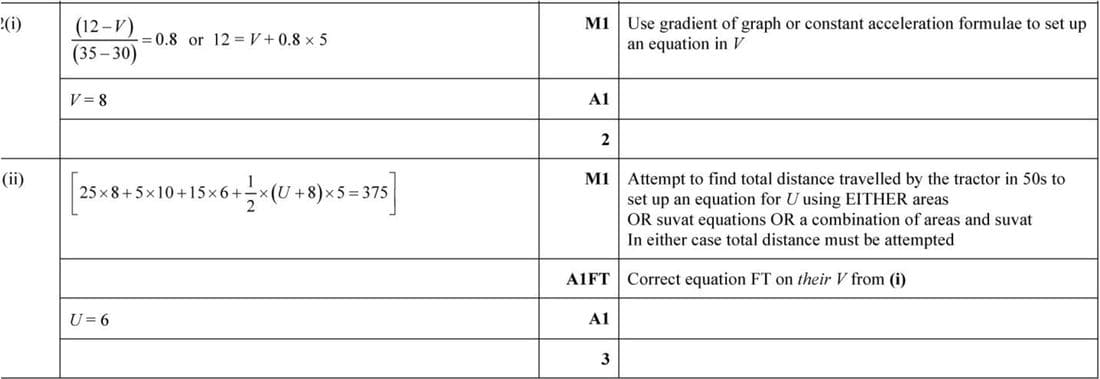
- Given that the acceleration of the tractor between \(t = 30\) and \(t = 35\) is \(0.8 \text{ m s}^{-2}\), find the value of \(V\).
- Given also that the total distance covered by the tractor in the 50 seconds of motion is 375 m, find the value of \(U\).
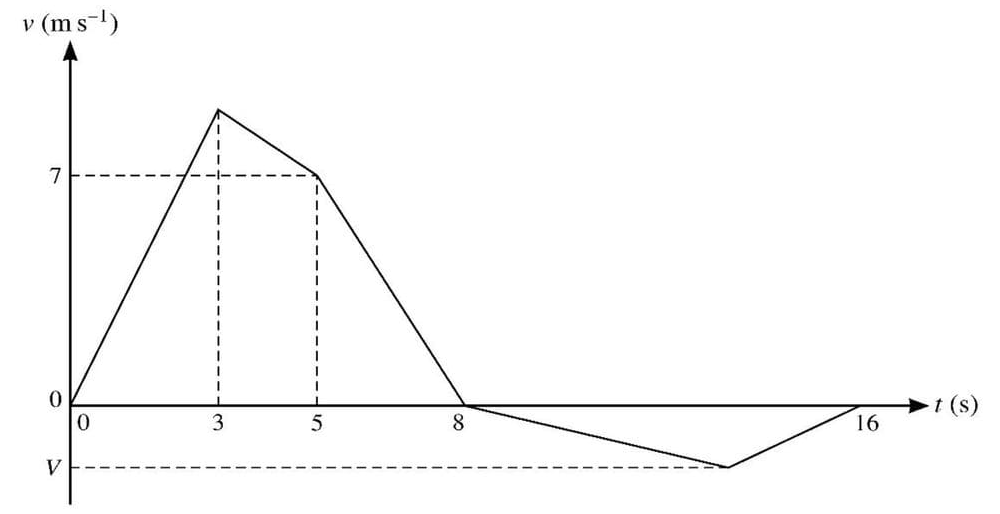
Feb/Mar 2019 p42 q5
The velocity of a particle moving in a straight line is \(v \text{ m s}^{-1}\) at time \(t\) seconds after leaving a fixed point \(O\). The diagram shows a velocity-time graph which models the motion of the particle from \(t = 0\) to \(t = 16\). The graph consists of five straight line segments. The acceleration of the particle from \(t = 0\) to \(t = 3\) is \(3 \text{ m s}^{-2}\). The velocity of the particle at \(t = 5\) is \(7 \text{ m s}^{-1}\) and it comes to instantaneous rest at \(t = 8\). The particle then comes to rest again at \(t = 16\). The minimum velocity of the particle is \(V \text{ m s}^{-1}\).
(i) Find the distance travelled by the particle in the first 8 s of its motion.
(ii) Given that when the particle comes to rest at \(t = 16\) its displacement from \(O\) is 32 m, find the value of \(V\).
Nov 2018 p42 q3
The velocity of a particle moving in a straight line is \(v\) m s-1 at time \(t\) seconds. The diagram shows a velocity-time graph which models the motion of the particle from \(t = 0\) to \(t = T\). The graph consists of four straight line segments. The particle reaches its maximum velocity \(V\) m s-1 at \(t = 10\).
(i) Find the acceleration of the particle during the first 2 seconds.
(ii) Find the value of \(V\).
At \(t = 6\), the particle is instantaneously at rest at the point \(A\). At \(t = T\), the particle comes to rest at the point \(B\). At \(t = 0\) the particle starts from rest at a point one third of the way from \(A\) to \(B\).
(iii) Find the distance \(AB\) and hence find the value of \(T\).
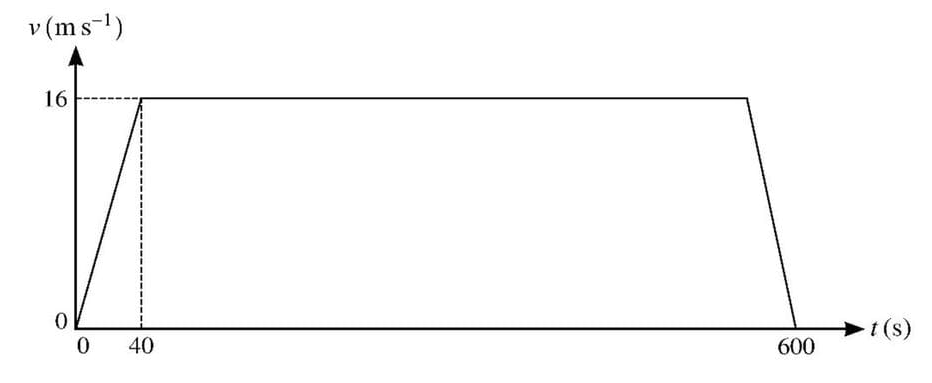
June 2018 p43 q1
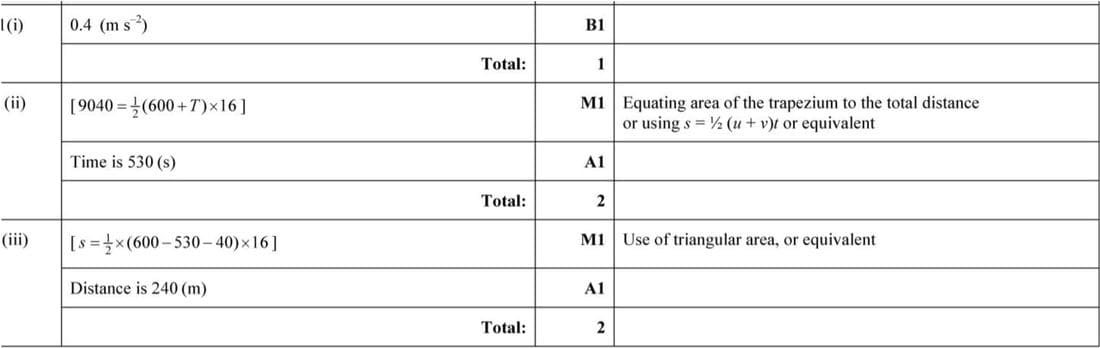
The diagram shows the velocity-time graph for a train which travels from rest at one station to rest at the next station. The graph consists of three straight line segments. The distance between the two stations is 9040 m.
- Find the acceleration of the train during the first 40 s.
- Find the length of time for which the train is travelling at constant speed.
- Find the distance travelled by the train while it is decelerating.
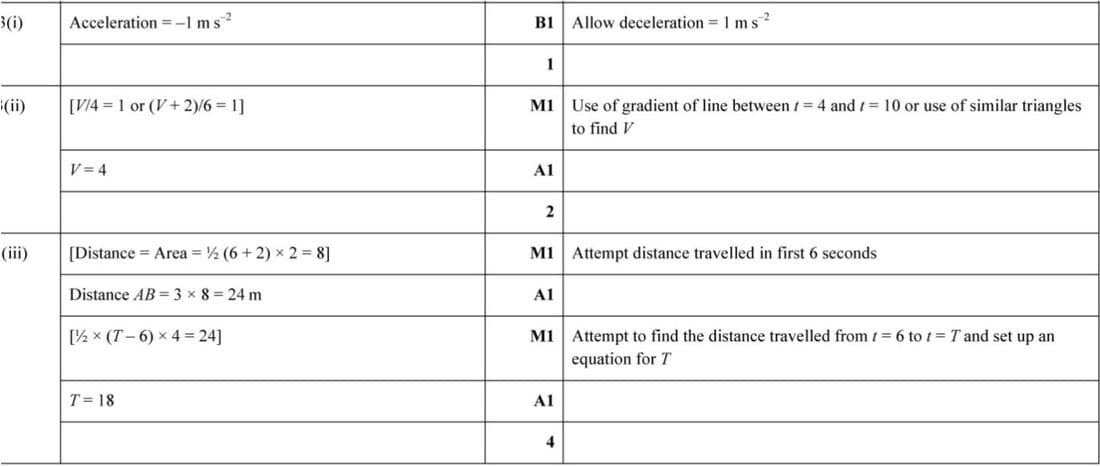
Nov 2005 p4 q5
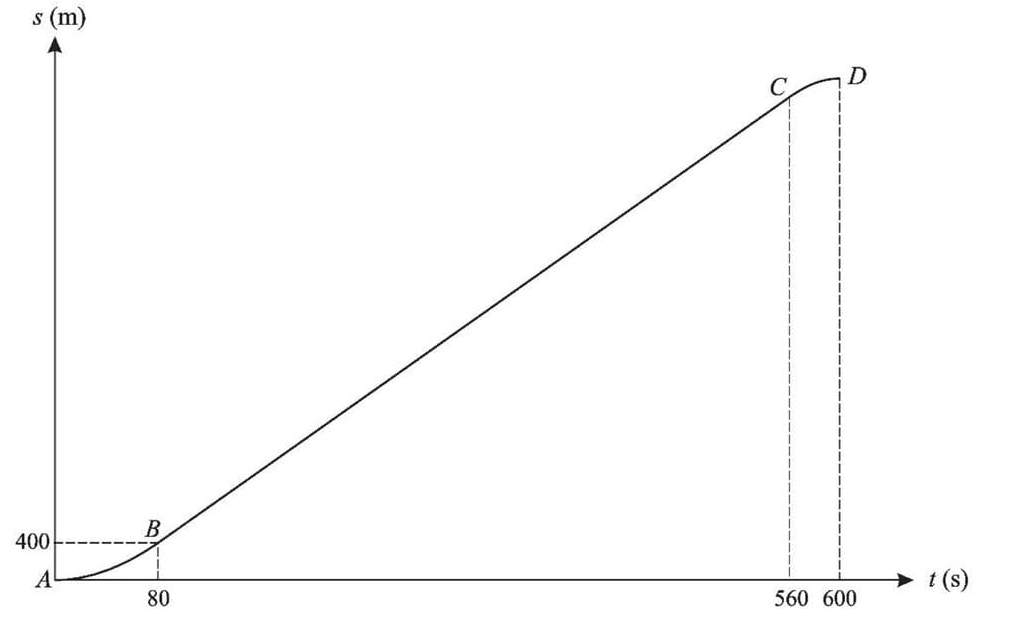
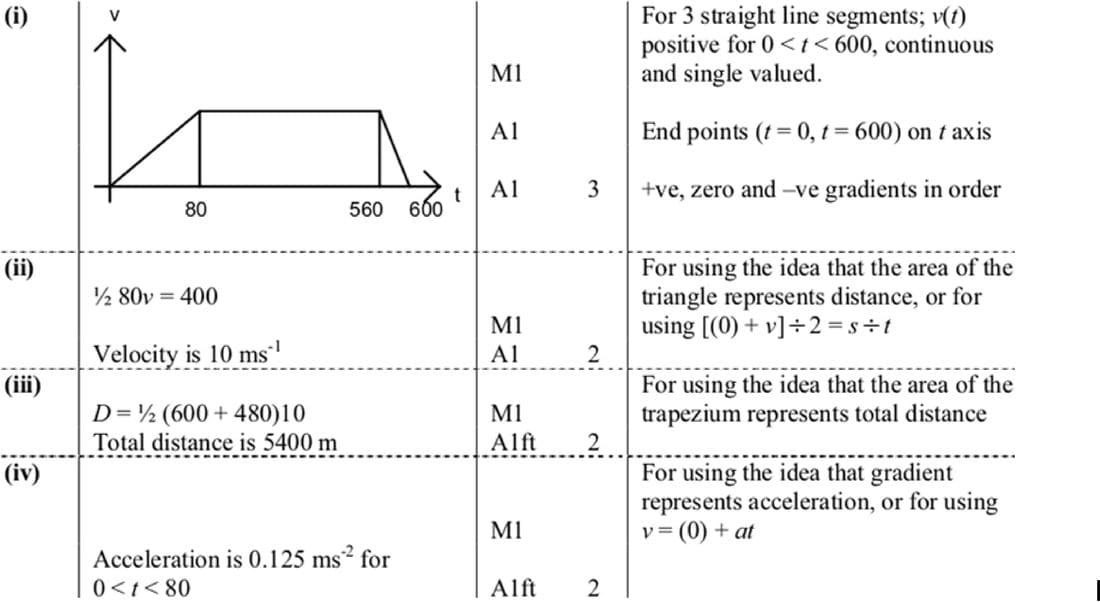
The diagram shows the displacement-time graph for a car’s journey. The graph consists of two curved parts AB and CD, and a straight line BC. The line BC is a tangent to the curve AB at B and a tangent to the curve CD at C. The gradient of the curves at t = 0 and t = 600 is zero, and the acceleration of the car is constant for 0 < t < 80 and for 560 < t < 600. The displacement of the car is 400 m when t = 80.
- Sketch the velocity-time graph for the journey.
- Find the velocity at t = 80.
- Find the total distance for the journey.
- Find the acceleration of the car for 0 < t < 80.
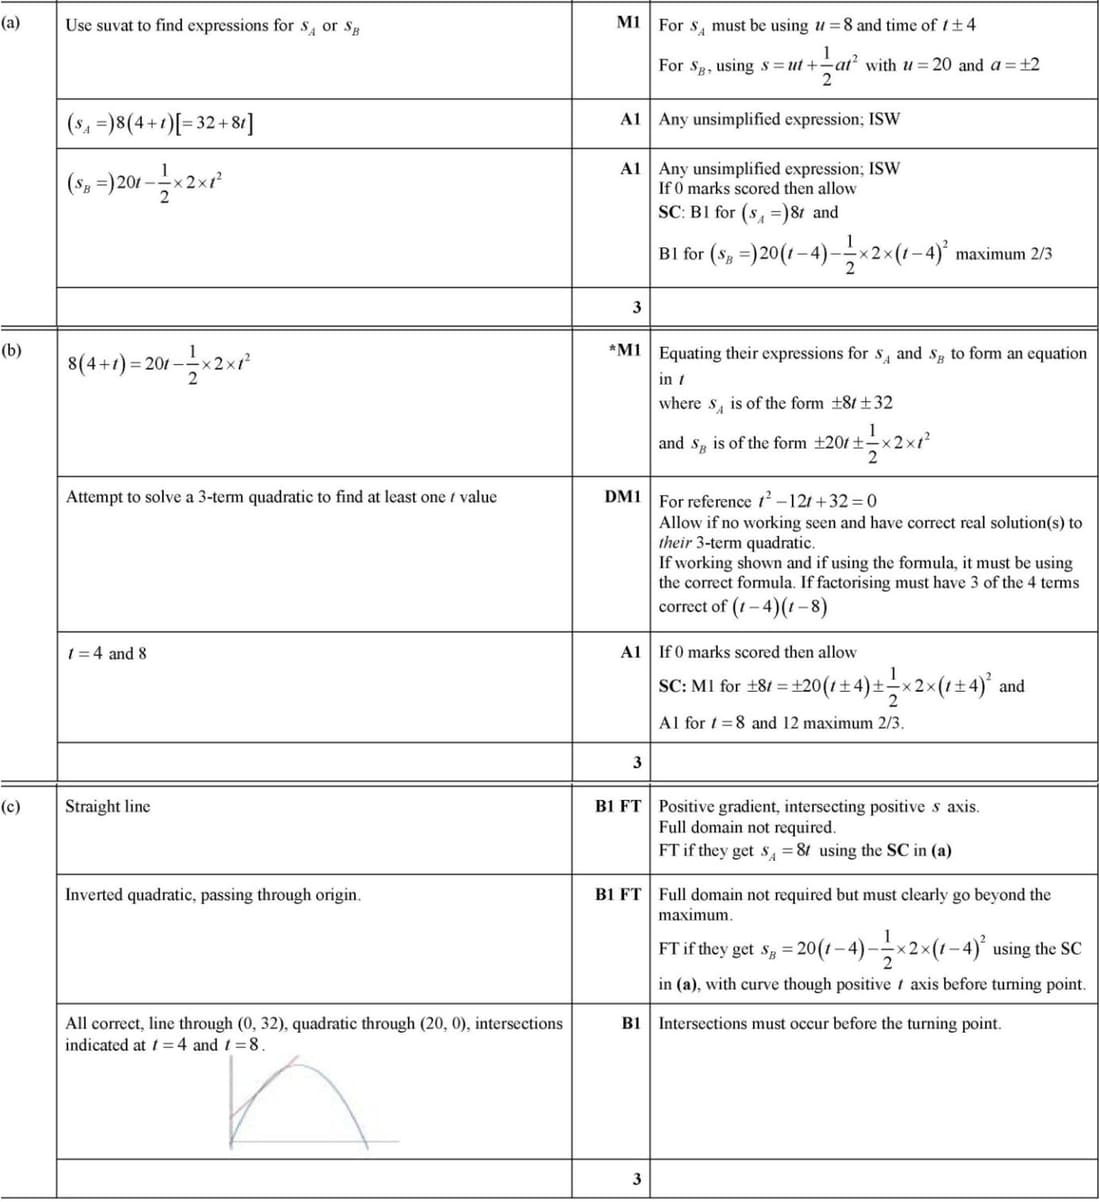
June 2022 p42 q4
A particle A, moving along a straight horizontal track with constant speed 8 m/s, passes a fixed point O. Four seconds later, another particle B passes O, moving along a parallel track in the same direction as A. Particle B has speed 20 m/s when it passes O and has a constant deceleration of 2 m/s². B comes to rest when it returns to O.
(a) Find expressions, in terms of t, for the displacement from O of each particle t seconds after B passes O.
(b) Find the values of t when the particles are the same distance from O.
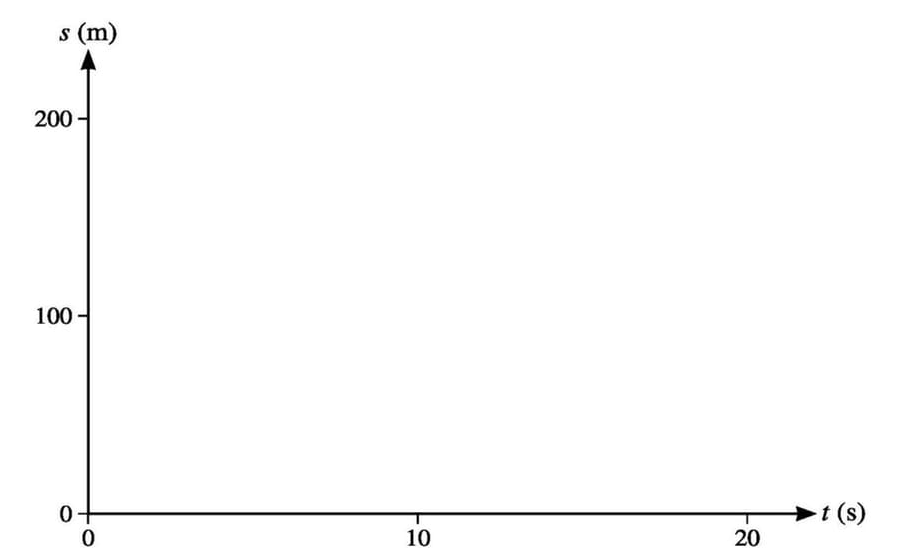
(c) On the given axes, sketch the displacement-time graphs for both particles, for values of t from 0 to 20.
Diagram: A graph with s (m) on the vertical axis and t (s) on the horizontal axis, ranging from 0 to 20.
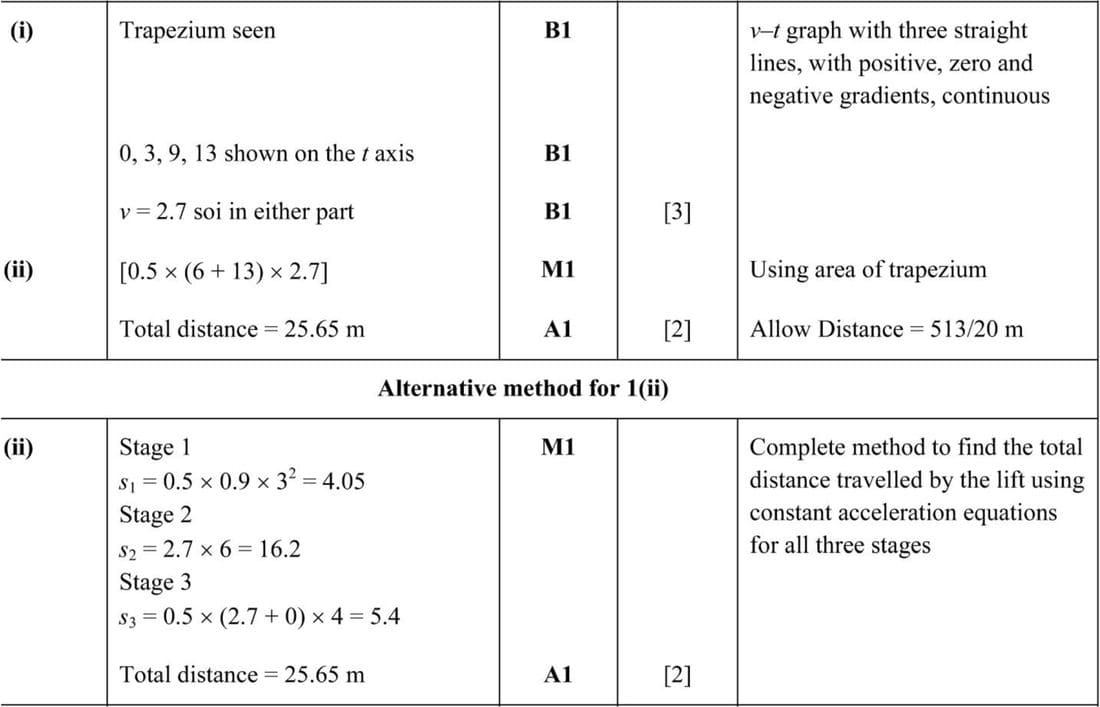
June 2016 p41 q1
A lift moves upwards from rest and accelerates at 0.9 m/s2 for 3 s. The lift then travels for 6 s at constant speed and finally slows down, with a constant deceleration, stopping in a further 4 s.
- Sketch a velocity-time graph for the motion.
- Find the total distance travelled by the lift.

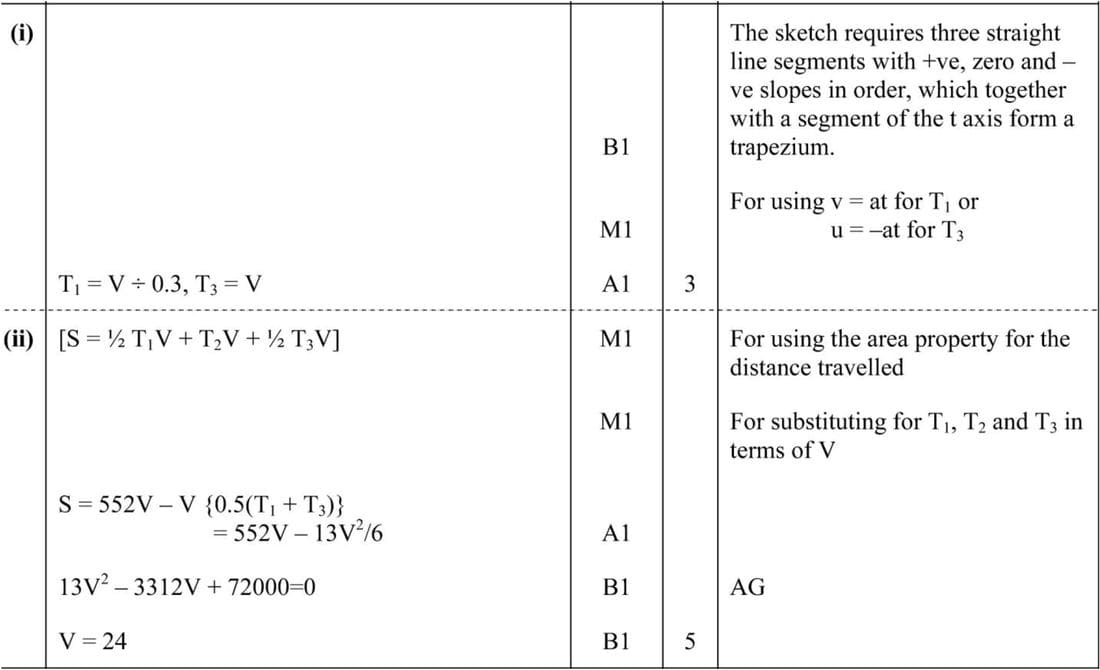
Nov 2013 p43 q5
A car travels in a straight line from A to B, a distance of 12 km, taking 552 seconds. The car starts from rest at A and accelerates for T1 s at 0.3 m s-2, reaching a speed of V m s-1. The car then continues to move at V m s-1 for T2 s. It then decelerates for T3 s at 1 m s-2, coming to rest at B.
(i) Sketch the velocity-time graph for the motion and express T1 and T3 in terms of V.
(ii) Express the total distance travelled in terms of V and show that 13V2 - 3312V + 72000 = 0. Hence find the value of V.

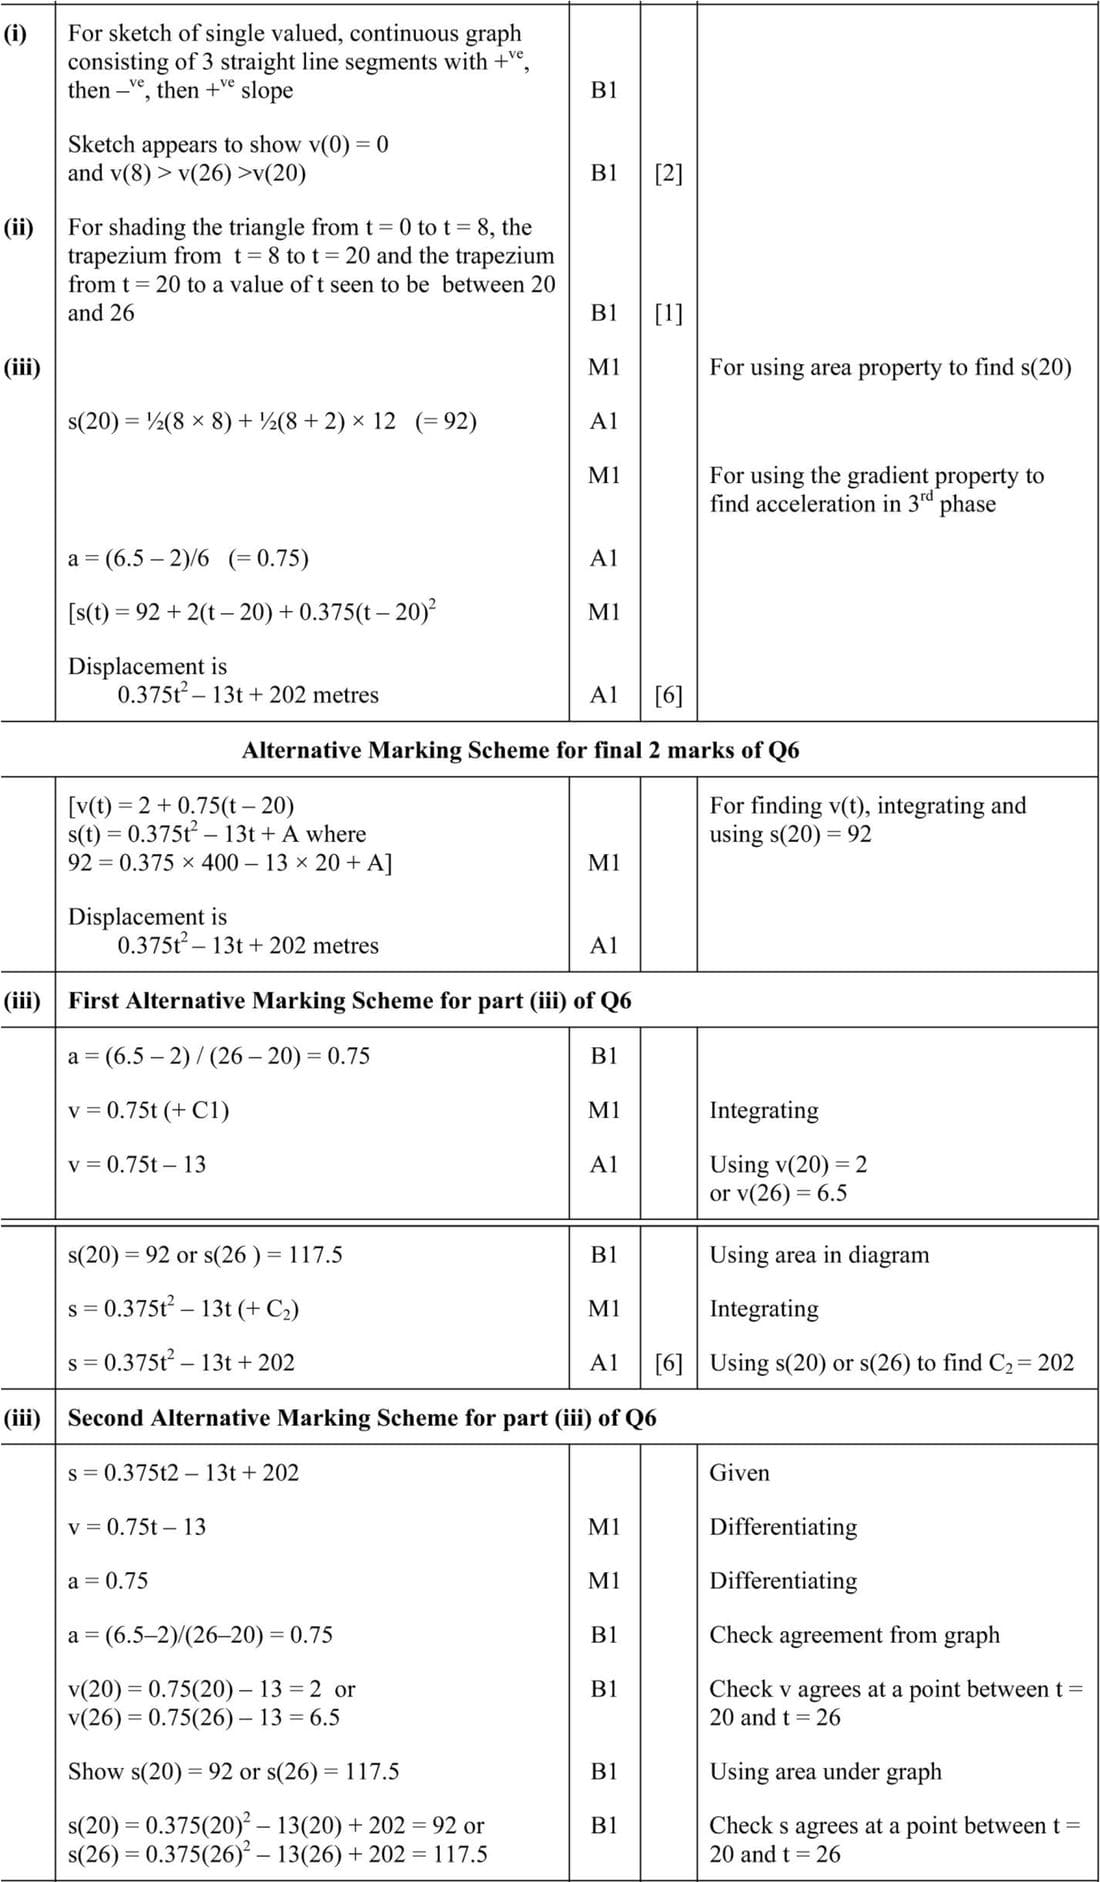
June 2013 p42 q6
A particle P moves in a straight line. It starts from rest at a point O and moves towards a point A on the line. During the first 8 seconds P's speed increases to 8 m s-1 with constant acceleration. During the next 12 seconds P's speed decreases to 2 m s-1 with constant deceleration. P then moves with constant acceleration for 6 seconds, reaching A with speed 6.5 m s-1.
- Sketch the velocity-time graph for P's motion.
The displacement of P from O, at time t seconds after P leaves O, is s metres.
- Shade the region of the velocity-time graph representing s for a value of t where 20 ≤ t ≤ 26.
- Show that, for 20 ≤ t ≤ 26,
\(s = 0.375t^2 - 13t + 202.\)

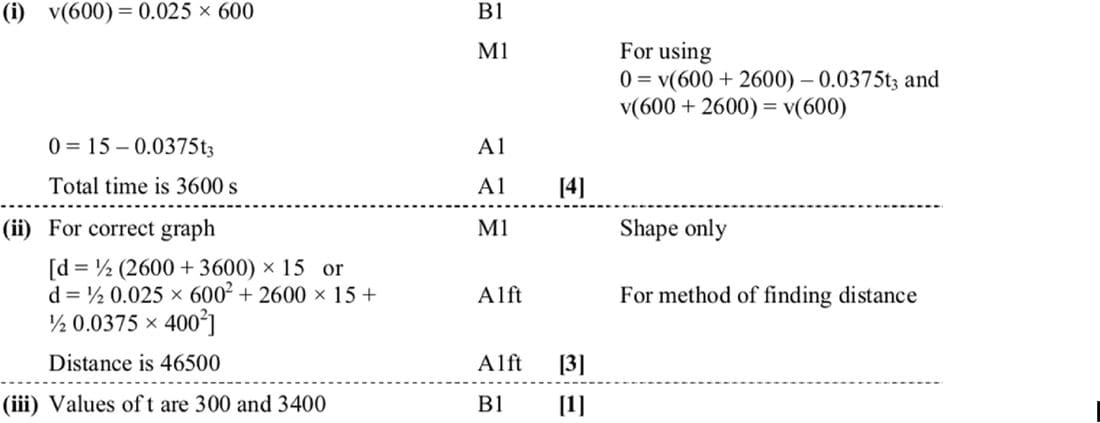
June 2011 p41 q5
A train starts from rest at a station A and travels in a straight line to station B, where it comes to rest. The train moves with constant acceleration 0.025 m s-2 for the first 600 s, with constant speed for the next 2600 s, and finally with constant deceleration 0.0375 m s-2.
- Find the total time taken for the train to travel from A to B.
- Sketch the velocity-time graph for the journey and find the distance AB.
- The speed of the train t seconds after leaving A is 7.5 m s-1. State the possible values of t.
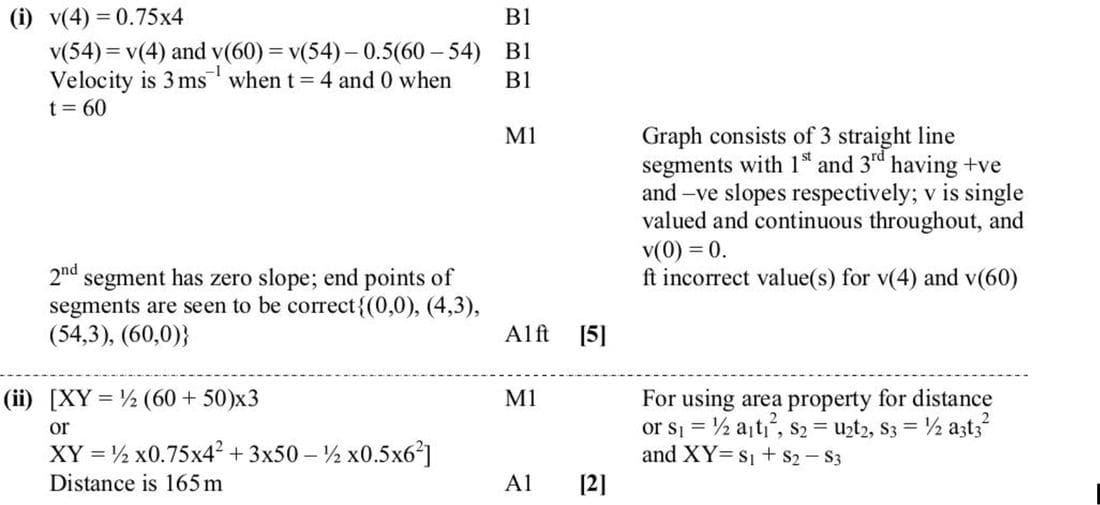
Nov 2010 p43 q4
A particle starts from rest at a point X and moves in a straight line until, 60 seconds later, it reaches a point Y. At time t s after leaving X, the acceleration of the particle is
0.75 m s-2 for 0 < t < 4,
0 m s-2 for 4 < t < 54,
-0.5 m s-2 for 54 < t < 60.
\((i) Find the velocity of the particle when t = 4 and when t = 60, and sketch the velocity-time graph.\)
(ii) Find the distance XY.
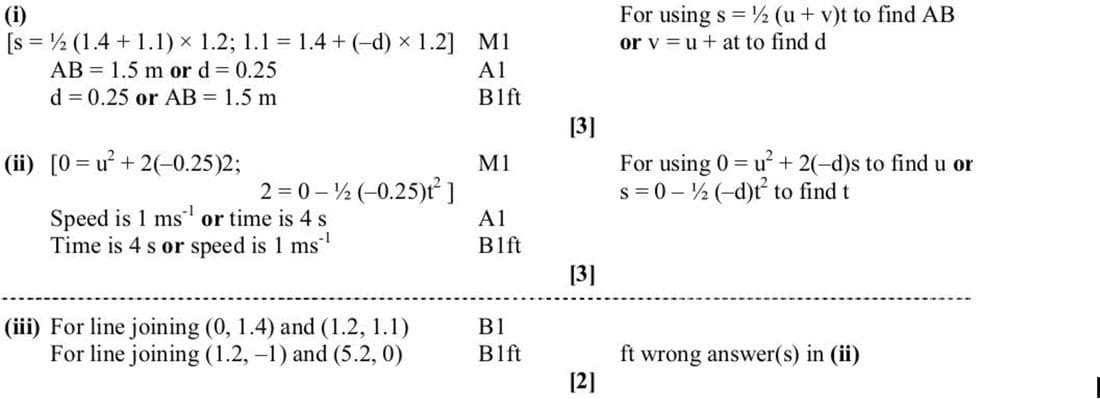
June 2010 p43 q5
A ball moves on the horizontal surface of a billiards table with deceleration of constant magnitude \(d \, \text{m/s}^2\). The ball starts at \(A\) with speed \(1.4 \, \text{m/s}\) and reaches the edge of the table at \(B\), \(1.2\) s later, with speed \(1.1 \, \text{m/s}\).
- Find the distance \(AB\) and the value of \(d\).
- Find the speed with which the ball starts to move towards \(A\) and the time taken for the ball to travel from \(B\) to \(C\).
- Sketch a velocity-time graph for the motion of the ball, from the time the ball leaves \(A\) until it comes to rest at \(C\), showing on the axes the values of the velocity and the time when the ball is at \(A\), at \(B\) and at \(C\).
\(AB\) is at right angles to the edge of the table containing \(B\). The table has a low wall along each of its edges and the ball rebounds from the wall at \(B\) and moves directly towards \(A\). The ball comes to rest at \(C\) where the distance \(BC\) is \(2\) m.
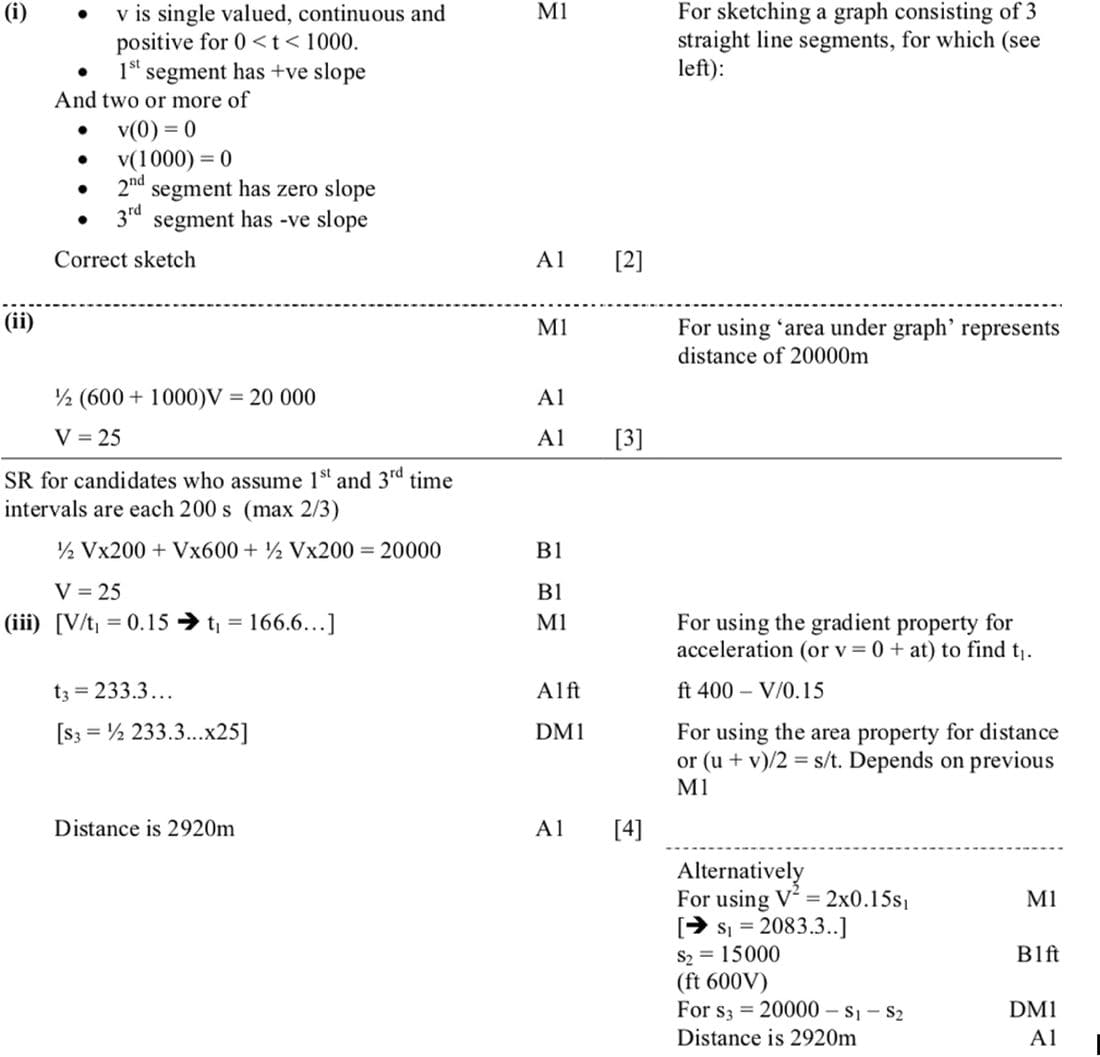
Nov 2008 p4 q6
A train travels from A to B, a distance of 20,000 m, taking 1,000 s. The journey has three stages. In the first stage the train starts from rest at A and accelerates uniformly until its speed is V m/s. In the second stage the train travels at constant speed V m/s for 600 s. During the third stage of the journey the train decelerates uniformly, coming to rest at B.
- Sketch the velocity-time graph for the train’s journey.
- Find the value of V.
- Given that the acceleration of the train during the first stage of the journey is 0.15 m/s², find the distance travelled by the train during the third stage of the journey.

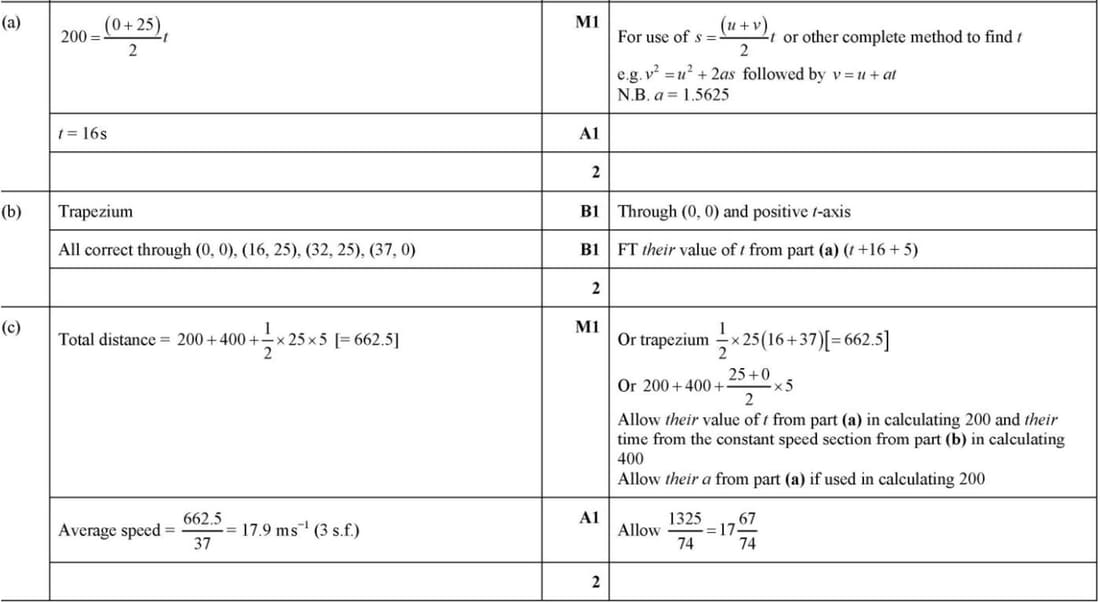
June 2022 p41 q1
A car starts from rest and moves in a straight line with constant acceleration for a distance of 200 m, reaching a speed of 25 m s-1. The car then travels at this speed for 400 m, before decelerating uniformly to rest over a period of 5 s.
(a) Find the time for which the car is accelerating.
(b) Sketch the velocity–time graph for the motion of the car, showing the key points.
(c) Find the average speed of the car during its motion.
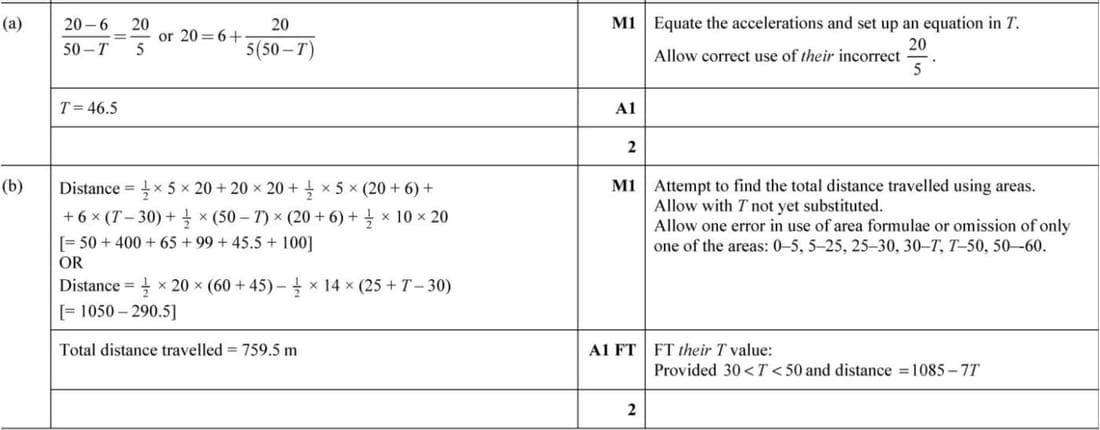
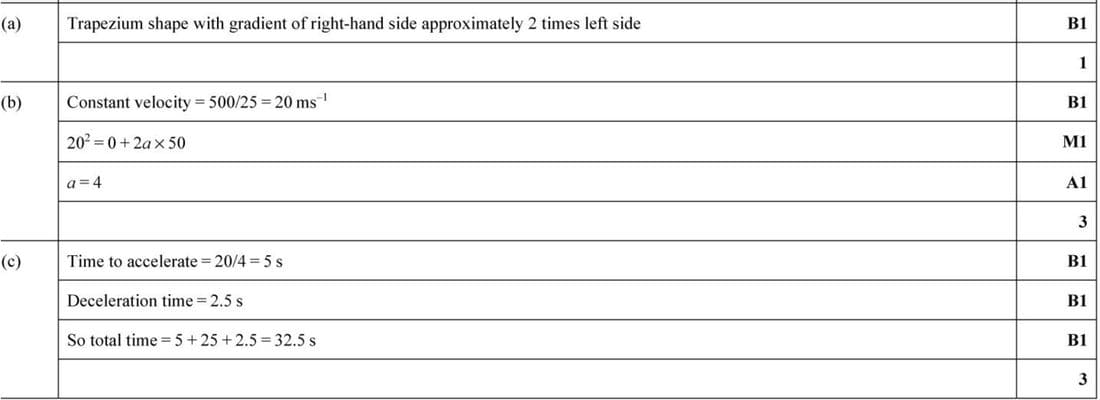
June 2020 p43 q4
A car starts from rest and moves in a straight line with constant acceleration \(a \text{ m s}^{-2}\) for a distance of 50 m. The car then travels with constant velocity for 500 m for a period of 25 s, before decelerating to rest. The magnitude of this deceleration is \(2a \text{ m s}^{-2}\).
(a) Sketch the velocity-time graph for the motion of the car.
(b) Find the value of \(a\).
(c) Find the total time for which the car is in motion.
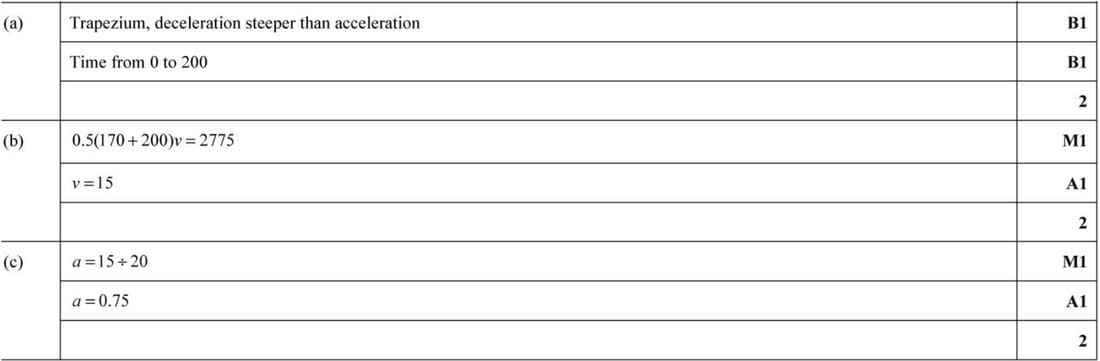
June 2020 p42 q1
A tram starts from rest and moves with uniform acceleration for 20 s. The tram then travels at a constant speed, \(V \text{ m s}^{-1}\), for 170 s before being brought to rest with a uniform deceleration of magnitude twice that of the acceleration. The total distance travelled by the tram is 2.775 km.
(a) Sketch a velocity-time graph for the motion, stating the total time for which the tram is moving. [2]
(b) Find \(V\). [2]
(c) Find the magnitude of the acceleration. [2]
June 2019 p43 q1
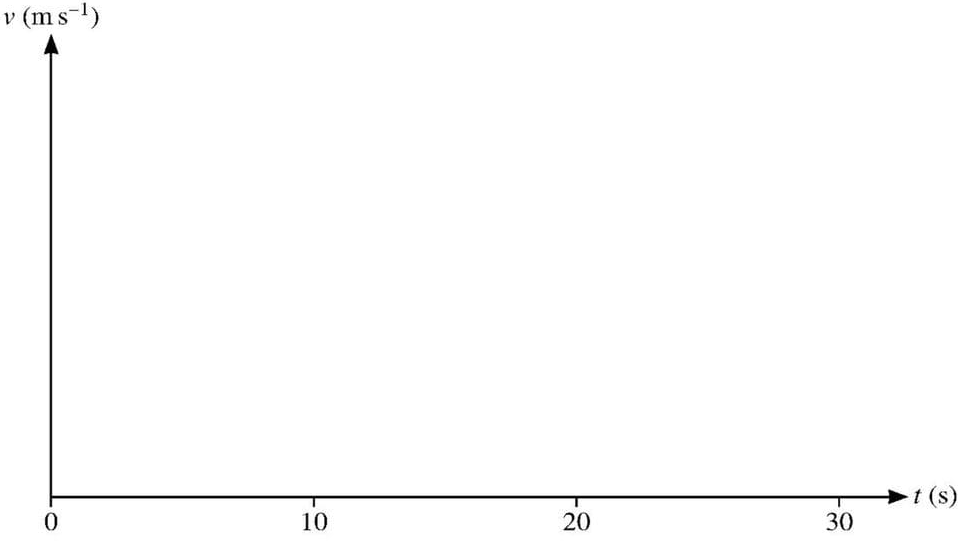
A bus moves in a straight line between two bus stops. The bus starts from rest and accelerates at 2.1 \(\text{m/s}^2\) for 5 s. The bus then travels for 24 s at constant speed and finally slows down, with a constant deceleration, stopping in a further 6 s. Sketch a velocity-time graph for the motion and hence find the distance between the two bus stops.
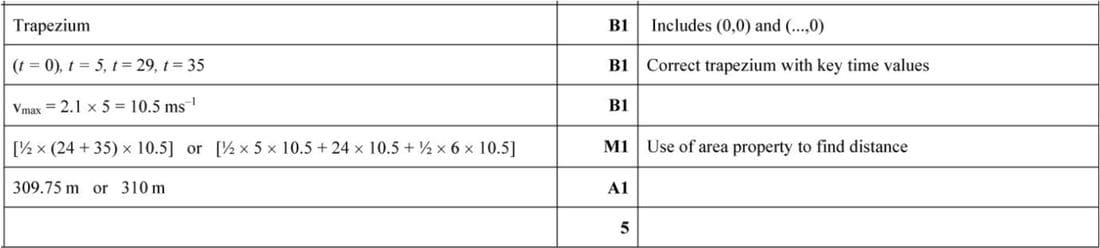
Nov 2018 p43 q4
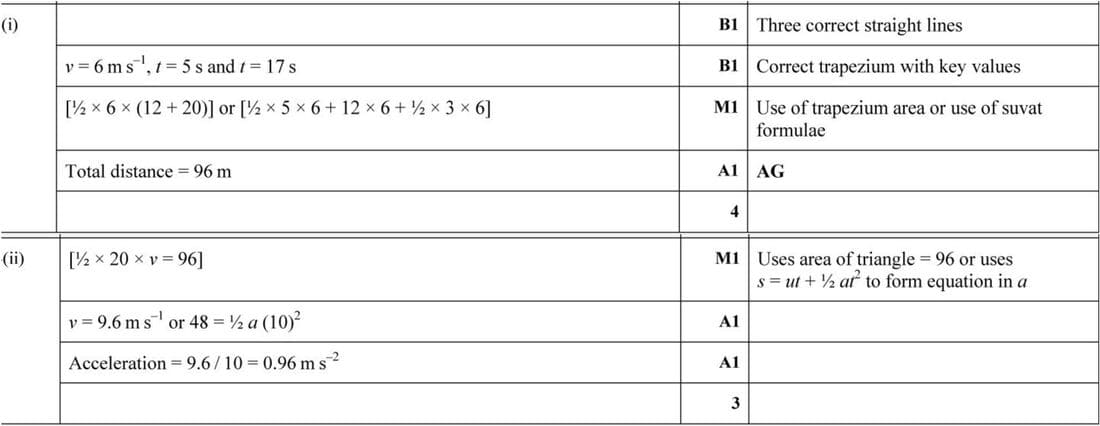
A runner sets off from a point P at time t = 0, where t is in seconds. The runner starts from rest and accelerates at 1.2 m/s2 for 5 s. For the next 12 s the runner moves at constant speed before decelerating uniformly over a period of 3 s, coming to rest at Q. A cyclist sets off from P at time t = 10 and accelerates uniformly for 10 s, before immediately decelerating uniformly to rest at Q at time t = 30.
- Sketch the velocity-time graph for the runner and show that the distance PQ is 96 m.
- Find the magnitude of the acceleration of the cyclist.
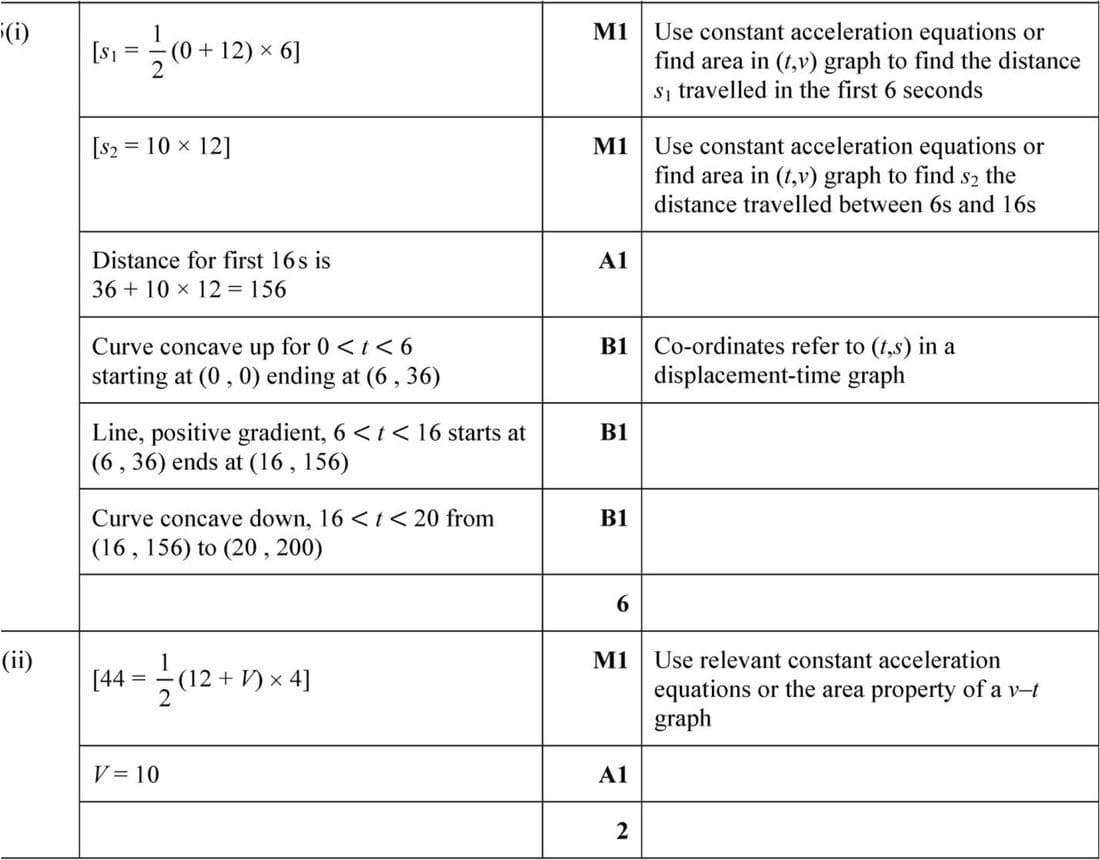
June 2018 p41 q5
A sprinter runs a race of 200 m. His total time for running the race is 20 s. He starts from rest and accelerates uniformly for 6 s, reaching a speed of 12 m/s. He maintains this speed for the next 10 s, before decelerating uniformly to cross the finishing line with speed \(V\) m/s.
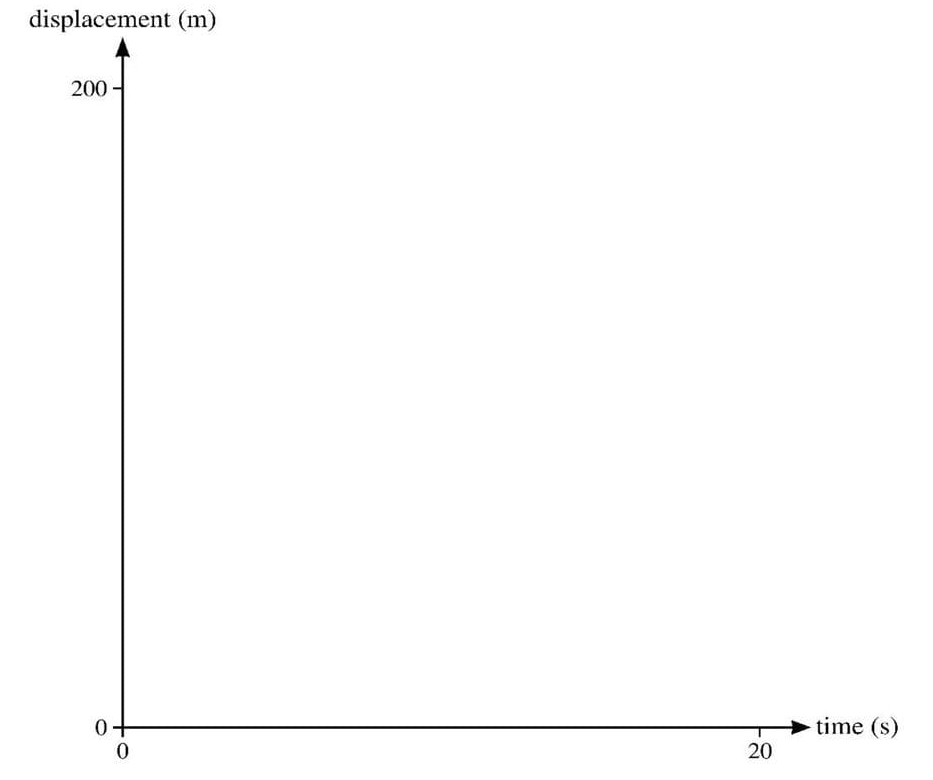
(i) Find the distance travelled by the sprinter in the first 16 s of the race. Hence sketch a displacement-time graph for the 20 s of the sprinter’s race.
(ii) Find the value of \(V\).
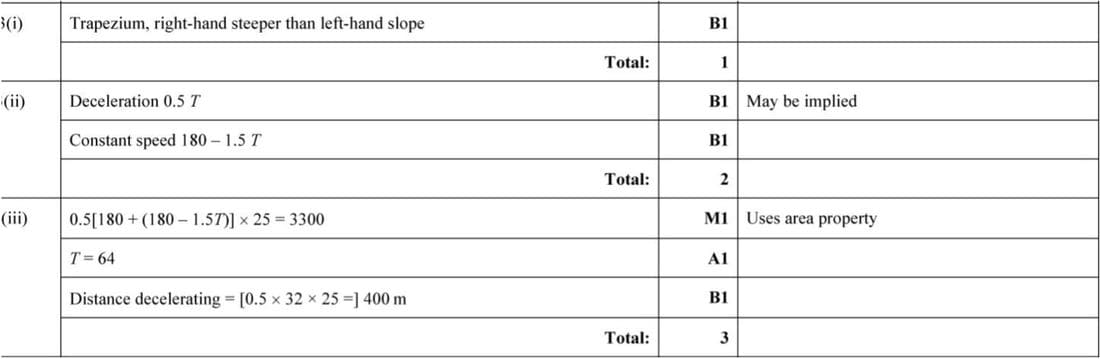
June 2017 p43 q3
A train travels between two stations, A and B. The train starts from rest at A and accelerates at a constant rate for T seconds until it reaches a speed of 25 m s-1. It then travels at this constant speed before decelerating at a constant rate, coming to rest at B. The magnitude of the train’s deceleration is twice the magnitude of its acceleration. The total time taken for the journey is 180 s.
(i) Sketch the velocity-time graph for the train’s journey from A to B.
(ii) Find an expression, in terms of T, for the length of time for which the train is travelling with constant speed.
(iii) The distance from A to B is 3300 m. Find how far the train travels while it is decelerating.
Nov 2016 p42 q7
A car starts from rest and moves in a straight line from point A with constant acceleration 3 m/s2 for 10 s. The car then travels at constant speed for 30 s before decelerating uniformly, coming to rest at point B. The distance AB is 1.5 km.
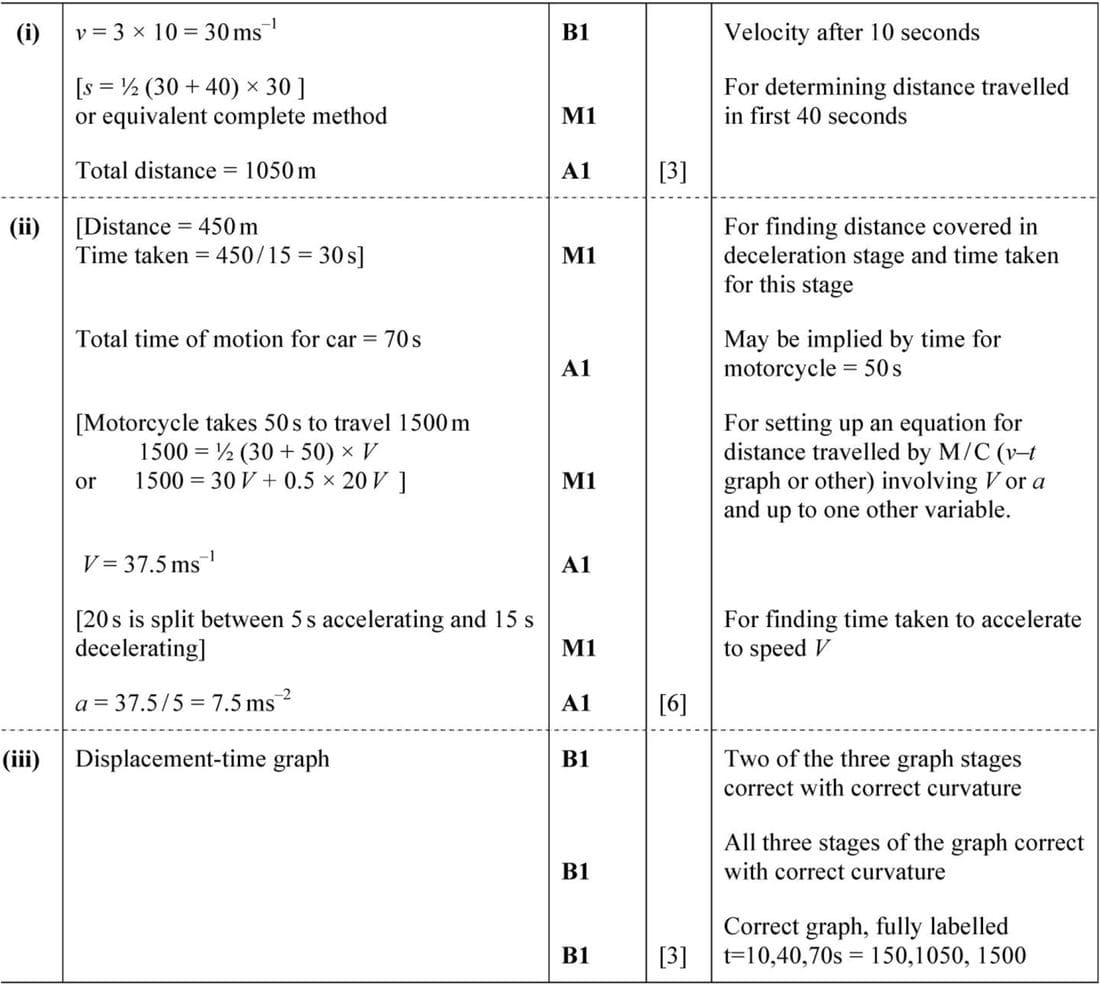
- Find the total distance travelled in the first 40 s of motion.
- When the car has been moving for 20 s, a motorcycle starts from rest and accelerates uniformly in a straight line from point A to a speed V m/s. It then maintains this speed for 30 s before decelerating uniformly to rest at point B. The motorcycle comes to rest at the same time as the car.
- Given that the magnitude of the acceleration a m/s2 of the motorcycle is three times the magnitude of its deceleration, find the value of a.
- Sketch the displacement-time graph for the motion of the car.