Exam-Style Problems
⬅ Back to SubchapterJune 2023 p52 q3
The following back-to-back stem-and-leaf diagram represents the monthly salaries, in dollars, of 27 employees at each of two companies, A and B.
| Company A | Company B | |
|---|---|---|
| 5 4 1 1 0 | 25 | 4 4 5 6 6 7 |
| 9 9 8 7 2 0 | 26 | 0 1 3 5 7 9 9 |
| 8 6 4 2 1 0 | 27 | 1 3 4 6 6 8 8 |
| 6 5 4 2 0 | 28 | 0 1 2 2 2 |
| 9 8 5 | 29 | |
| 1 | 30 | 9 |
Key: 1 | 27 | 6 means $2710 for company A and $2760 for company B.
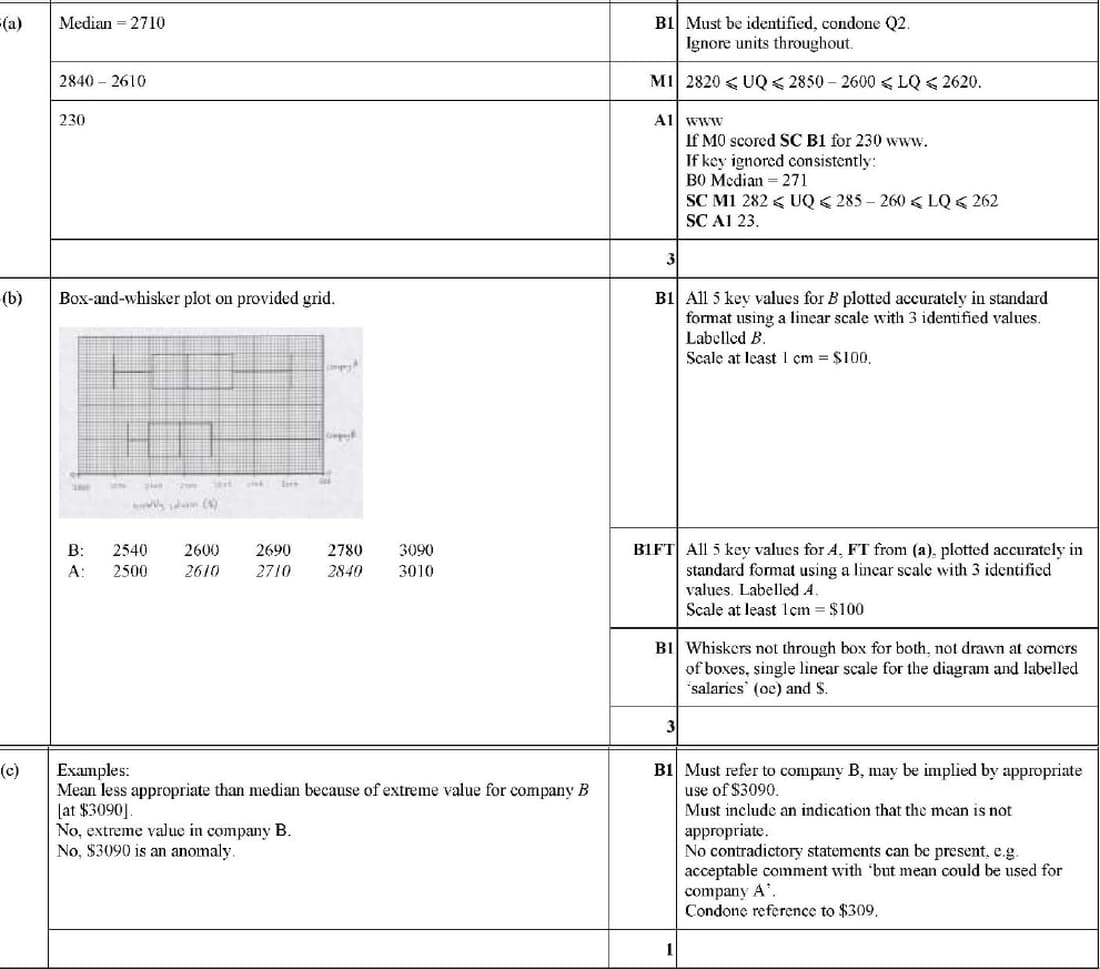
(a) Find the median and the interquartile range of the monthly salaries of employees in company A.
The lower quartile, median and upper quartile for company B are $2600, $2690 and $2780 respectively.
(b) Draw two box-and-whisker plots in a single diagram to represent the information for the salaries of employees at companies A and B.
(c) Comment on whether the mean would be a more appropriate measure than the median for comparing the given information for the two companies.
June 2016 p63 q2
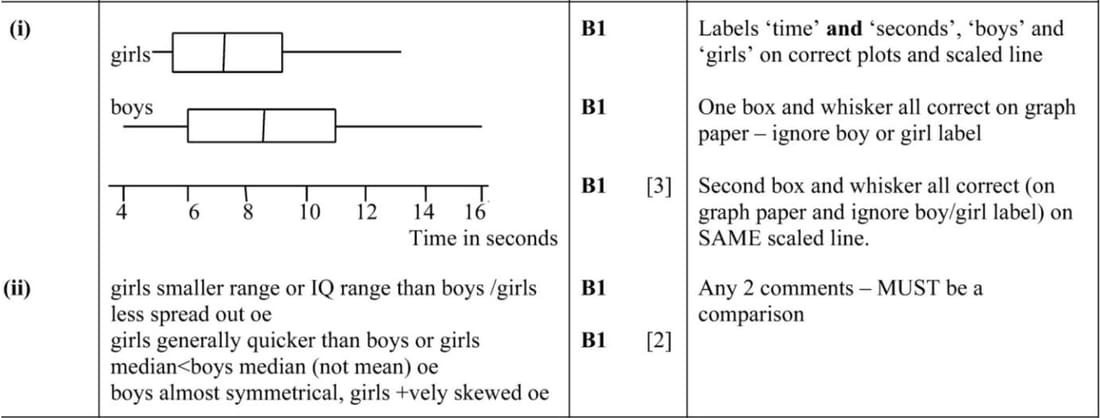
A group of children played a computer game which measured their time in seconds to perform a certain task. A summary of the times taken by girls and boys in the group is shown below.
| Minimum | Lower quartile | Median | Upper quartile | Maximum | |
|---|---|---|---|---|---|
| Girls | 5 | 5.5 | 7 | 9 | 13 |
| Boys | 4 | 6 | 8.5 | 11 | 16 |
- On graph paper, draw two box-and-whisker plots in a single diagram to illustrate the times taken by girls and boys to perform this task.
- State two comparisons of the times taken by girls and boys.
Nov 2014 p63 q4
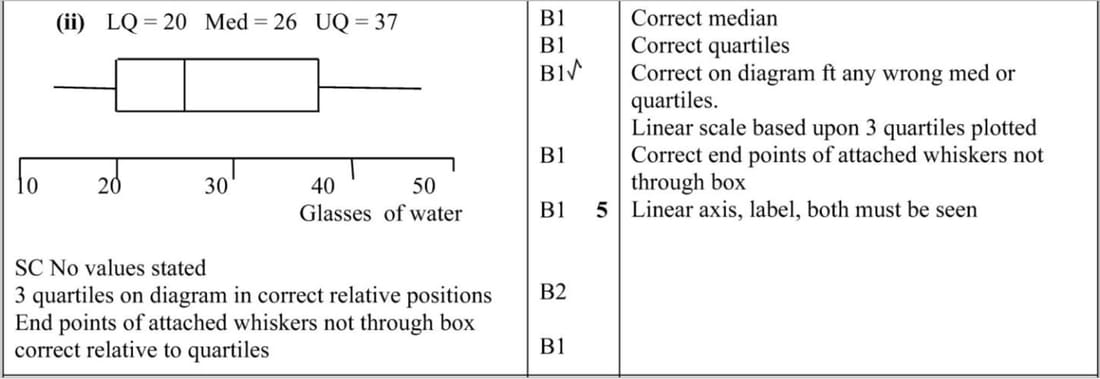
A random sample of 25 people recorded the number of glasses of water they drank in a particular week. The results are shown below.
23, 19, 32, 14, 25, 22, 26, 36, 45, 42, 47, 28, 17, 38, 15, 46, 18, 26, 22, 41, 19, 21, 28, 24, 30
On graph paper draw a box-and-whisker plot to represent the data.
Nov 2014 p61 q4
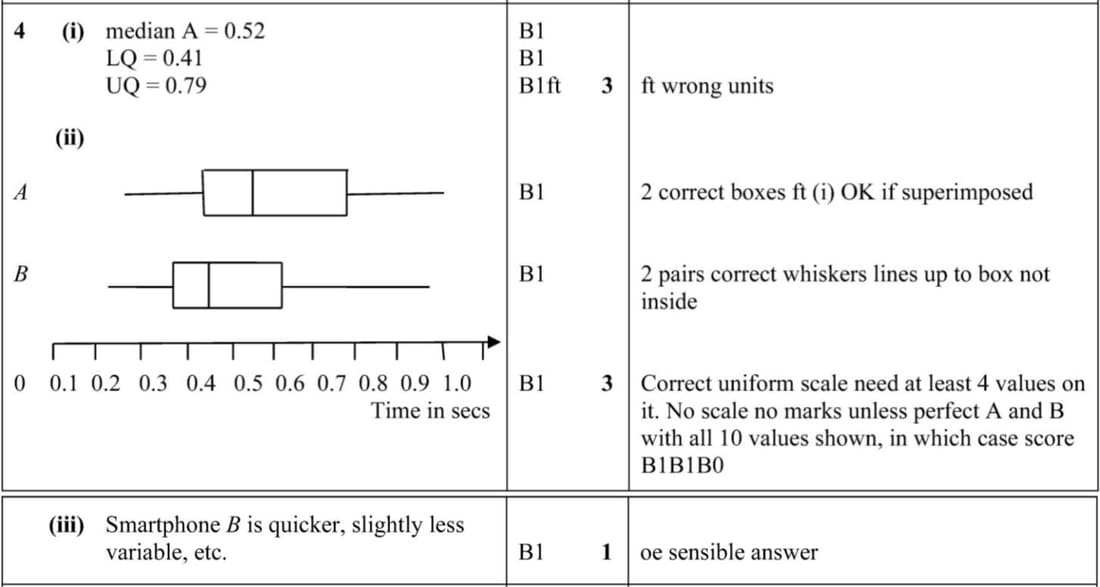
The following back-to-back stem-and-leaf diagram shows the times to load an application on 61 smartphones of type A and 43 smartphones of type B.
| Type A | Type B | |||
|---|---|---|---|---|
| (7) | 9 7 6 6 4 3 3 | 2 | 1 3 5 8 | (4) |
| (7) | 5 5 4 4 2 2 2 | 3 | 0 4 4 5 6 6 6 7 8 9 | (12) |
| (13) | 9 9 8 8 8 7 6 4 3 2 2 0 | 4 | 0 1 1 2 3 6 8 8 9 9 | (10) |
| (9) | 6 5 5 4 3 2 1 1 0 | 5 | 2 5 6 6 9 | (5) |
| (4) | 9 7 3 0 | 6 | 1 3 8 9 | (4) |
| (6) | 8 7 4 4 1 0 | 7 | 5 7 | (2) |
| (10) | 7 6 6 6 5 3 2 1 0 | 8 | 1 2 4 4 | (4) |
| (5) | 8 6 5 5 5 | 9 | 0 6 | (2) |
Key: 3 | 2 | 1 means 0.23 seconds for type A and 0.21 seconds for type B.
- Find the median and quartiles for smartphones of type A.
- Represent the data by drawing a pair of box-and-whisker plots in a single diagram on graph paper.
- Compare the loading times for these two types of smartphone.
Nov 2013 p61 q4
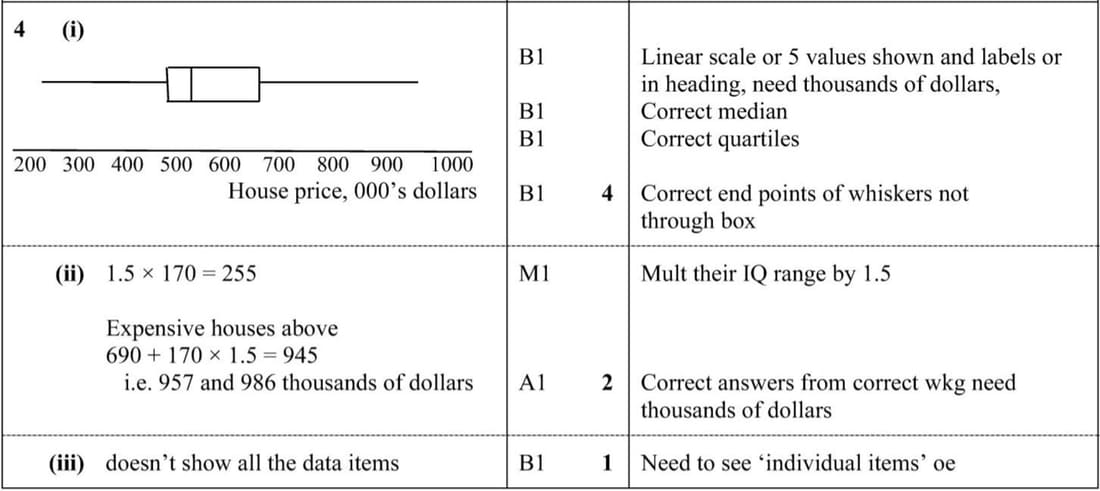
The following are the house prices in thousands of dollars, arranged in ascending order, for 51 houses from a certain area.
| 253 | 270 | 310 | 354 | 386 | 428 | 433 | 468 | 472 | 477 | 485 | 520 | 520 | 524 | 526 | 531 | 535 |
| 536 | 538 | 541 | 543 | 546 | 548 | 549 | 551 | 554 | 572 | 583 | 590 | 605 | 614 | 638 | 649 | 652 |
| 666 | 670 | 682 | 684 | 690 | 710 | 725 | 726 | 731 | 734 | 745 | 760 | 800 | 854 | 863 | 957 | 986 |
- Draw a box-and-whisker plot to represent the data.
- For the above data, give the prices of the expensive houses.
- Give one disadvantage of using a box-and-whisker plot rather than a stem-and-leaf diagram to represent this set of data.
An expensive house is defined as a house which has a price that is more than 1.5 times the interquartile range above the upper quartile.
June 2013 p61 q3
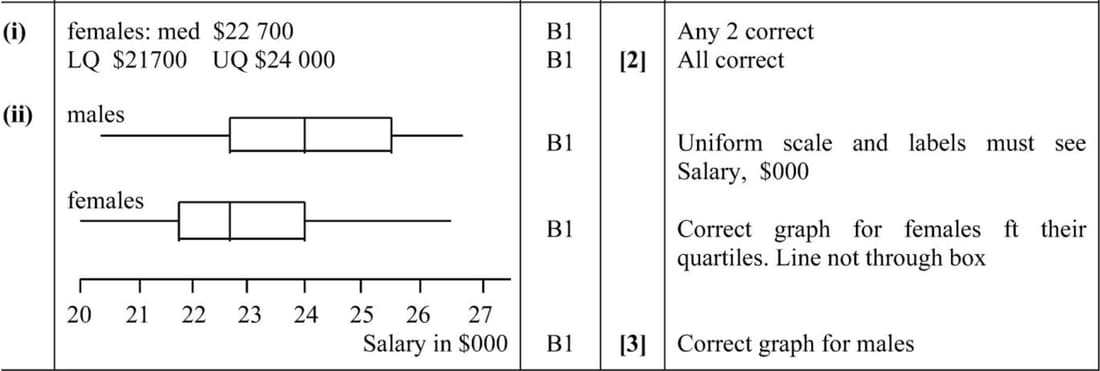
The following back-to-back stem-and-leaf diagram shows the annual salaries of a group of 39 females and 39 males.
| Females | Males | |||
|---|---|---|---|---|
| (4) | 5 2 0 0 | 20 | 3 | (1) |
| (9) | 9 8 8 7 6 4 0 0 0 | 21 | 0 0 7 | (3) |
| (8) | 8 7 5 3 3 1 0 0 | 22 | 0 0 0 4 5 6 6 | (6) |
| (6) | 6 4 2 1 0 0 | 23 | 0 0 2 3 3 5 6 7 7 | (9) |
| (6) | 7 5 4 0 0 0 | 24 | 0 1 1 2 5 5 6 8 8 9 | (10) |
| (4) | 9 5 0 0 | 25 | 3 4 5 7 7 8 9 | (7) |
| (2) | 5 0 | 26 | 0 4 6 | (3) |
Key: 2 | 20 | 3 means $20 200 for females and $20 300 for males.
(i) Find the median and the quartiles of the females’ salaries.
You are given that the median salary of the males is \($24 000\), the lower quartile is \($22 600\) and the upper quartile is \($25 300.\)
(ii) Represent the data by means of a pair of box-and-whisker plots in a single diagram on graph paper.
June 2012 p62 q4
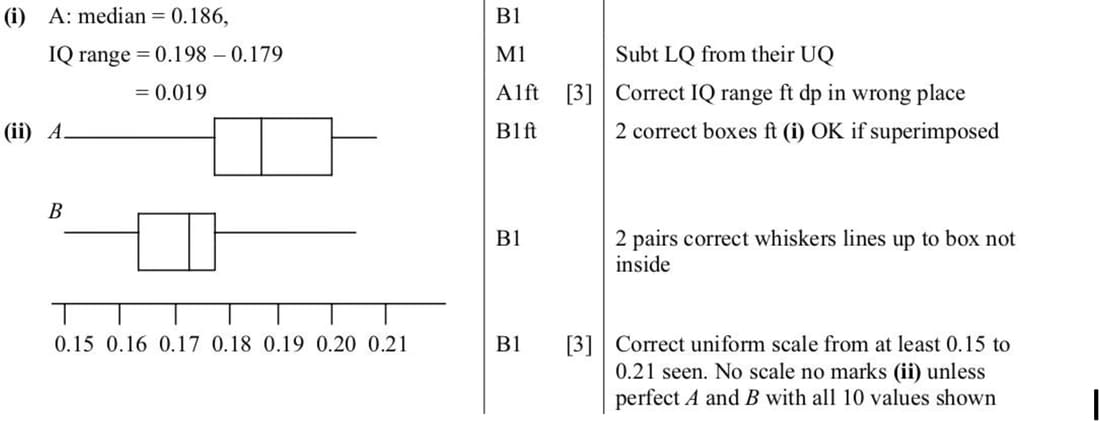
The back-to-back stem-and-leaf diagram shows the values taken by two variables A and B.
| A | B | |||
|---|---|---|---|---|
| (3) | 3 1 0 | 15 | 1 3 3 5 | (4) |
| (2) | 4 1 | 16 | 2 2 3 4 4 5 7 7 8 | (10) |
| (3) | 8 3 3 | 17 | 0 1 3 3 3 4 6 6 7 9 9 | (11) |
| (12) | 9 8 8 6 5 5 4 3 2 1 1 0 | 18 | 2 4 7 | (3) |
| (8) | 9 9 8 8 6 5 4 2 | 19 | 1 5 | (2) |
| (5) | 9 8 7 1 0 | 20 | 4 | (1) |
Key: \(4 \mid 16 \mid 7\) means \(A = 0.164\) and \(B = 0.167\).
- Find the median and the interquartile range for variable A.
- You are given that, for variable B, the median is 0.171, the upper quartile is 0.179 and the lower quartile is 0.164. Draw box-and-whisker plots for A and B in a single diagram on graph paper.
Nov 2011 p61 q4
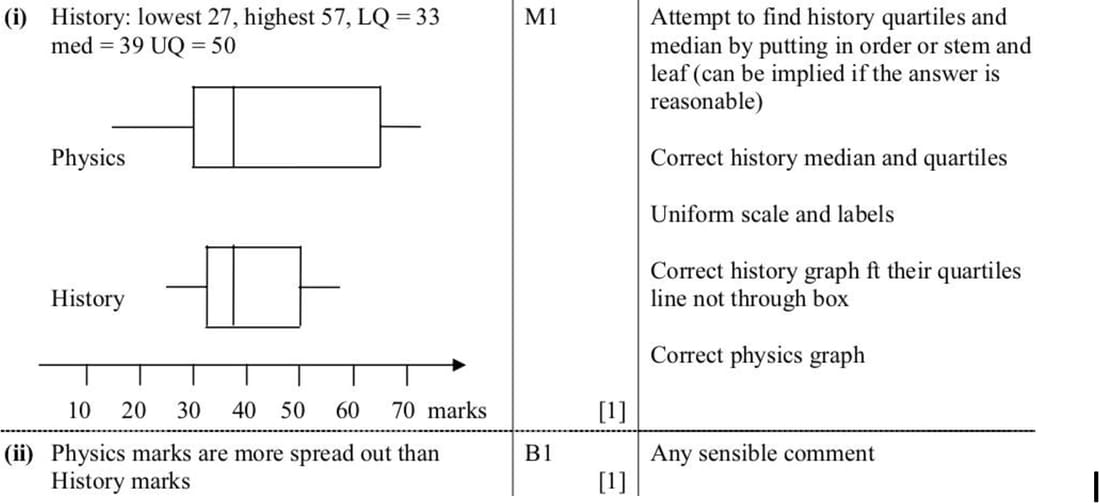
The marks of the pupils in a certain class in a History examination are as follows.
28, 33, 55, 38, 42, 39, 27, 48, 51, 37, 57, 49, 33
The marks of the pupils in a Physics examination are summarised as follows.
Lower quartile: 28, Median: 39, Upper quartile: 67. The lowest mark was 17 and the highest mark was 74.
- Draw box-and-whisker plots in a single diagram on graph paper to illustrate the marks for History and Physics.
- State one difference, which can be seen from the diagram, between the marks for History and Physics.
June 2010 p63 q6
The lengths of some insects of the same type from two countries, X and Y, were measured. The stem-and-leaf diagram shows the results.
| Country X | Country Y | |||
|---|---|---|---|---|
| (10) | 9 7 6 6 6 4 4 3 2 0 | 80 | ||
| (18) | 8 8 7 7 6 6 5 5 5 4 4 3 3 2 2 0 | 81 | 1 1 2 2 3 3 3 5 5 6 7 8 9 | (13) |
| (16) | 9 9 9 8 8 7 7 6 5 5 3 2 1 1 0 0 | 82 | 0 0 1 2 3 3 q 4 5 6 6 7 8 8 | (15) |
| (16) | 8 7 6 5 5 5 3 3 2 2 1 1 1 0 0 | 83 | 0 1 2 2 4 4 4 5 5 6 7 7 7 8 9 | (17) |
| (11) | 8 7 6 5 5 4 4 3 3 1 1 | 84 | 0 1 2 4 4 5 5 6 7 7 7 8 9 | (15) |
| 85 | 1 2 r 3 3 5 5 6 7 8 8 | (12) | ||
| 86 | 0 1 2 2 3 5 5 8 9 9 | (11) |
Key: 5 | 81 | 3 means an insect from country X has length 0.815 cm and an insect from country Y has length 0.813 cm.
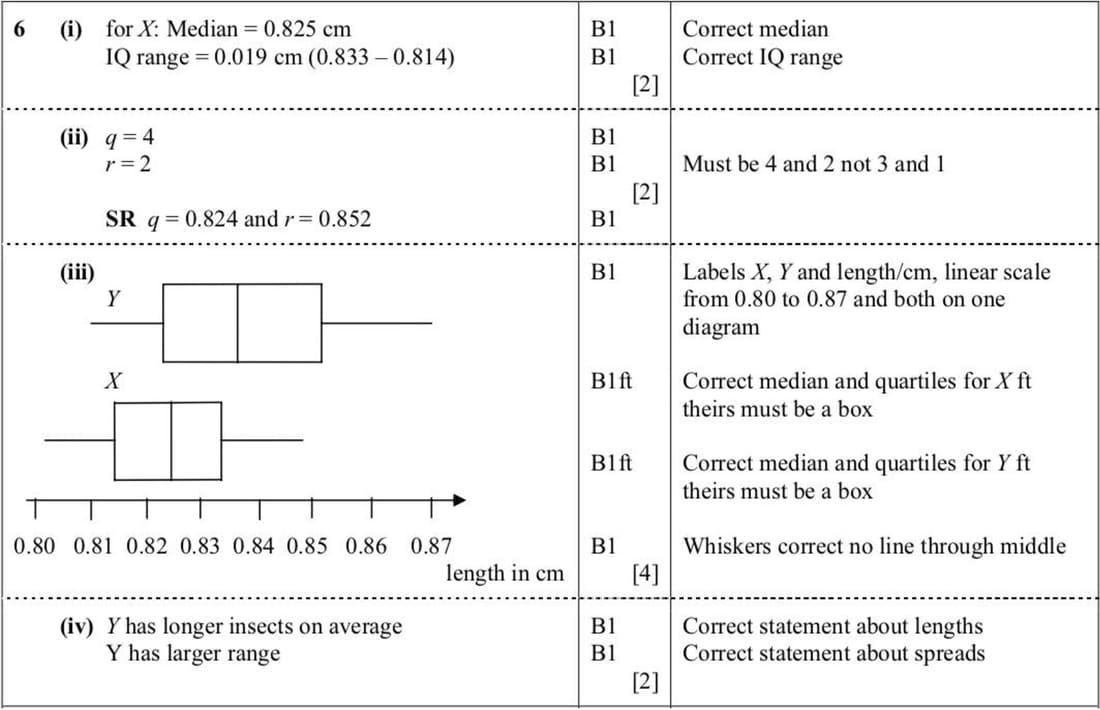
- Find the median and interquartile range of the lengths of the insects from country X.
- The interquartile range of the lengths of the insects from country Y is 0.028 cm. Find the values of \(q\) and \(r\).
- Represent the data by means of a pair of box-and-whisker plots in a single diagram on graph paper.
- Compare the lengths of the insects from the two countries.
Nov 2009 p61 q4
A library has many identical shelves. All the shelves are full and the numbers of books on each shelf in a certain section are summarised by the following stem-and-leaf diagram.
| 3 | 6 9 9 | (4) |
| 4 | 6 7 | (2) |
| 5 | 0 1 2 2 | (4) |
| 6 | 0 1 1 2 3 4 4 4 5 5 6 6 6 7 8 9 | (20) |
| 7 | 1 1 3 3 3 5 6 7 8 9 9 | (12) |
| 8 | 0 2 4 5 5 6 8 | (7) |
| 9 | 0 1 2 4 4 4 5 5 6 7 7 8 8 9 9 | (18) |
Key: \( 3 \mid 6 \) represents 36 books.
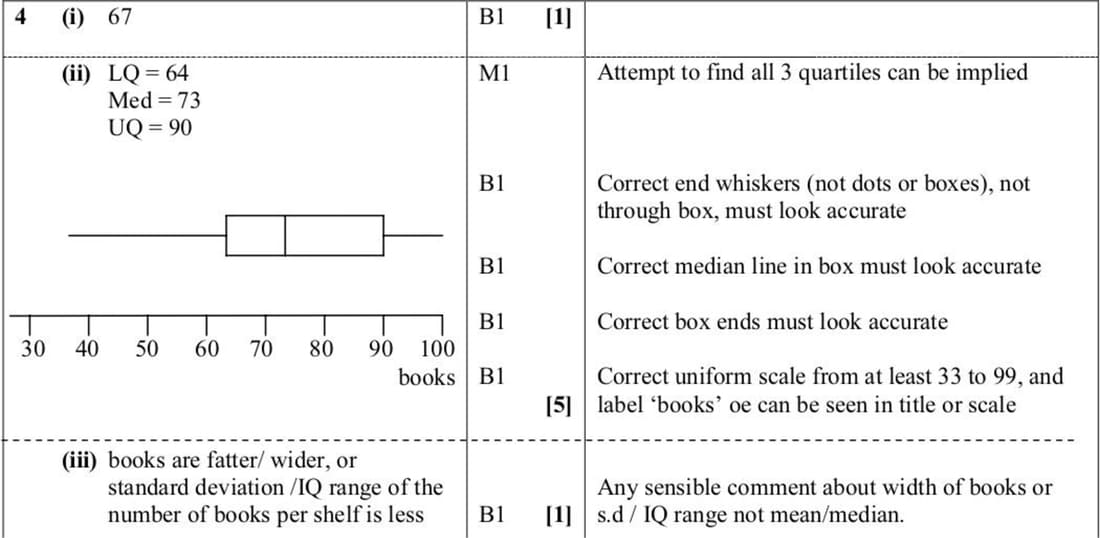
- Find the number of shelves in this section of the library.
- Draw a box-and-whisker plot to represent the data.
In another section all the shelves are full and the numbers of books on each shelf are summarised by the following stem-and-leaf diagram.
| 2 | 1 2 2 3 3 4 5 6 6 6 7 9 | (13) |
| 3 | 0 1 1 2 3 4 5 6 6 7 7 8 8 | (15) |
| 4 | 2 2 3 5 7 8 9 | (8) |
Key: \( 3 \mid 6 \) represents 36 books.
- There are fewer books in this section than in the previous section. State one other difference between the books in this section and the books in the previous section.
Nov 2008 p6 q5
The pulse rates, in beats per minute, of a random sample of 15 small animals are shown in the following table.
| 115 | 120 | 158 | 132 | 125 |
| 104 | 142 | 160 | 145 | 104 |
| 162 | 117 | 109 | 124 | 134 |
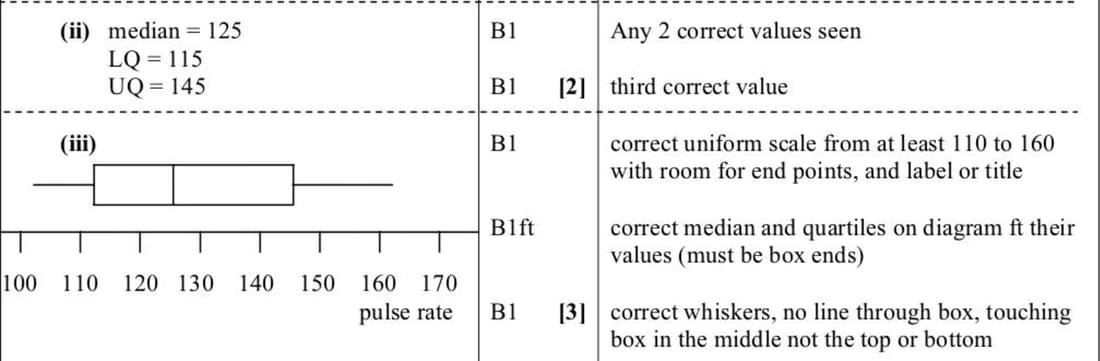
(ii) Find the median and the quartiles.
(iii) On graph paper, using a scale of 2 cm to represent 10 beats per minute, draw a box-and-whisker plot of the data.
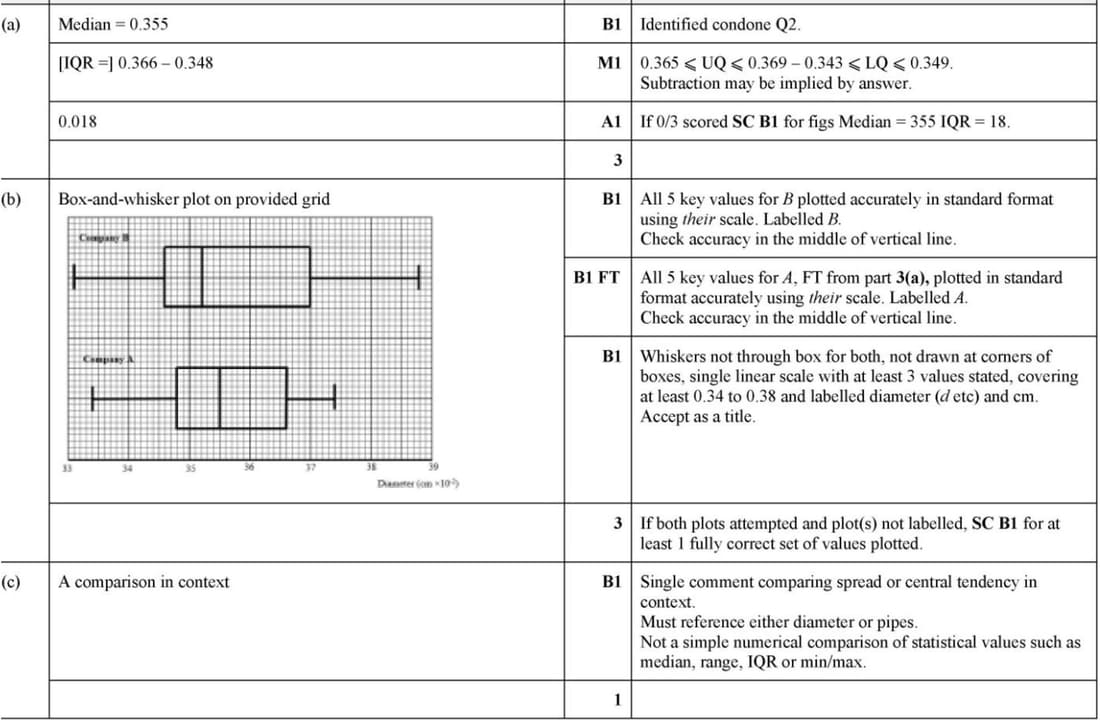
June 2022 p52 q3
The back-to-back stem-and-leaf diagram shows the diameters, in cm, of 19 cylindrical pipes produced by each of two companies, A and B.
| Company A | Company B | |
|---|---|---|
| 9 8 3 2 0 | 33 | 1 2 8 |
| 8 7 5 4 1 | 34 | 1 6 8 9 9 |
| 9 6 5 2 | 35 | 1 2 2 3 |
| 4 3 1 | 36 | 5 6 |
| 37 | 0 3 4 | |
| 38 | 2 8 |
Key: 1 | 35 | 3 means the pipe diameter from company A is 0.351 cm and from company B is 0.353 cm.
- Find the median and interquartile range of the pipes produced by company A.
- It is given that for the pipes produced by company B the lower quartile, median and upper quartile are 0.346 cm, 0.352 cm and 0.370 cm respectively. Draw box-and-whisker plots for companies A and B on the grid below.
- Make one comparison between the diameters of the pipes produced by companies A and B.
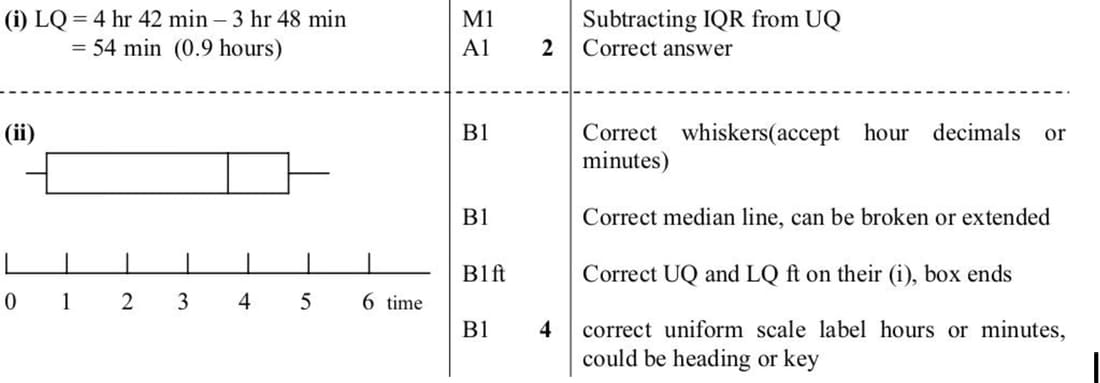
Nov 2006 p6 q3
In a survey, people were asked how long they took to travel to and from work, on average. The median time was 3 hours 36 minutes, the upper quartile was 4 hours 42 minutes and the interquartile range was 3 hours 48 minutes. The longest time taken was 5 hours 12 minutes and the shortest time was 30 minutes.
- Find the lower quartile.
- Represent the information by a box-and-whisker plot, using a scale of 2 cm to represent 60 minutes.
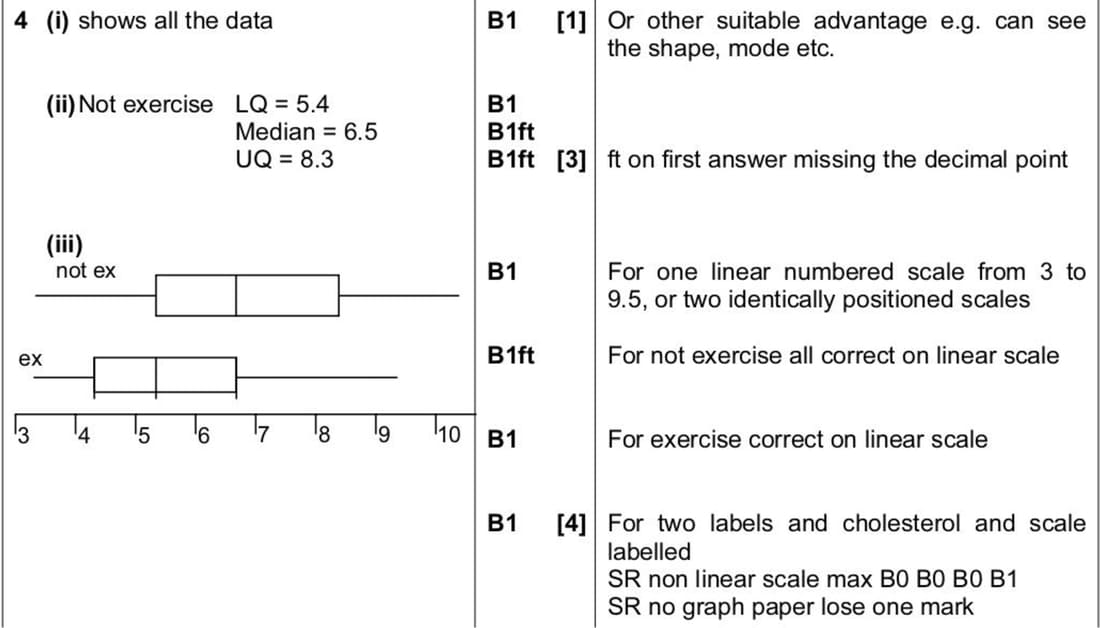
June 2005 p6 q4
The following back-to-back stem-and-leaf diagram shows the cholesterol count for a group of 45 people who exercise daily and for another group of 63 who do not exercise. The figures in brackets show the number of people corresponding to each set of leaves.
| People who exercise | People who do not exercise | |||
|---|---|---|---|---|
| (9) | 9 8 7 6 4 3 2 2 1 | 3 | 1 5 7 7 | (4) |
| (12) | 9 8 8 7 6 6 5 3 3 2 2 | 4 | 2 3 4 4 5 8 | (6) |
| (9) | 8 7 7 7 6 5 3 3 1 | 5 | 1 2 2 2 3 4 4 5 6 7 8 8 9 | (13) |
| (7) | 6 6 6 6 4 3 2 | 6 | 1 2 3 3 4 5 5 5 7 7 8 9 9 | (14) |
| (3) | 8 4 1 | 7 | 2 4 5 5 6 7 8 8 | (9) |
| (4) | 9 5 5 2 | 8 | 1 3 3 4 6 7 9 9 9 | (9) |
| (1) | 4 | 9 | 1 4 5 5 8 | (5) |
| (0) | 10 | 3 3 6 | (3) |
Key: \( 2 \mid 8 \mid 1 \) represents a cholesterol count of \( 8.2 \) in the group who exercise and \( 8.1 \) in the group who do not exercise.
- Give one useful feature of a stem-and-leaf diagram.
- Find the median and the quartiles of the cholesterol count for the group who do not exercise.
- You are given that the lower quartile, median and upper quartile of the cholesterol count for the group who exercise are 4.25, 5.3 and 6.6 respectively.
- On a single diagram on graph paper, draw two box-and-whisker plots to illustrate the data.
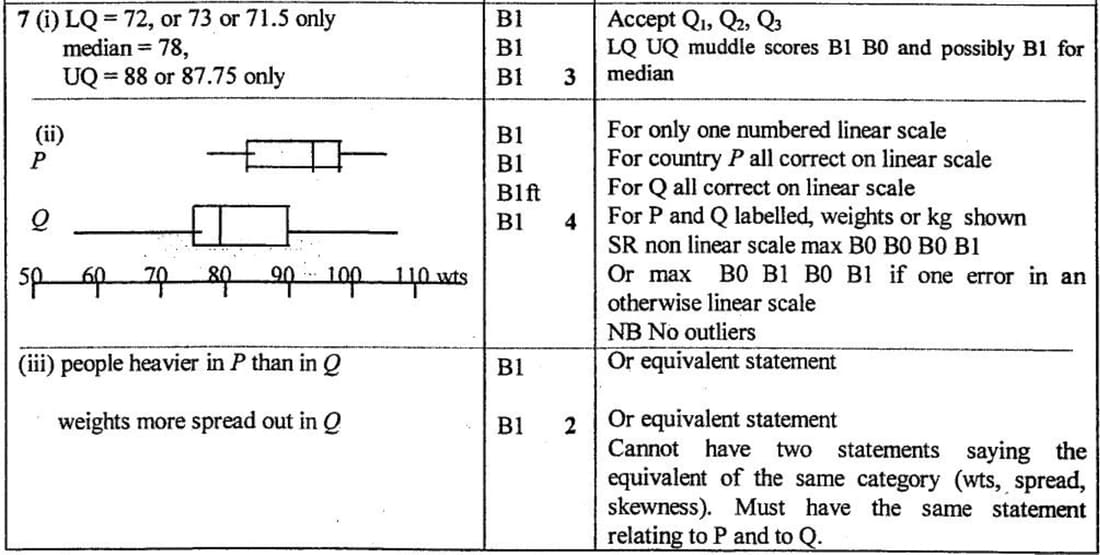
Nov 2002 p6 q7
The weights in kilograms of two groups of 17-year-old males from country P and country Q are displayed in the following back-to-back stem-and-leaf diagram. In the third row of the diagram, 4 | 7 | 1 denotes weights of 74 kg for a male in country P and 71 kg for a male in country Q.
| Country P | Country Q | |
|---|---|---|
| 5 | 1 5 | |
| 6 | 2 3 4 8 | |
| 9 8 7 6 4 | 7 | 1 3 4 5 6 7 7 8 8 9 |
| 8 8 6 6 5 3 | 8 | 2 3 6 7 7 8 8 |
| 9 7 7 6 5 5 5 4 2 | 9 | 0 2 2 4 |
| 5 4 4 3 1 | 10 | 4 5 |
- Find the median and quartile weights for country Q.
- You are given that the lower quartile, median and upper quartile for country P are 84, 94 and 98 kg respectively. On a single diagram on graph paper, draw two box-and-whisker plots of the data.
- Make two comments on the weights of the two groups.
Nov 2021 p51 q6
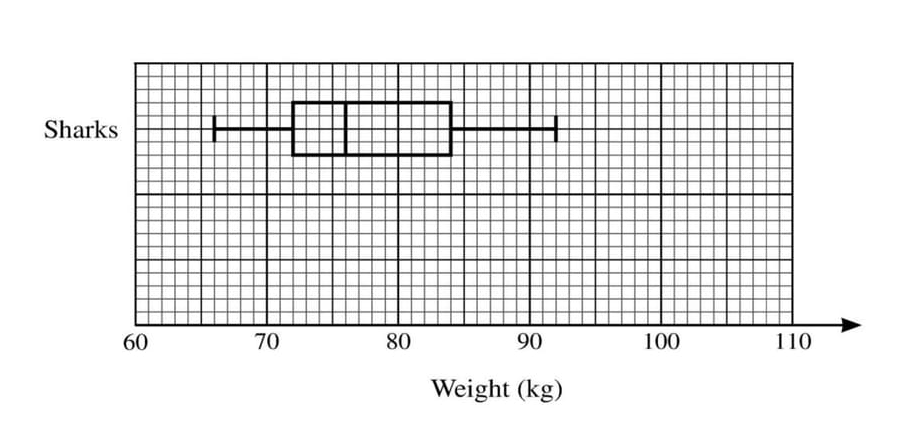
The weights, in kg, of 15 rugby players in the Rebels club and 15 soccer players in the Sharks club are shown below.
| Rebels | 75 | 78 | 79 | 80 | 82 | 82 | 83 | 84 | 85 | 86 | 89 | 93 | 95 | 99 | 102 |
| Sharks | 66 | 68 | 71 | 72 | 74 | 75 | 75 | 76 | 78 | 83 | 83 | 84 | 85 | 86 | 92 |
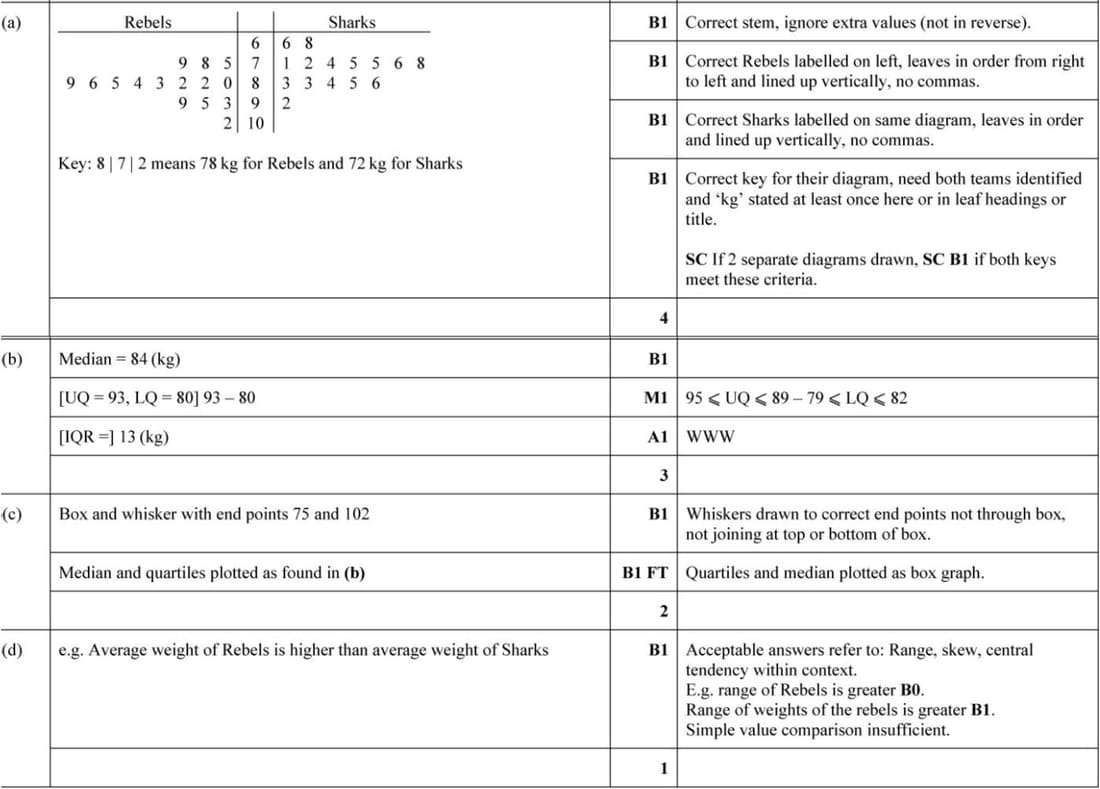
(a) Represent the data by drawing a back-to-back stem-and-leaf diagram with Rebels on the left-hand side of the diagram.
(b) Find the median and the interquartile range for the Rebels.
A box-and-whisker plot for the Sharks is shown below.
(c) On the same diagram, draw a box-and-whisker plot for the Rebels.
(d) Make one comparison between the weights of the players in the Rebels club and the weights of the players in the Sharks club.
June 2020 p52 q3
Two machines, A and B, produce metal rods of a certain type. The lengths, in metres, of 19 rods produced by machine A and 19 rods produced by machine B are shown in the following back-to-back stem-and-leaf diagram.
Stem-and-leaf diagram:
| A | B | |
|---|---|---|
| 21 | 1 2 4 | |
| 7 6 3 0 | 22 | 2 4 5 5 6 |
| 8 7 4 3 1 1 | 23 | 0 2 6 8 9 9 |
| 5 5 5 3 2 | 24 | 3 3 4 6 |
| 4 3 1 0 | 25 | 6 |
Key: 7 | 22 | 4 means 0.227 m for machine A and 0.224 m for machine B.
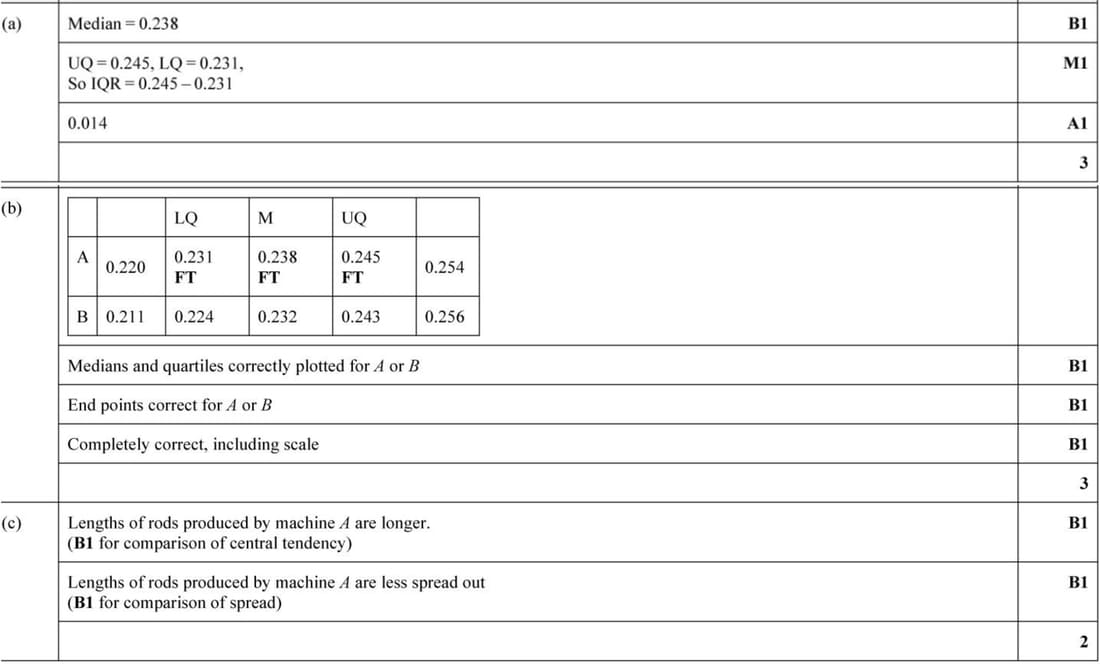
- Find the median and the interquartile range for machine A.
- It is given that for machine B the median is 0.232 m, the lower quartile is 0.224 m and the upper quartile is 0.243 m. Draw box-and-whisker plots for A and B.
- Hence make two comparisons between the lengths of the rods produced by machine A and those produced by machine B.
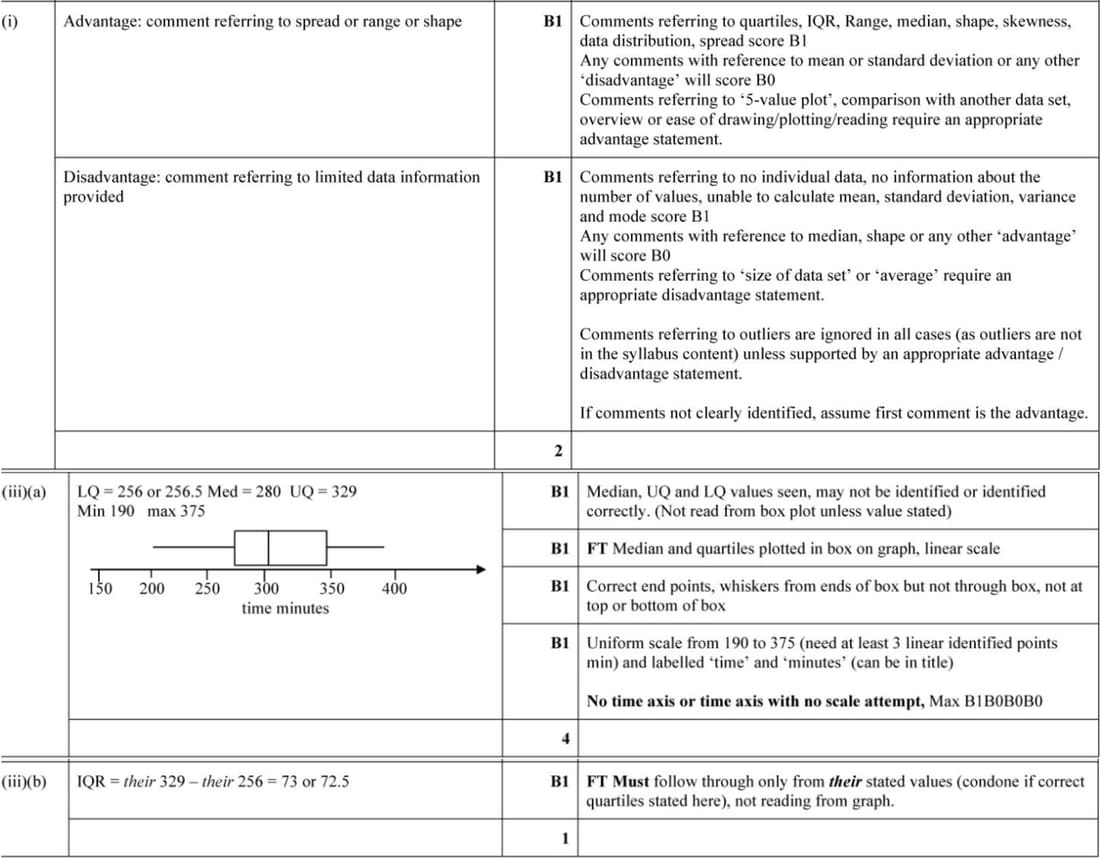
June 2019 p62 q6
- Give one advantage and one disadvantage of using a box-and-whisker plot to represent a set of data.
- On the grid below, draw a box-and-whisker plot to illustrate the times for these 33 people.
- Find the interquartile range of these times.
Another group of 33 people ran the same marathon. Their times (in minutes) are:
| 190 | 203 | 215 | 246 | 249 | 253 | 255 | 254 | 258 | 260 | 261 |
| 263 | 267 | 269 | 274 | 276 | 280 | 288 | 283 | 287 | 294 | 300 |
| 307 | 318 | 327 | 331 | 336 | 345 | 351 | 353 | 360 | 368 | 375 |
June 2018 p61 q2
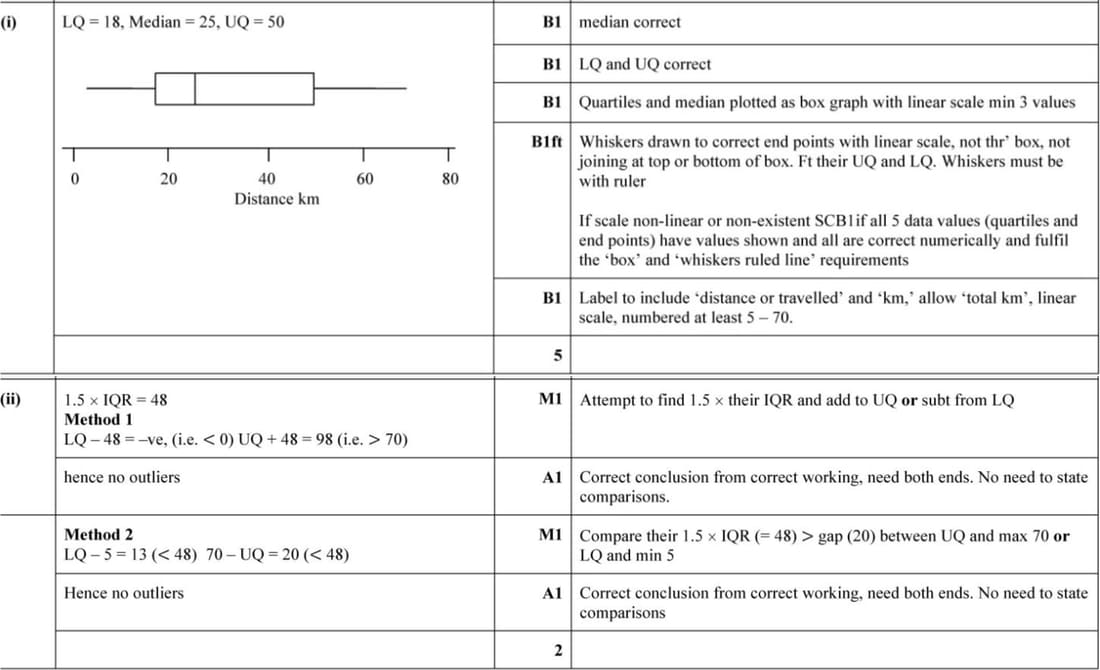
In a survey 55 students were asked to record, to the nearest kilometre, the total number of kilometres they travelled to school in a particular week. The results are shown below.
| 5 | 5 | 9 | 10 | 13 | 13 | 13 | 15 | 15 | 15 | 15 |
| 16 | 18 | 18 | 18 | 19 | 19 | 20 | 20 | 20 | 20 | 21 |
| 21 | 21 | 23 | 25 | 25 | 25 | 27 | 27 | 29 | 30 | 33 |
| 35 | 38 | 39 | 40 | 42 | 45 | 48 | 50 | 50 | 51 | 51 |
| 52 | 55 | 57 | 57 | 60 | 61 | 64 | 65 | 66 | 69 | 70 |
- On the grid, draw a box-and-whisker plot to illustrate the data.
- Show that there are no outliers.
Nov 2017 p63 q5
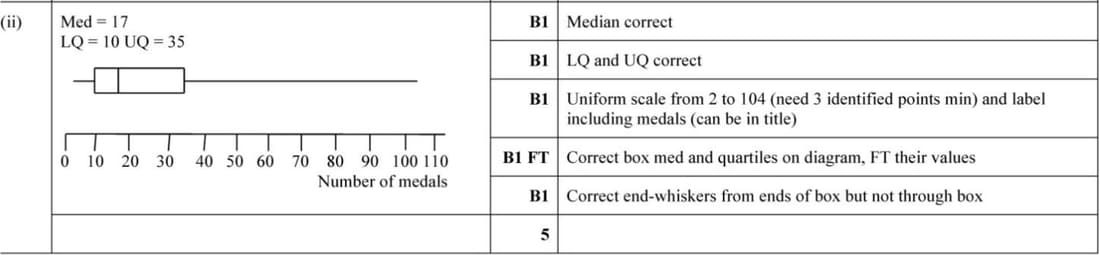
The number of Olympic medals won in the 2012 Olympic Games by the top \(27\) countries is shown below.
| 104 | 88 | 82 | 65 | 44 | 38 | 35 | 34 | 28 |
| 28 | 18 | 18 | 17 | 17 | 14 | 13 | 13 | 12 |
| 12 | 10 | 10 | 10 | 9 | 6 | 5 | 2 | 2 |
Find the median and quartiles of the data and draw a box-and-whisker plot on the grid.
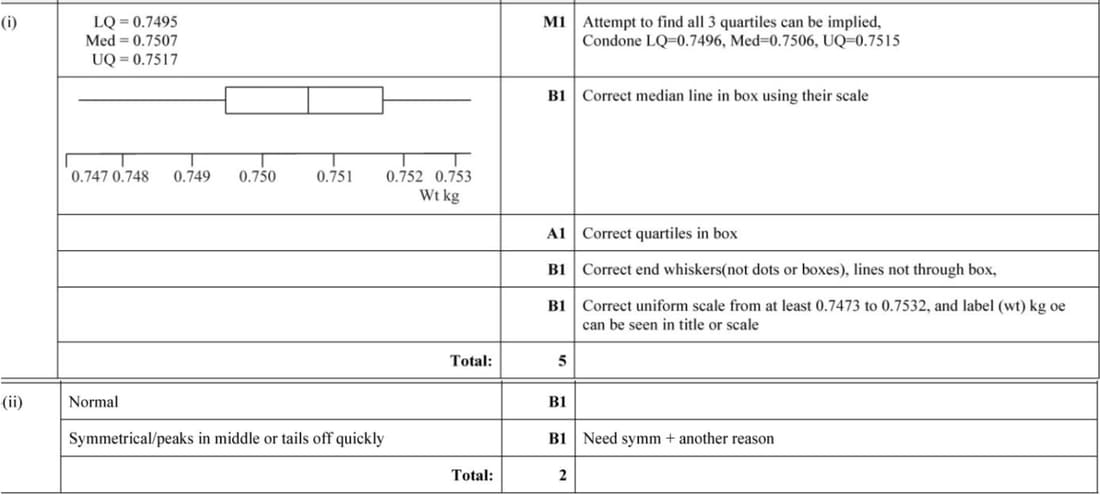
Feb/Mar 2017 p62 q4
The weights in kilograms of packets of cereal were noted correct to 4 significant figures. The following stem-and-leaf diagram shows the data.
The weights in kilograms of packets of cereal were noted correct to 4 significant figures.
| 747 | 3 | (1) |
| 748 | 1 2 5 7 7 9 | (6) |
| 749 | 0 2 2 2 3 5 5 5 6 7 8 9 | (12) |
| 750 | 1 1 2 2 2 3 4 4 5 6 7 7 8 8 9 | (15) |
| 751 | 0 0 2 3 3 4 4 5 5 7 7 9 | (13) |
| 752 | 0 0 0 1 1 2 3 4 4 4 | (11) |
| 753 | 2 | (1) |
Key: 748 | 5 represents 0.7485 kg.
- On the grid, draw a box-and-whisker plot to represent the data.
- Name a distribution that might be a suitable model for the weights of this type of cereal packet. Justify your answer.