Exam-Style Problems
⬅ Back to SubchapterNov 2023 p53 q4
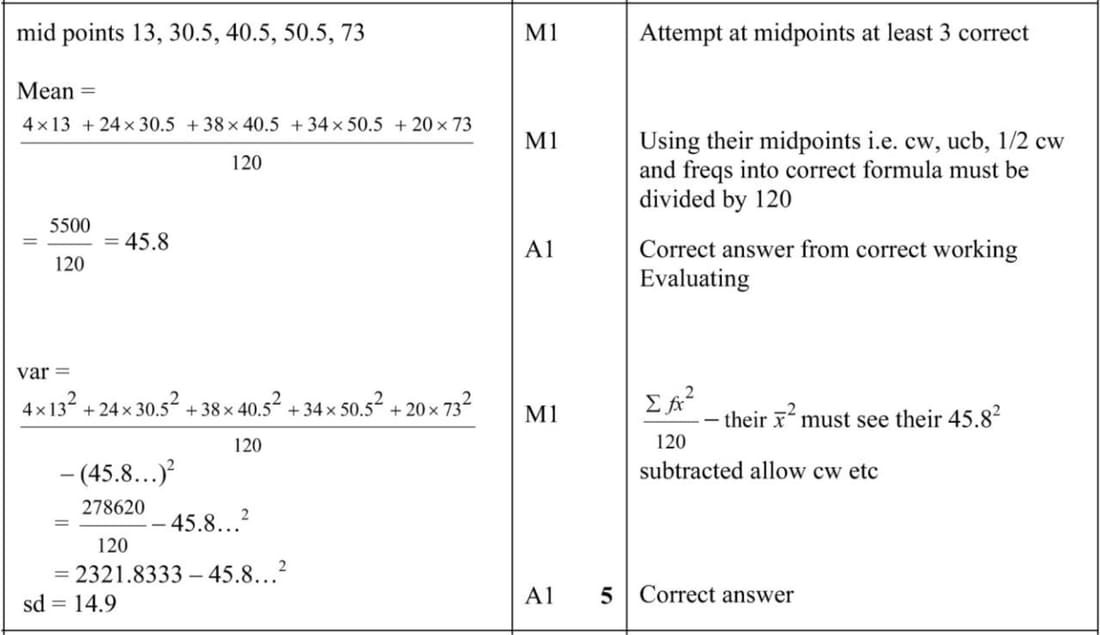
The weights, x kg, of 120 students in a sports college are recorded. The results are summarised in the following table.
| Weight (x kg) | x ≤ 40 | x ≤ 60 | x ≤ 65 | x ≤ 70 | x ≤ 85 | x ≤ 100 |
|---|---|---|---|---|---|---|
| Cumulative frequency | 0 | 14 | 38 | 60 | 106 | 120 |
Calculate estimates for the mean and standard deviation of the weights of the 120 students.
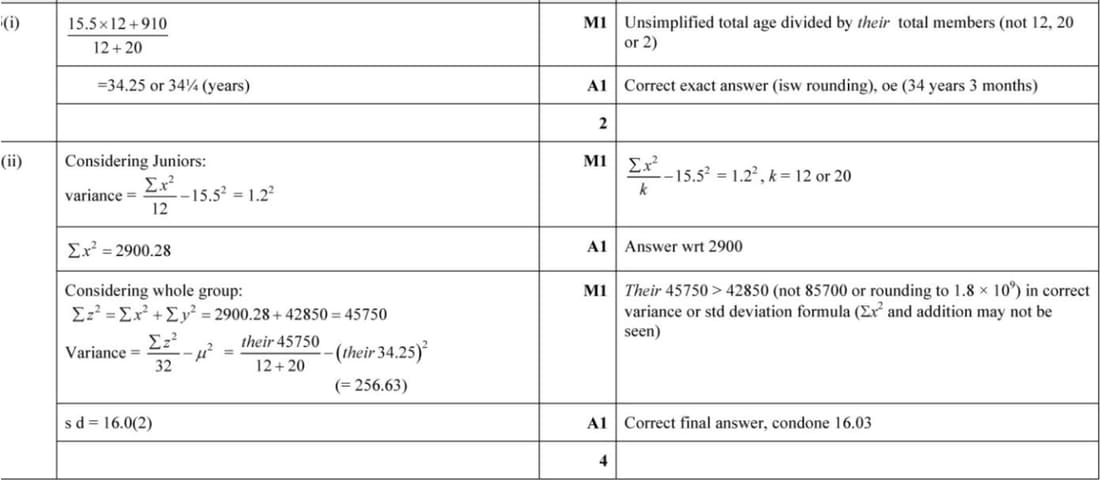
Nov 2018 p62 q5
The Quivers Archery club has 12 Junior members and 20 Senior members. For the Junior members, the mean age is 15.5 years and the standard deviation of the ages is 1.2 years. The ages of the Senior members are summarised by \(\Sigma y = 910\) and \(\Sigma y^2 = 42\,850\), where \(y\) is the age of a Senior member in years.
(i) Find the mean age of all 32 members of the club.
(ii) Find the standard deviation of the ages of all 32 members of the club.
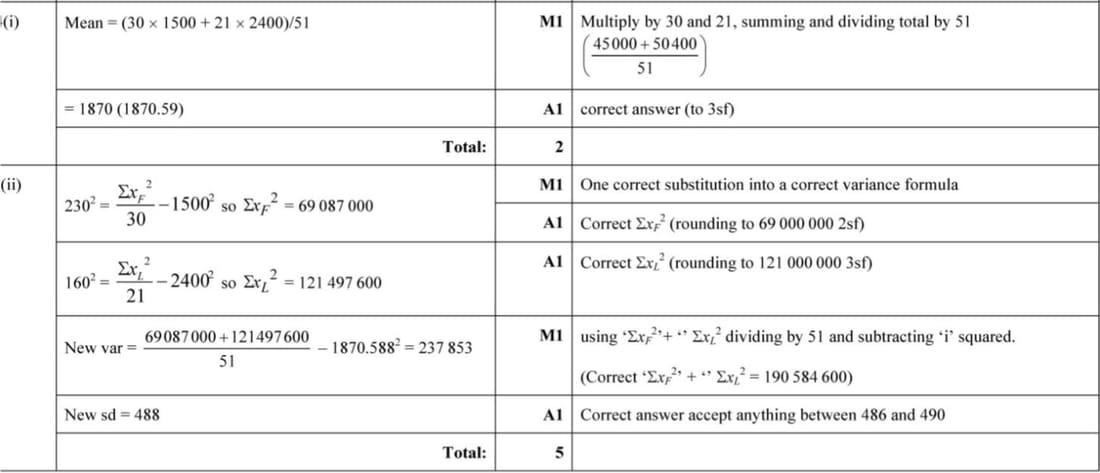
June 2018 p63 q4
Farfield Travel and Lacket Travel are two travel companies which arrange tours abroad. The numbers of holidays arranged in a certain week are recorded in the table below, together with the means and standard deviations of the prices.
| Number of holidays | Mean price ($) | Standard deviation ($) | |
|---|---|---|---|
| Farfield Travel | 30 | 1500 | 230 |
| Lacket Travel | 21 | 2400 | 160 |
(i) Calculate the mean price of all 51 holidays.
(ii) The prices of individual holidays with Farfield Travel are denoted by $x_F$ and the prices of individual holidays with Lacket Travel are denoted by $x_L$. By first finding $\sum x_F^2$ and $\sum x_L^2$, find the standard deviation of the prices of all 51 holidays.
June 2018 p62 q1
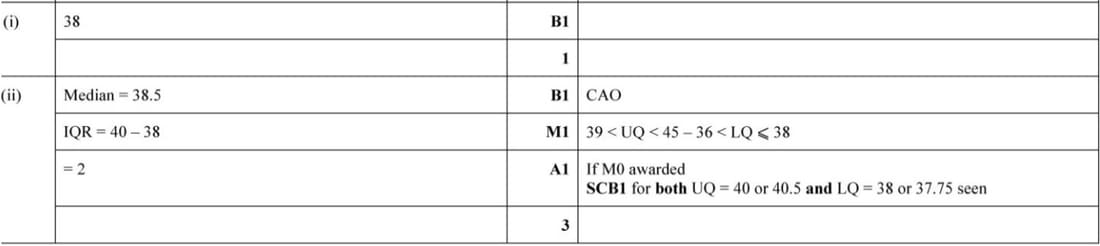
Each of a group of 10 boys estimates the length of a piece of string. The estimates, in centimetres, are as follows.
37, 40, 45, 38, 36, 38, 42, 38, 40, 39
- Find the mode.
- Find the median and the interquartile range.
Nov 2017 p61 q4
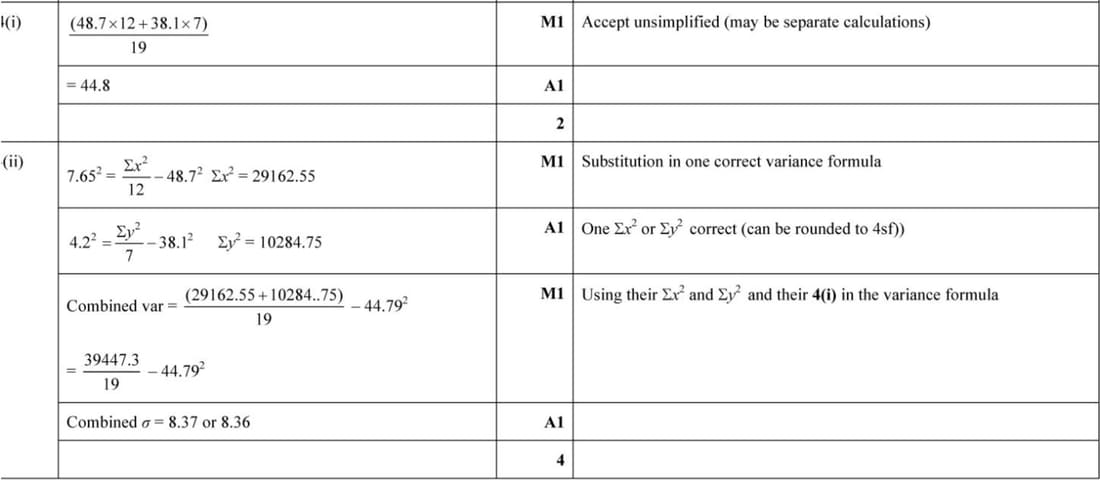
The ages of a group of 12 people at an Art class have mean 48.7 years and standard deviation 7.65 years. The ages of a group of 7 people at another Art class have mean 38.1 years and standard deviation 4.2 years.\n\n(i) Find the mean age of all 19 people.\n\n(ii) The individual ages in years of people in the first Art class are denoted by \(x\) and those in the second Art class by \(y\). By first finding \(\Sigma x^2\) and \(\Sigma y^2\), find the standard deviation of the ages of all 19 people.
June 2017 p62 q1
Rani and Diksha go shopping for clothes.
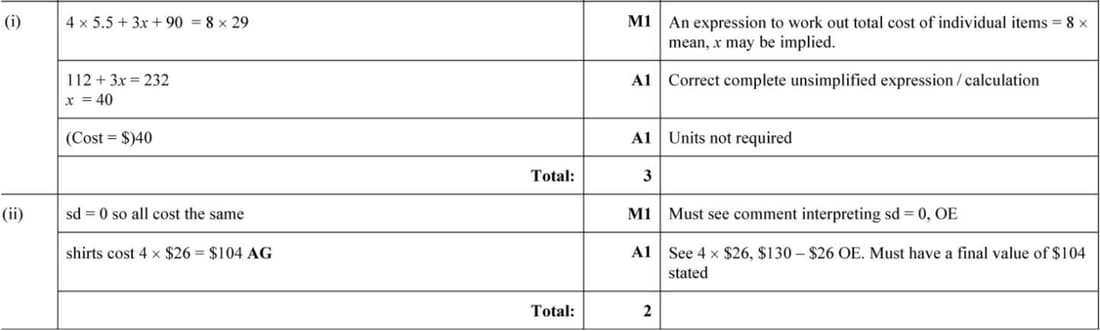
(i) Rani buys 4 identical vests, 3 identical sweaters and 1 coat. Each vest costs $5.50 and the coat costs $90. The mean cost of Rani’s 8 items is $29. Find the cost of a sweater.
(ii) Diksha buys 1 hat and 4 identical shirts. The mean cost of Diksha’s 5 items is $26 and the standard deviation is $0. Explain how you can tell that Diksha spends $104 on shirts.
June 2015 p62 q2
120 people were asked to read an article in a newspaper. The times taken, to the nearest second, by the people to read the article are summarised in the following table.
| Time (seconds) | 1 – 25 | 26 – 35 | 36 – 45 | 46 – 55 | 56 – 90 |
|---|---|---|---|---|---|
| Number of people | 4 | 24 | 38 | 34 | 20 |
Calculate estimates of the mean and standard deviation of the reading times.
June 2015 p61 q5
The table shows the mean and standard deviation of the weights of some turkeys and geese.
| Number of birds | Mean (kg) | Standard deviation (kg) | |
|---|---|---|---|
| Turkeys | 9 | 7.1 | 1.45 |
| Geese | 18 | 5.2 | 0.96 |
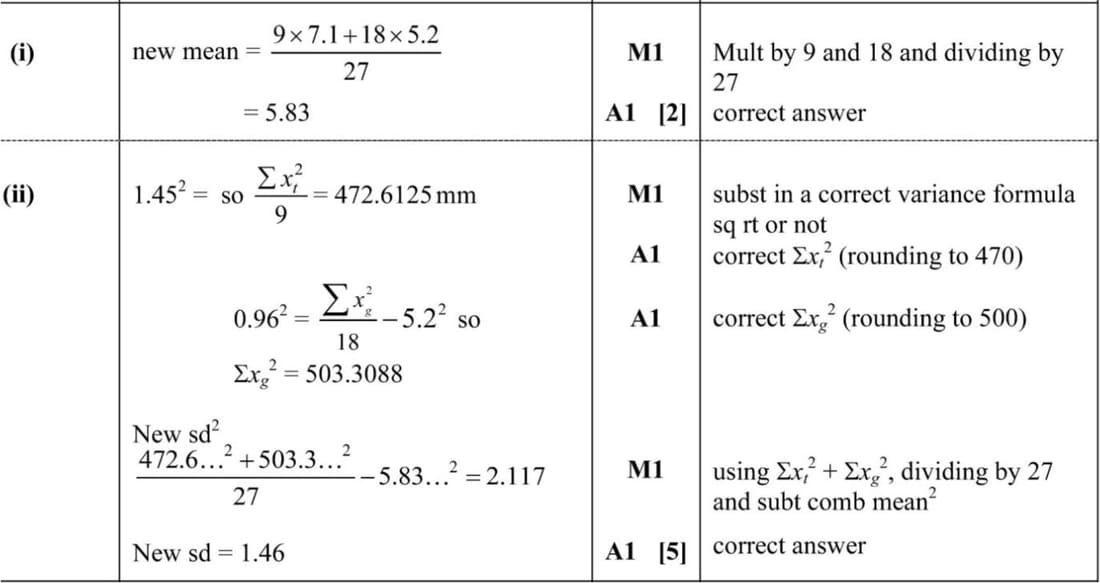
(i) Find the mean weight of the 27 birds.
(ii) The weights of individual turkeys are denoted by \(x_t\) kg and the weights of individual geese by \(x_g\) kg. By first finding \(\Sigma x_t^2\) and \(\Sigma x_g^2\), find the standard deviation of the weights of all 27 birds.
Nov 2014 p61 q1
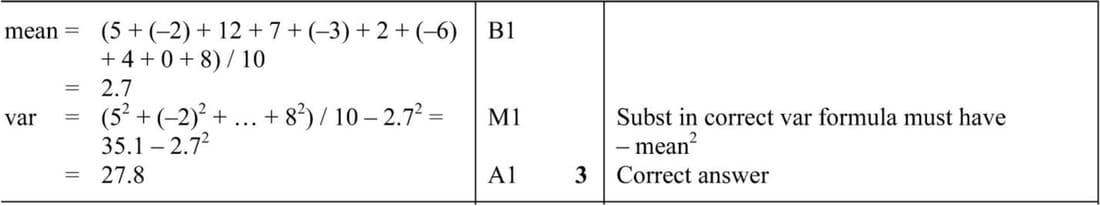
Find the mean and variance of the following data. 5 \(-2\) 12 7 \(-3\) 2 \(-6\) 4 0 8
June 2014 p63 q4
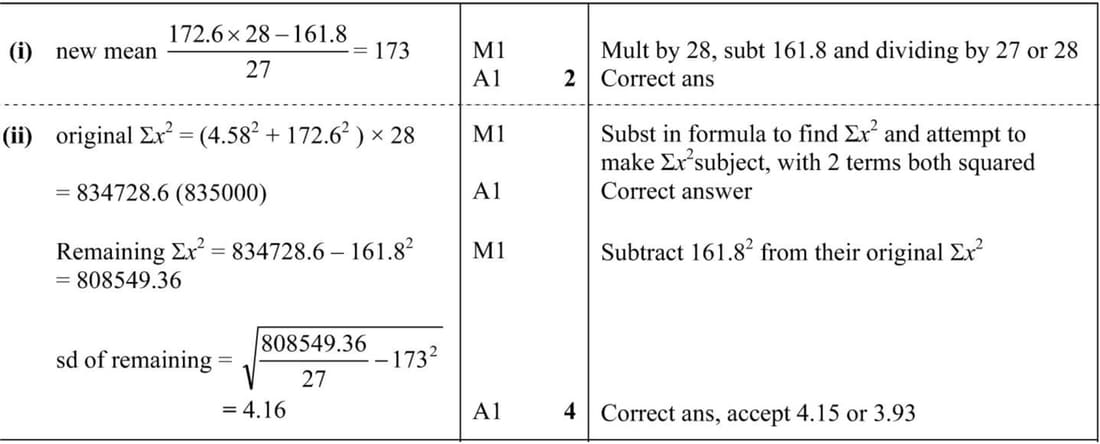
The heights, \(x\) cm, of a group of 28 people were measured. The mean height was found to be 172.6 cm and the standard deviation was found to be 4.58 cm. A person whose height was 161.8 cm left the group. (i) Find the mean height of the remaining group of 27 people. (ii) Find \(\Sigma x^2\) for the original group of 28 people. Hence find the standard deviation of the heights of the remaining group of 27 people.
Nov 2013 p63 q4
Barry weighs 20 oranges and 25 lemons. For the oranges, the mean weight is 220 g and the standard deviation is 32 g. For the lemons, the mean weight is 118 g and the standard deviation is 12 g.
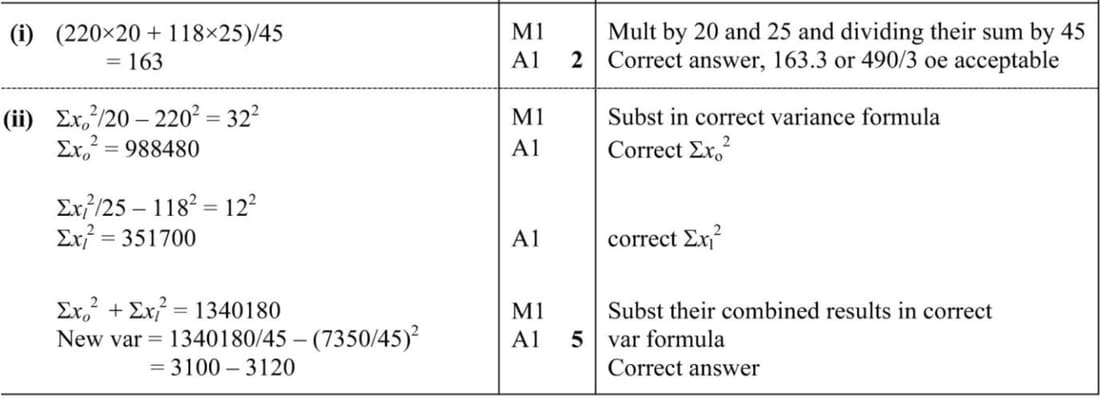
(i) Find the mean weight of the 45 fruits.
(ii) The individual weights of the oranges in grams are denoted by \(x_o\), and the individual weights of the lemons in grams are denoted by \(x_l\). By first finding \(\Sigma x_o^2\) and \(\Sigma x_l^2\), find the variance of the weights of the 45 fruits.
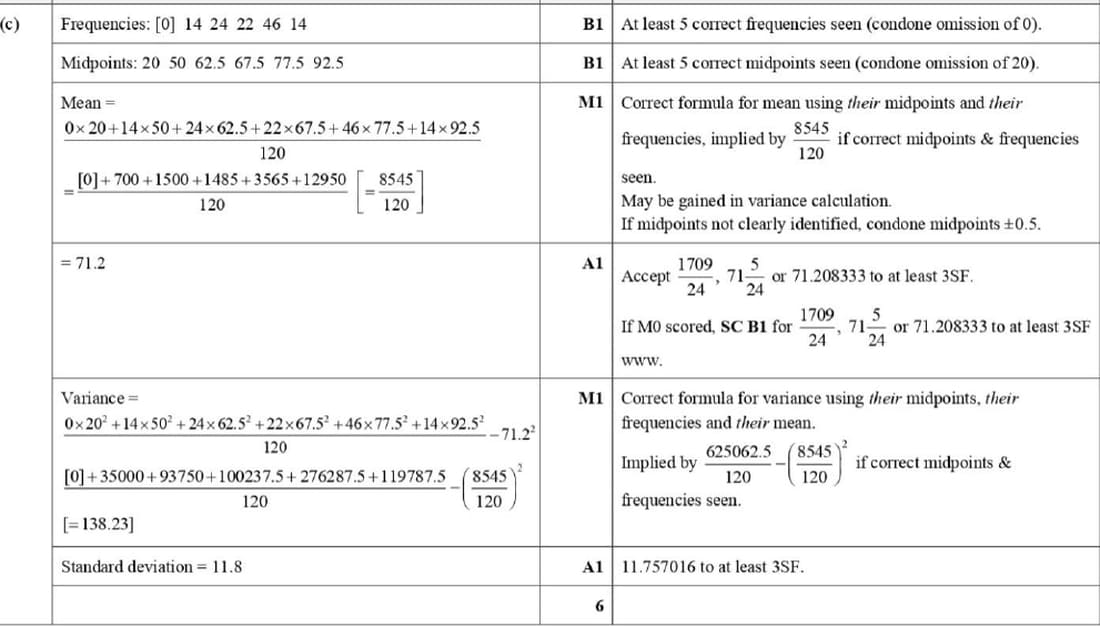
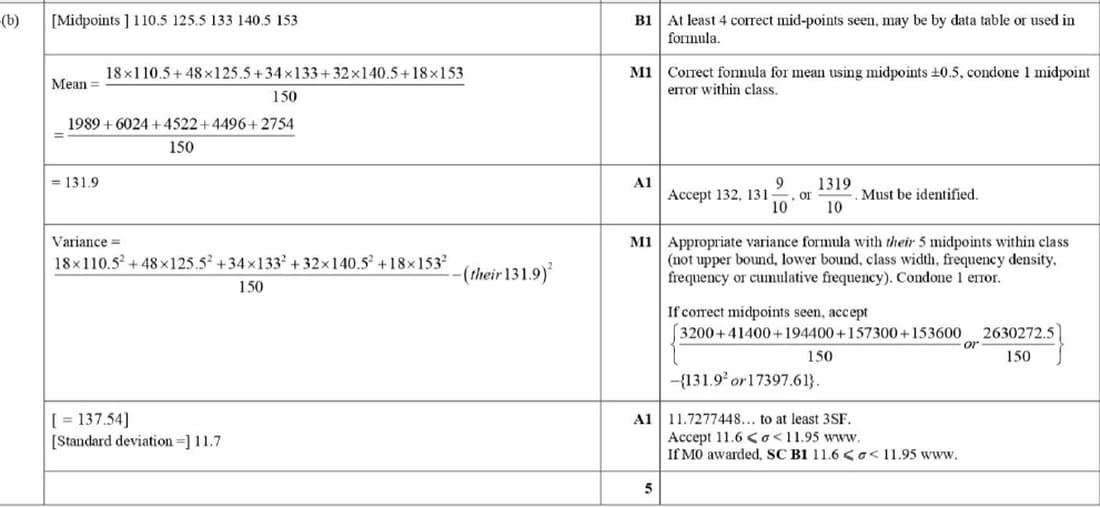
Nov 2023 p51 q4
The times, to the nearest minute, of 150 athletes taking part in a charity run are recorded. The results are summarised in the table.
| Time in minutes | 101 – 120 | 121 – 130 | 131 – 135 | 136 – 145 | 146 – 160 |
|---|---|---|---|---|---|
| Frequency | 18 | 48 | 34 | 32 | 18 |
Calculate estimates for the mean and standard deviation of the times taken by the athletes.
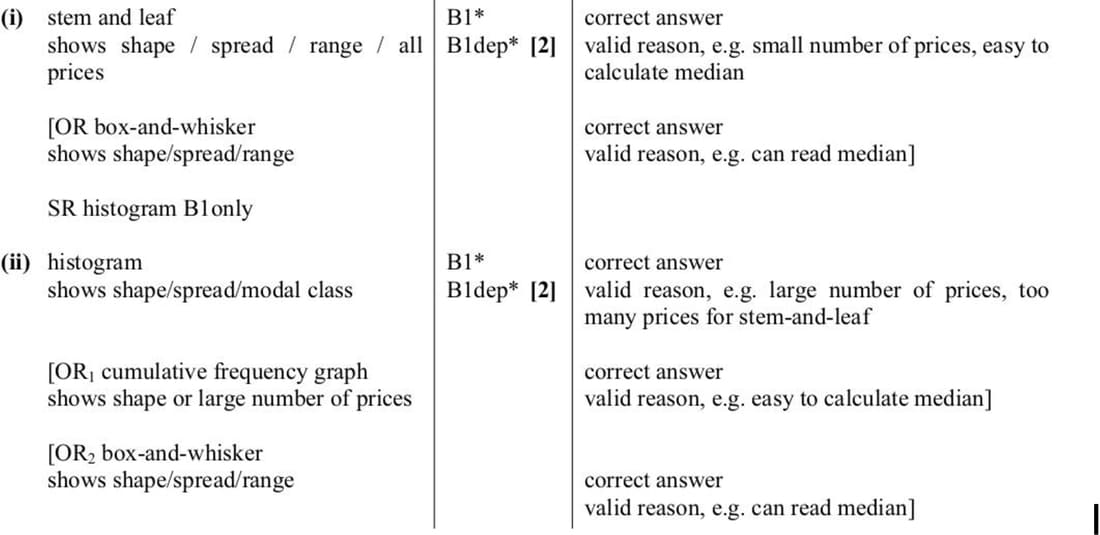
June 2012 p63 q1
Ashfaq and Kuljit have done a school statistics project on the prices of a particular model of headphones for MP3 players. Ashfaq collected prices from 21 shops. Kuljit used the internet to collect prices from 163 websites.
- Name a suitable statistical diagram for Ashfaq to represent his data, together with a reason for choosing this particular diagram. [2]
- Name a suitable statistical diagram for Kuljit to represent her data, together with a reason for choosing this particular diagram. [2]
Nov 2011 p62 q1
The following are the times, in minutes, taken by 11 runners to complete a 10 km run.
48.3, 55.2, 59.9, 67.7, 60.5, 75.6, 62.5, 57.4, 53.4, 49.2, 64.1
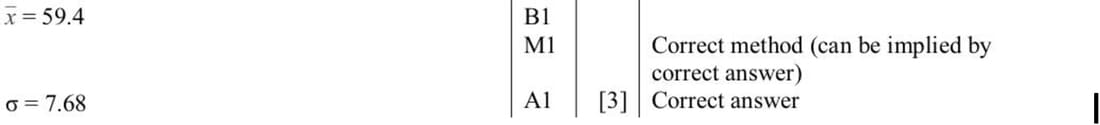
Find the mean and standard deviation of these times.
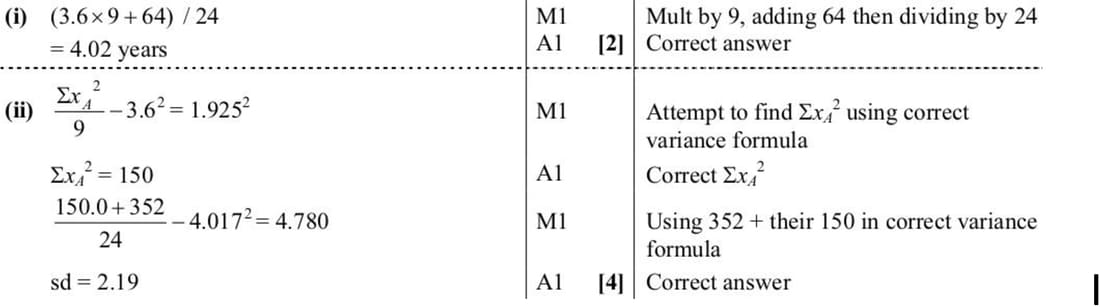
June 2011 p63 q1
Red Street Garage has 9 used cars for sale. Fairwheel Garage has 15 used cars for sale. The mean age of the cars in Red Street Garage is 3.6 years and the standard deviation is 1.925 years. In Fairwheel Garage, \(\Sigma x = 64\) and \(\Sigma x^2 = 352\), where \(x\) is the age of a car in years.
(i) Find the mean age of all 24 cars.
(ii) Find the standard deviation of the ages of all 24 cars.
June 2010 p62 q1
The times in minutes for seven students to become proficient at a new computer game were measured. The results are shown below.
15, 10, 48, 10, 19, 14, 16
- Find the mean and standard deviation of these times.
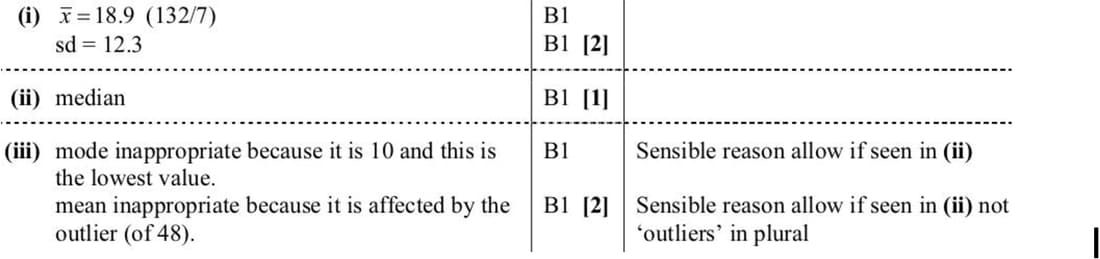
- State which of the mean, median or mode you consider would be most appropriate to use as a measure of central tendency to represent the data in this case.
- For each of the two measures of average you did not choose in part (ii), give a reason why you consider it inappropriate.
June 2010 p61 q4
The numbers of rides taken by two students, Fei and Graeme, at a fairground are shown in the following table.
| Roller coaster | Water slide | Revolving drum | |
|---|---|---|---|
| Fei | 4 | 2 | 0 |
| Graeme | 1 | 3 | 6 |
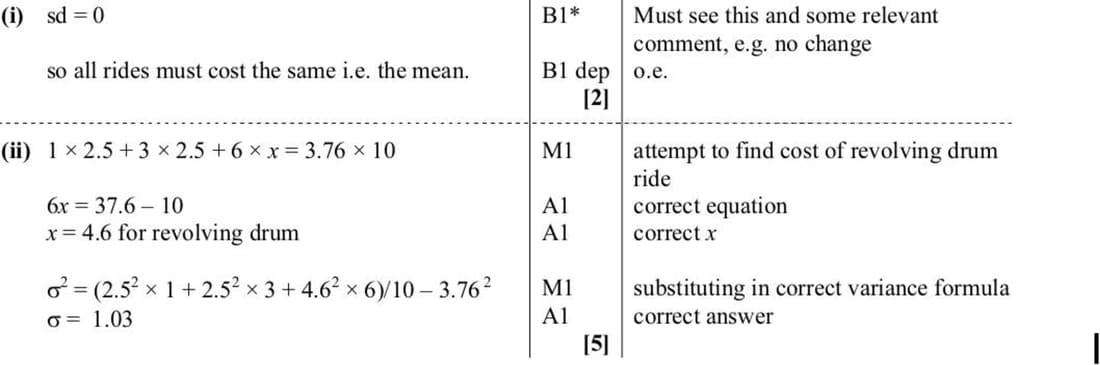
(i) The mean cost of Fei’s rides is $2.50 and the standard deviation of the costs of Fei’s rides is $0. Explain how you can tell that the roller coaster and the water slide each cost $2.50 per ride. [2]
(ii) The mean cost of Graeme’s rides is $3.76. Find the standard deviation of the costs of Graeme’s rides. [5]
Nov 2008 p6 q1
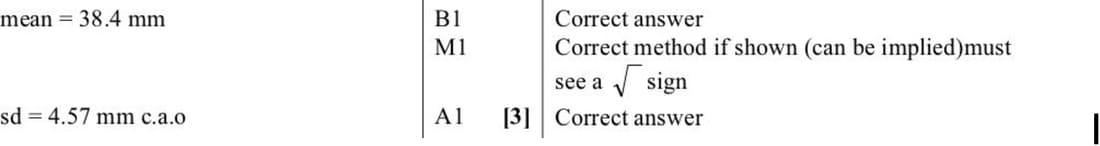
Rachel measured the lengths in millimetres of some of the leaves on a tree. Her results are recorded below.
32, 35, 45, 37, 38, 44, 33, 39, 36, 45
Find the mean and standard deviation of the lengths of these leaves.
June 2006 p6 q6
32 teams enter for a knockout competition, in which each match results in one team winning and the other team losing. After each match the winning team goes on to the next round, and the losing team takes no further part in the competition. Thus 16 teams play in the second round, 8 teams play in the third round, and so on, until 2 teams play in the final round.
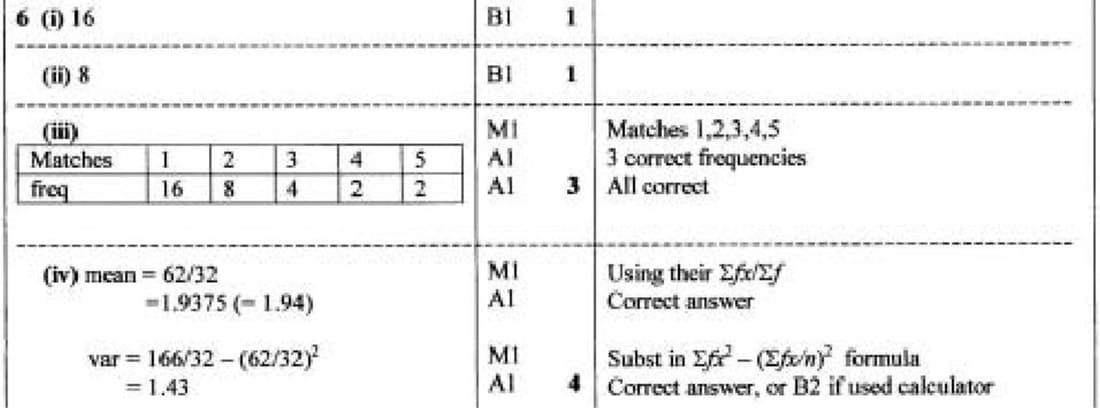
- How many teams play in only 1 match?
- How many teams play in exactly 2 matches?
- Draw up a frequency table for the numbers of matches which the teams play.
- Calculate the mean and variance of the numbers of matches which the teams play.
June 2006 p6 q1
The salaries, in thousands of dollars, of 11 people, chosen at random in a certain office, were found to be:
40, 42, 45, 41, 352, 40, 50, 48, 51, 49, 47.
Choose and calculate an appropriate measure of central tendency (mean, mode or median) to summarise these salaries. Explain briefly why the other measures are not suitable.

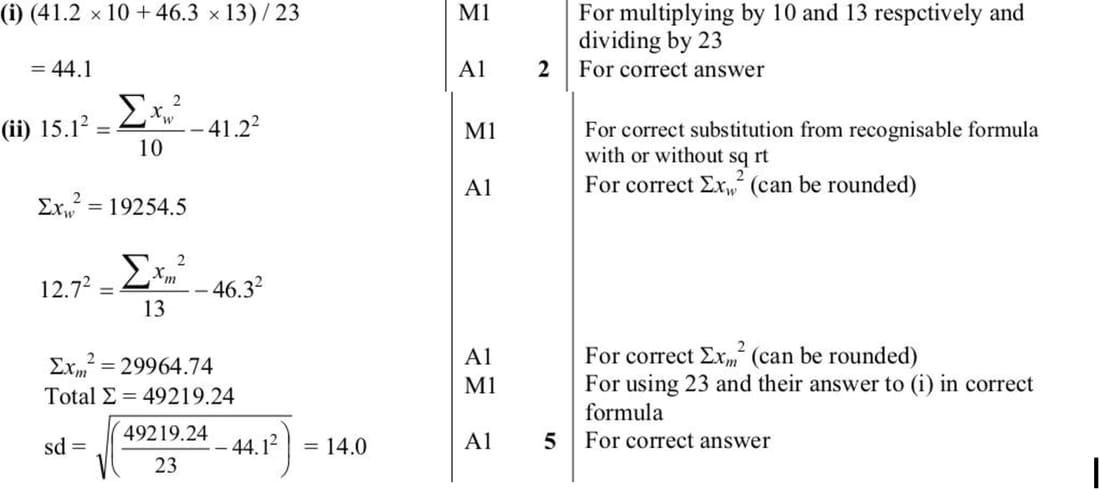
Nov 2005 p6 q4
A group of 10 married couples and 3 single men found that the mean age \(\bar{x}_w\) of the 10 women was 41.2 years and the standard deviation of the women’s ages was 15.1 years. For the 13 men, the mean age \(\bar{x}_m\) was 46.3 years and the standard deviation was 12.7 years.
(i) Find the mean age of the whole group of 23 people.
(ii) The individual women’s ages are denoted by \(x_w\) and the individual men’s ages by \(x_m\). By first finding \(\Sigma x_w^2\) and \(\Sigma x_m^2\), find the standard deviation for the whole group.
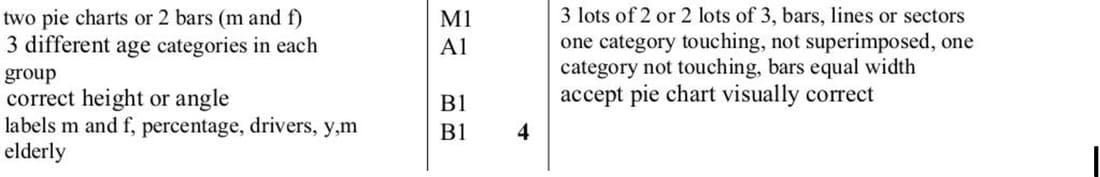
Nov 2005 p6 q1
A study of the ages of car drivers in a certain country produced the results shown in the table.
Percentage of drivers in each age group
| Young | Middle-aged | Elderly | |
|---|---|---|---|
| Males | 40 | 35 | 25 |
| Females | 20 | 70 | 10 |
Illustrate these results diagrammatically.
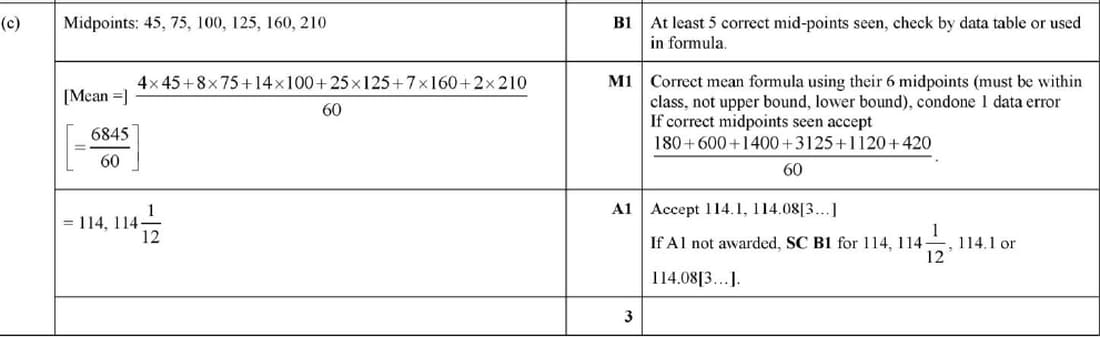
Feb/Mar 2023 p52 q1
Each year the total number of hours, \(x\), of sunshine in Kintoo is recorded during the month of June. The results for the last 60 years are summarised in the table.
| \(x\) | 30 \(\leq x <\) 60 | 60 \(\leq x <\) 90 | 90 \(\leq x <\) 110 | 110 \(\leq x <\) 140 | 140 \(\leq x <\) 180 | 180 \(\leq x <\) 240 |
|---|---|---|---|---|---|---|
| Number of years | 4 | 8 | 14 | 25 | 7 | 2 |
Calculate an estimate for the mean number of hours of sunshine in Kintoo during June over the last 60 years.
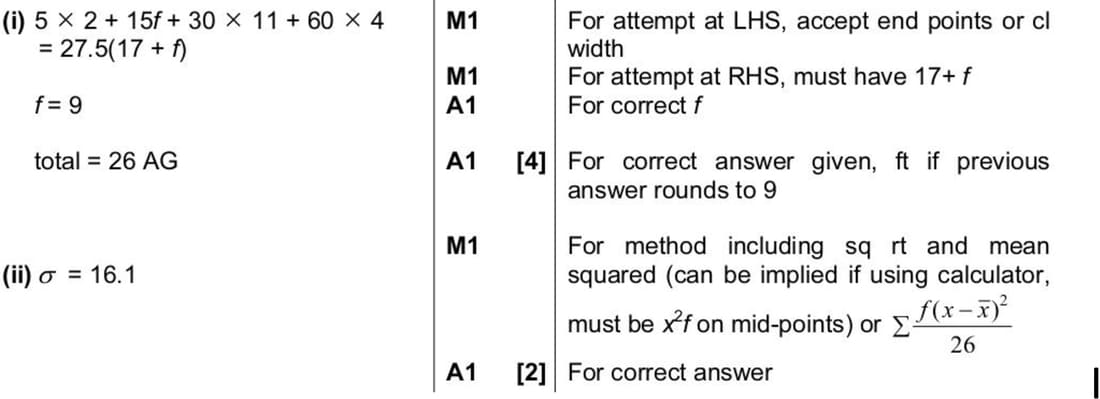
June 2005 p6 q2
The following table shows the results of a survey to find the average daily time, in minutes, that a group of schoolchildren spent in internet chat rooms.
| Time per day (t minutes) | Frequency |
|---|---|
| \(0 \leq t < 10\) | 2 |
| \(10 \leq t < 20\) | f |
| \(20 \leq t < 40\) | 11 |
| \(40 \leq t < 80\) | 4 |
The mean time was calculated to be 27.5 minutes.
- Form an equation involving \(f\) and hence show that the total number of children in the survey was 26. [4]
- Find the standard deviation of these times. [2]
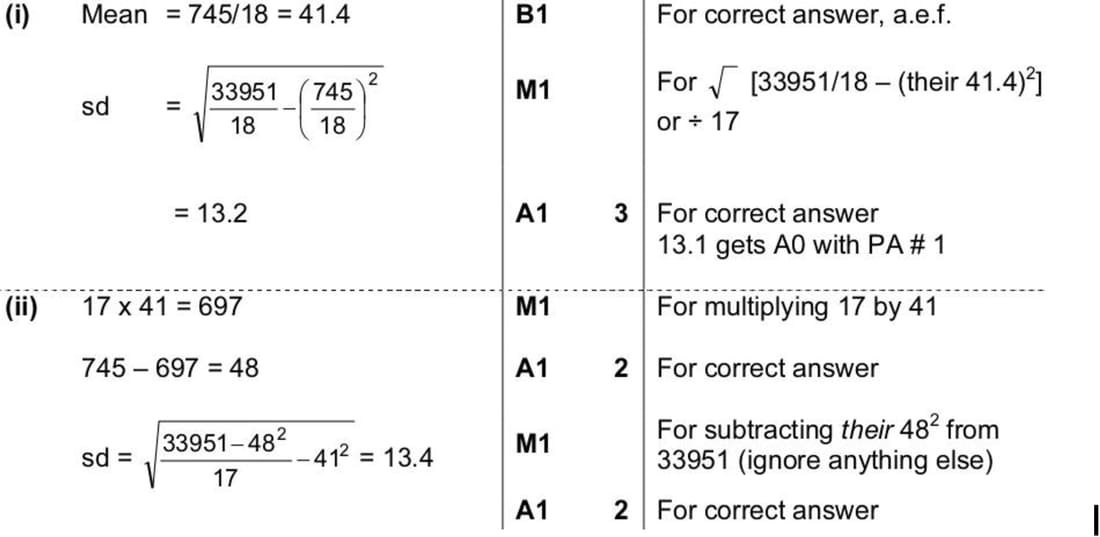
Nov 2004 p6 q4
The ages, \(x\) years, of 18 people attending an evening class are summarised by the following totals: \(\Sigma x = 745, \Sigma x^2 = 33951\).
(i) Calculate the mean and standard deviation of the ages of this group of people. [3]
(ii) One person leaves the group and the mean age of the remaining 17 people is exactly 41 years. Find the age of the person who left and the standard deviation of the ages of the remaining 17 people. [4]
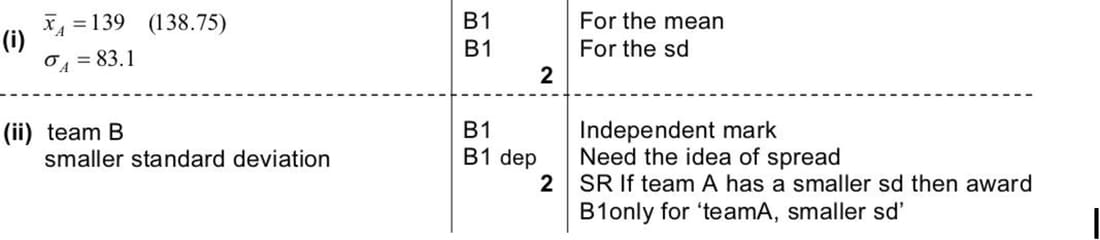
June 2004 p6 q1
Two cricket teams kept records of the number of runs scored by their teams in 8 matches. The scores are shown in the following table.
| Team A | 150 | 220 | 77 | 30 | 298 | 118 | 160 | 57 |
|---|---|---|---|---|---|---|---|---|
| Team B | 166 | 142 | 170 | 93 | 111 | 130 | 148 | 86 |
- Find the mean and standard deviation of the scores for team A. [2]
- State with a reason which team has the more consistent scores. [2]
The mean and standard deviation for team B are 130.75 and 29.63 respectively.
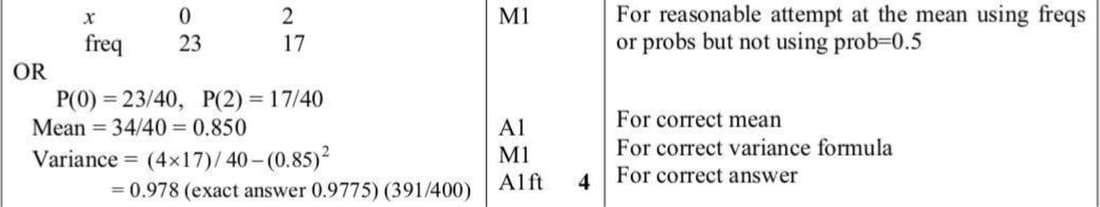
Nov 2003 p6 q1
A computer can generate random numbers which are either 0 or 2. On a particular occasion, it generates a set of numbers which consists of 23 zeros and 17 twos. Find the mean and variance of this set of 40 numbers.
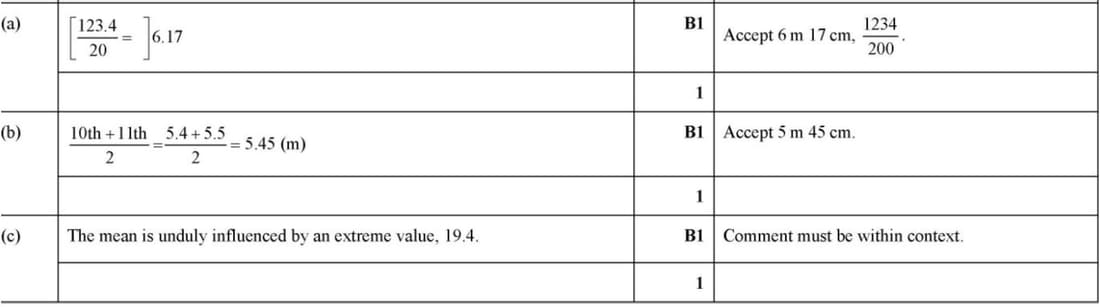
June 2022 p53 q2
Twenty children were asked to estimate the height of a particular tree. Their estimates, in metres, were as follows.
4.1, 4.2, 4.4, 4.5, 4.6, 4.8, 5.0, 5.2, 5.3, 5.4, 5.5, 5.8, 6.0, 6.2, 6.3, 6.4, 6.6, 6.8, 6.9, 19.4
(a) Find the mean of the estimated heights.
(b) Find the median of the estimated heights.
(c) Give a reason why the median is likely to be more suitable than the mean as a measure of the central tendency for this information.
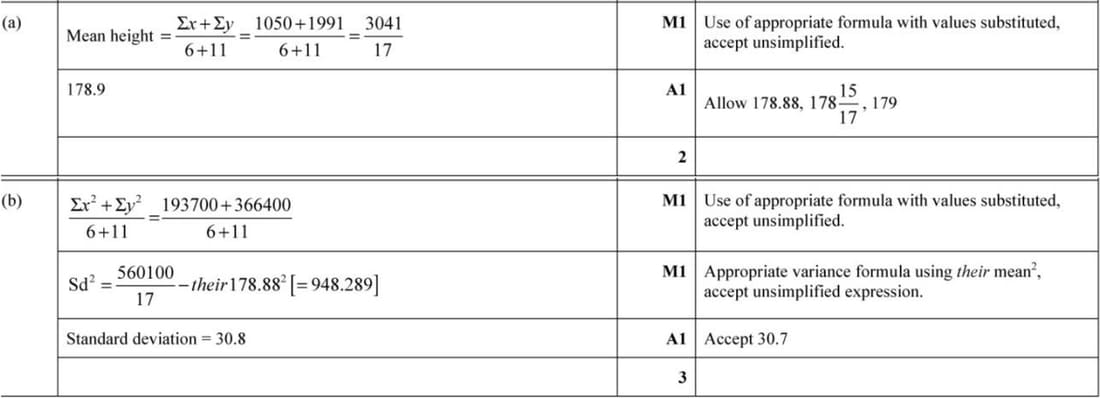
June 2021 p53 q3
A sports club has a volleyball team and a hockey team. The heights of the 6 members of the volleyball team are summarised by \(\Sigma x = 1050\) and \(\Sigma x^2 = 193700\), where \(x\) is the height of a member in cm. The heights of the 11 members of the hockey team are summarised by \(\Sigma y = 1991\) and \(\Sigma y^2 = 366400\), where \(y\) is the height of a member in cm.
(a) Find the mean height of all 17 members of the club.
(b) Find the standard deviation of the heights of all 17 members of the club.
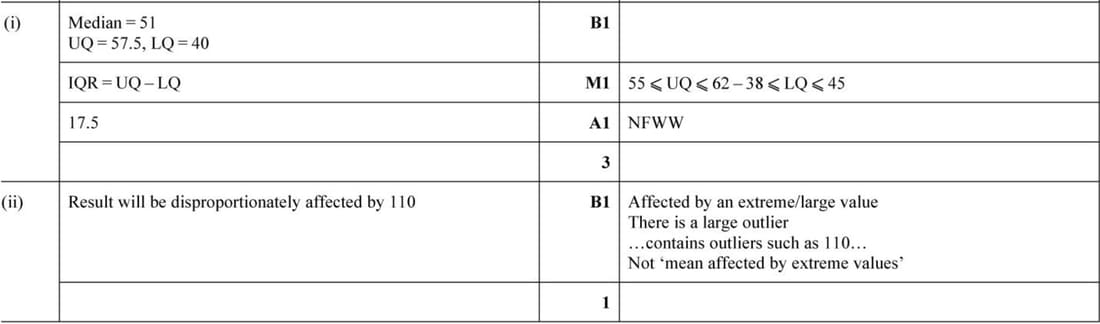
Nov 2019 p62 q1
Twelve tourists were asked to estimate the height, in metres, of a new building. Their estimates were as follows.
50, 45, 62, 30, 40, 55, 110, 38, 52, 60, 55, 40
- Find the median and the interquartile range for the data.
- Give a disadvantage of using the mean as a measure of the central tendency in this case.
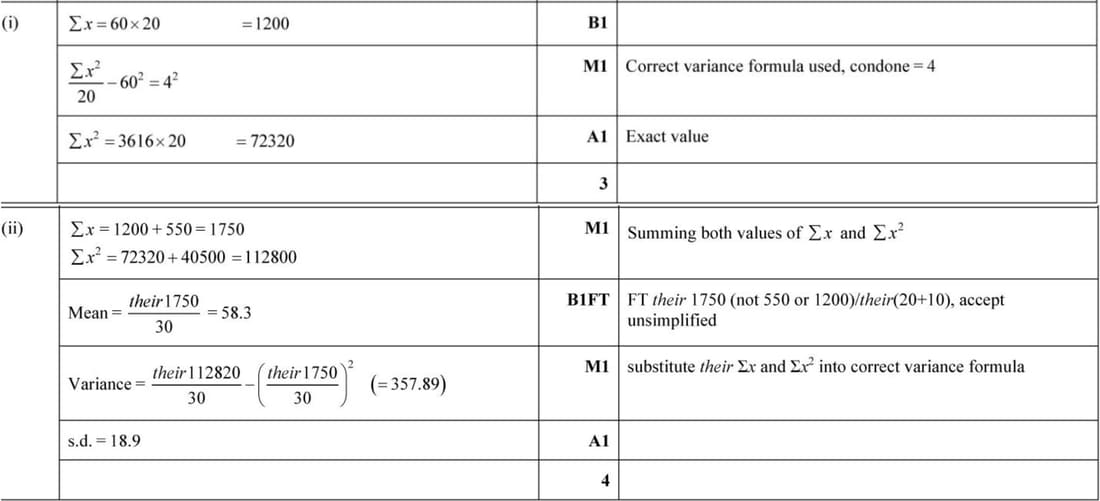
Nov 2019 p61 q3
The mean and standard deviation of 20 values of \(x\) are 60 and 4 respectively.
- Find the values of \(\Sigma x\) and \(\Sigma x^2\).
Another 10 values of \(x\) are such that their sum is 550 and the sum of their squares is 40 500.
- Find the mean and standard deviation of all these 30 values of \(x\).
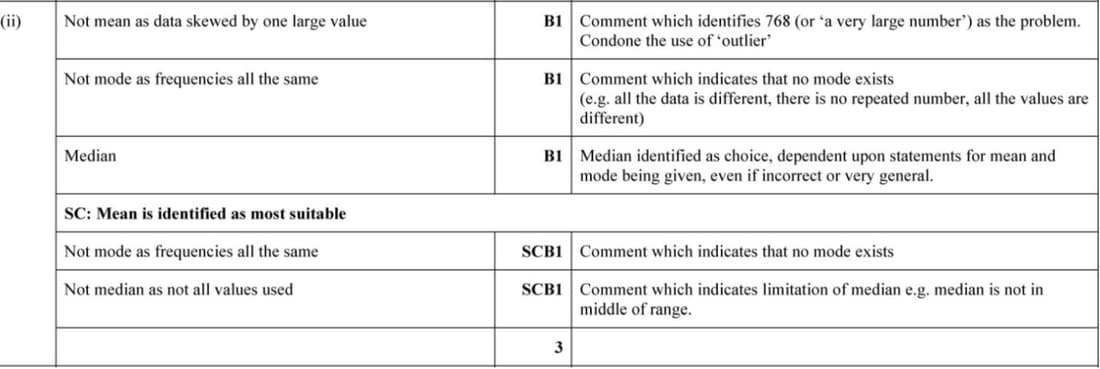
June 2019 p62 q6
The times in minutes taken to run a marathon were recorded for a group of 13 marathon runners and were found to be as follows.
180, 275, 235, 242, 311, 194, 246, 229, 238, 768, 332, 227, 228
State which of the mean, mode or median is most suitable as a measure of central tendency for these times. Explain why the other measures are less suitable.
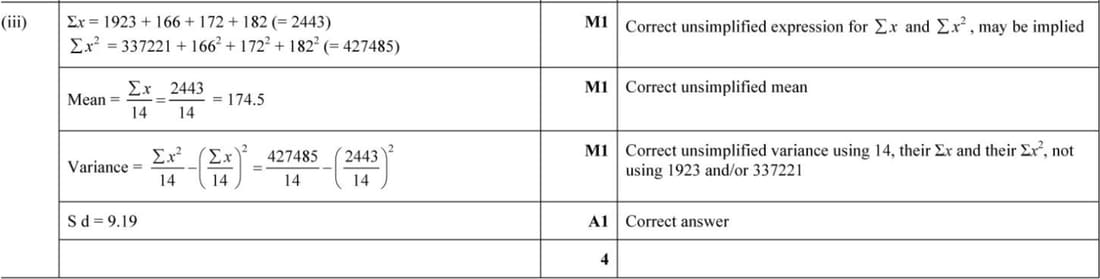
Nov 2018 p63 q7
The heights of the 11 members of the Anvils are denoted by \(x\) cm. It is given that \(\Sigma x = 1923\) and \(\Sigma x^2 = 337221\). The Anvils are joined by 3 new members whose heights are 166 cm, 172 cm and 182 cm. Find the standard deviation of the heights of all 14 members of the Anvils.