Exam-Style Problems
⬅ Back to SubchapterNov 2013 p63 q5
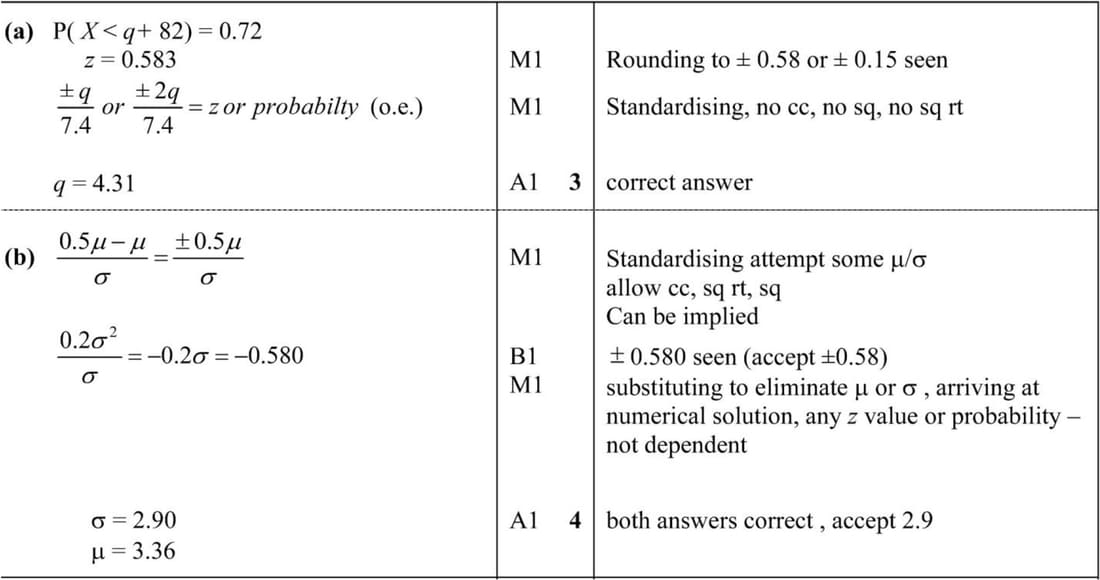
(a) The random variable X is normally distributed with mean 82 and standard deviation 7.4. Find the value of q such that \(P(82-q < X < 82+q) = 0.44\).
(b) The random variable Y is normally distributed with mean \(\mu\) and standard deviation \(\sigma\). It is given that \(5\mu = 2\sigma^2\) and that \(P(Y < \frac{1}{2}\mu) = 0.281\). Find the values of \(\mu\) and \(\sigma\).
Nov 2013 p62 q3
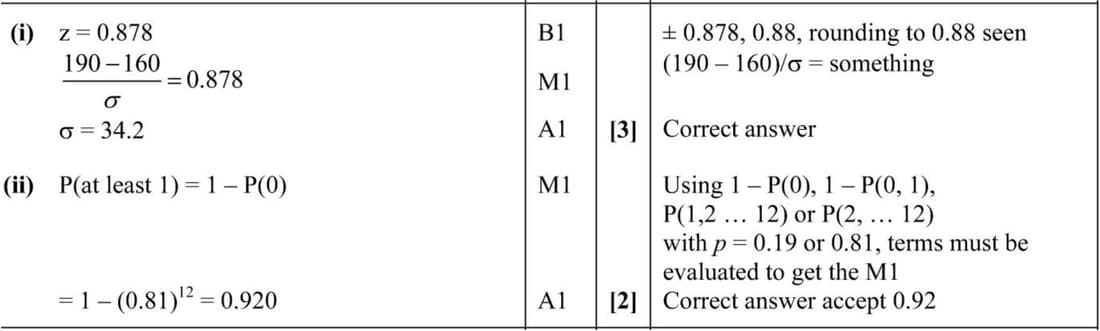
The amount of fibre in a packet of a certain brand of cereal is normally distributed with mean 160 grams. 19% of packets of cereal contain more than 190 grams of fibre.
- Find the standard deviation of the amount of fibre in a packet.
- Kate buys 12 packets of cereal. Find the probability that at least 1 of the packets contains more than 190 grams of fibre.
Nov 2013 p61 q5
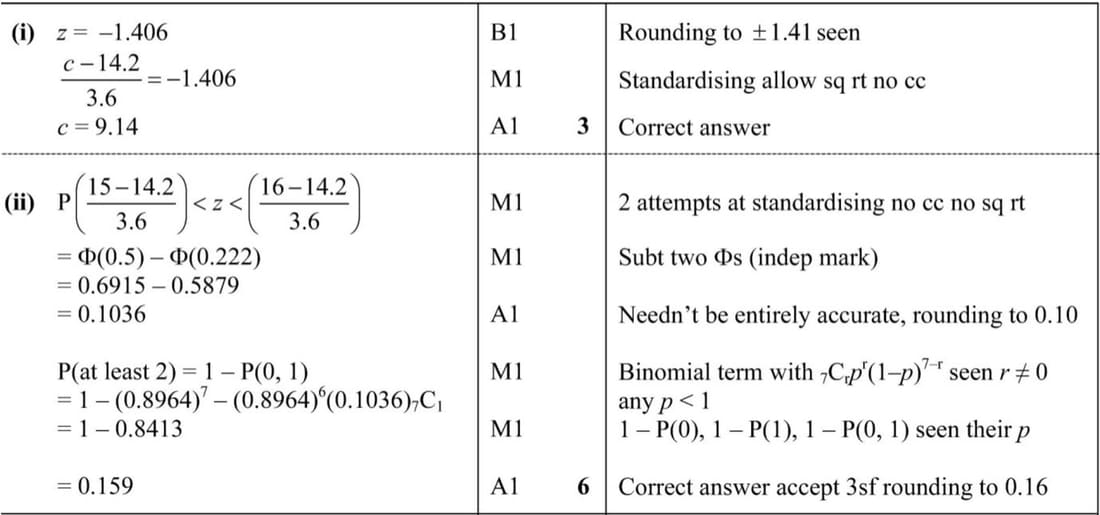
Lengths of a certain type of carrot have a normal distribution with mean 14.2 cm and standard deviation 3.6 cm.
- 8% of carrots are shorter than c cm. Find the value of c.
- Rebekah picks 7 carrots at random. Find the probability that at least 2 of them have lengths between 15 and 16 cm.
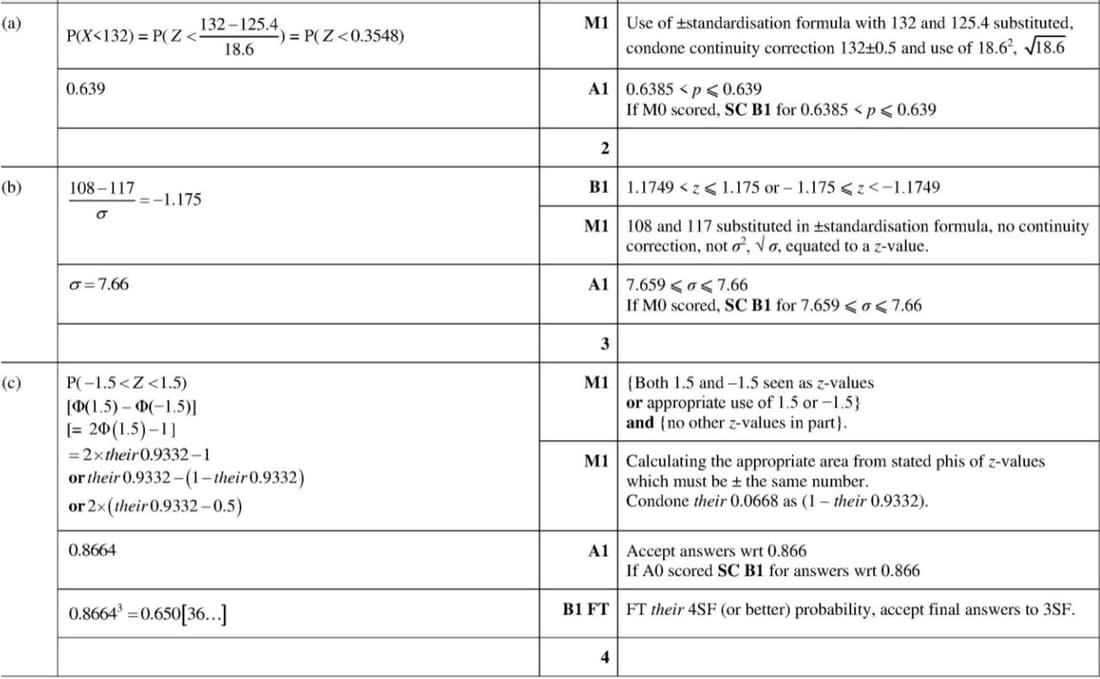
Nov 2022 p51 q4
In a large population, the systolic blood pressure (SBP) of adults is normally distributed with mean 125.4 and standard deviation 18.6.
(a) Find the probability that the SBP of a randomly chosen adult is less than 132.
The SBP of 12-year-old children in the same population is normally distributed with mean 117. Of these children 88% have SBP more than 108.
(b) Find the standard deviation of this distribution.
Three adults are chosen at random from this population.
(c) Find the probability that each of these three adults has SBP within 1.5 standard deviations of the mean.
June 2013 p63 q3
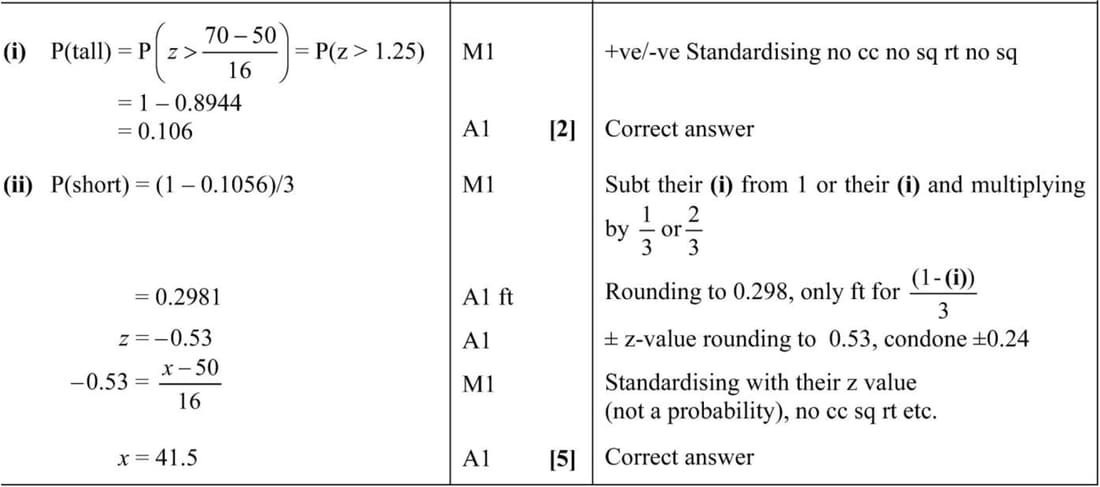
Buildings in a certain city centre are classified by height as tall, medium or short. The heights can be modelled by a normal distribution with mean 50 metres and standard deviation 16 metres. Buildings with a height of more than 70 metres are classified as tall.
- Find the probability that a building chosen at random is classified as tall.
- The rest of the buildings are classified as medium and short in such a way that there are twice as many medium buildings as there are short ones. Find the height below which buildings are classified as short.