Exam-Style Problems
⬅ Back to SubchapterJune 2012 p12 q10
Given the function \(f : x \mapsto 2x + 5\) for \(x \in \mathbb{R}\), sketch the graphs of \(y = f(x)\) and \(y = f^{-1}(x)\) on the same diagram, making clear the relationship between the two graphs.
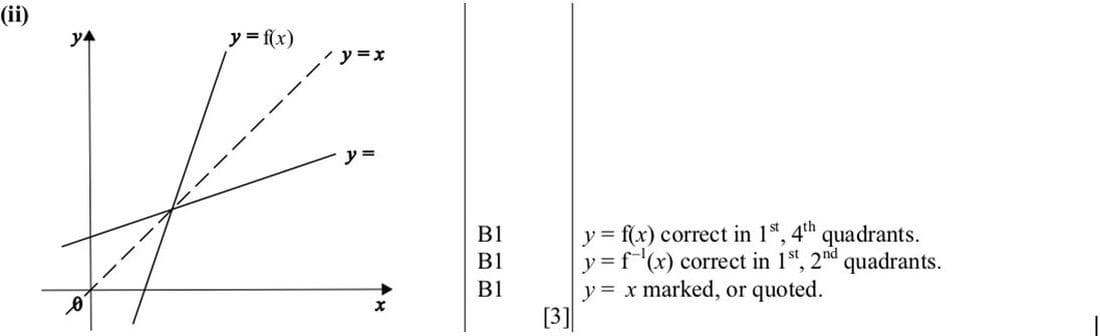
Nov 2011 p13 q9
Given the function \(f : x \mapsto 2x + 3\) for \(x \leq 0\), on the same diagram sketch the graphs of \(y = f(x)\) and \(y = f^{-1}(x)\), showing the coordinates of their point of intersection and the relationship between the graphs.

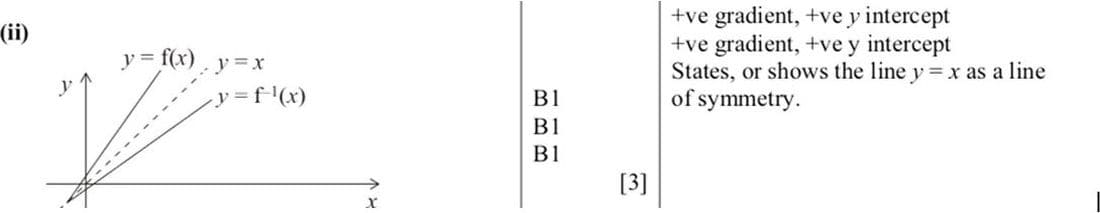
June 2011 p13 q10
Let \(f : x \mapsto 3x - 4, \; x \in \mathbb{R}\).
Sketch in a single diagram the graphs of \(y = f(x)\) and \(y = f^{-1}(x)\), making clear the relationship between the graphs.
Nov 2009 p11 q10
Let \(f : x \mapsto 2x + 1\), \(x \in \mathbb{R}\), \(x > 0\).
Sketch in a single diagram the graphs of \(y = f(x)\) and \(y = f^{-1}(x)\), making clear the relationship between the graphs.

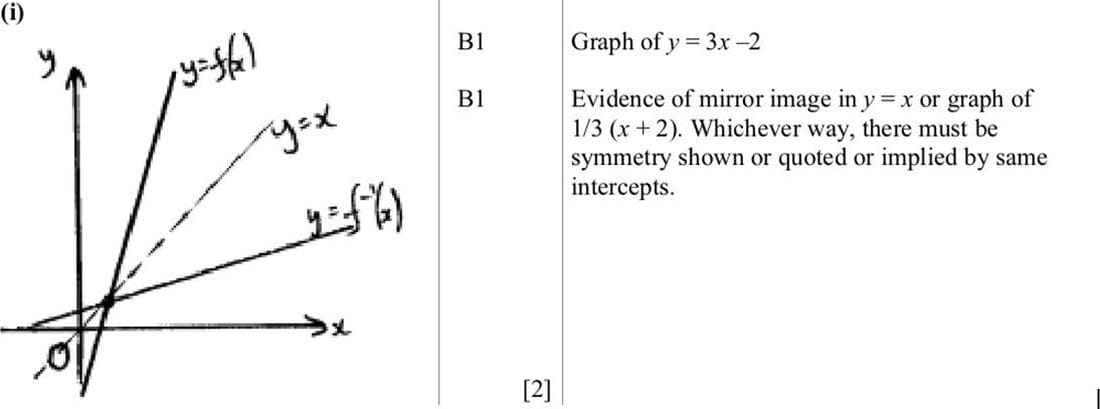
Nov 2008 p1 q10
The function \(f\) is defined by \(f : x \mapsto 3x - 2\) for \(x \in \mathbb{R}\).
Sketch, in a single diagram, the graphs of \(y = f(x)\) and \(y = f^{-1}(x)\), making clear the relationship between the two graphs.