Exam-Style Problems
⬅ Back to SubchapterNov 2018 p61 q6
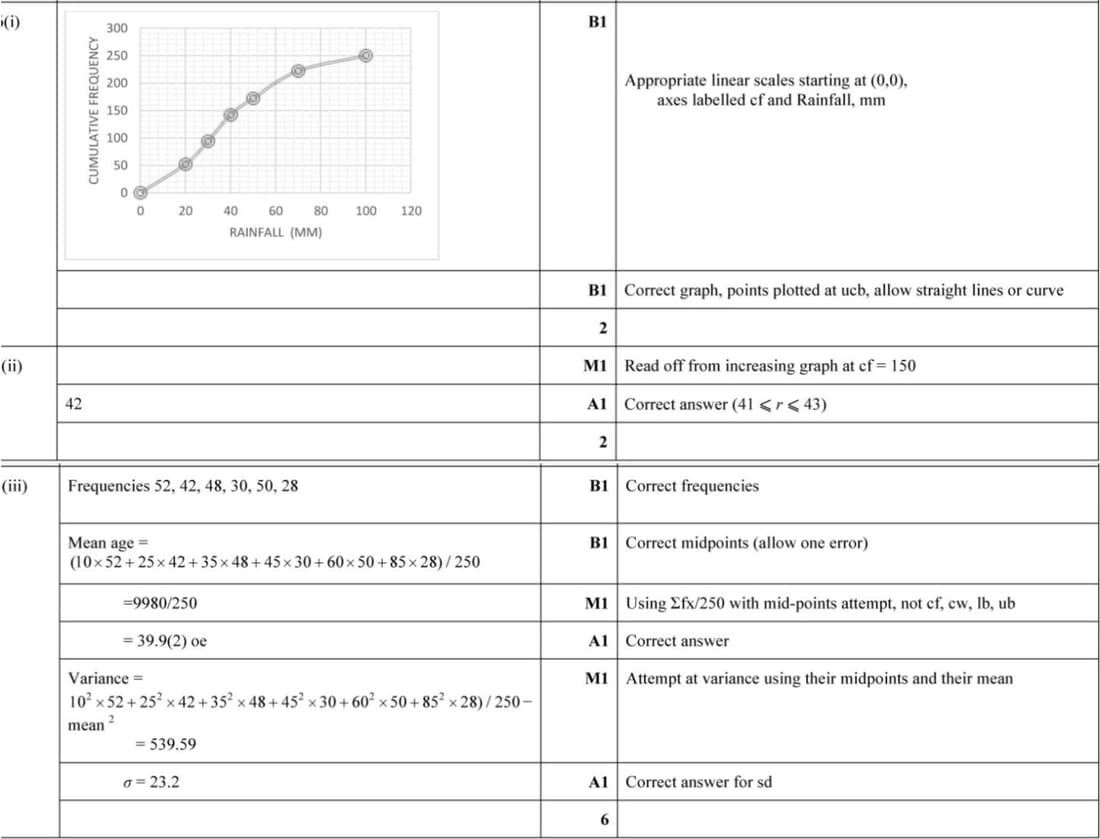
The daily rainfall, \(x\) mm, in a certain village is recorded on 250 consecutive days. The results are summarised in the following cumulative frequency table.
| Rainfall, \(x\) mm | \(x \leq 20\) | \(x \leq 30\) | \(x \leq 40\) | \(x \leq 50\) | \(x \leq 70\) | \(x \leq 100\) |
|---|---|---|---|---|---|---|
| Cumulative frequency | 52 | 94 | 142 | 172 | 222 | 250 |
- On the grid, draw a cumulative frequency graph to illustrate the data. [2]
- On 100 of the days, the rainfall was \(k\) mm or more. Use your graph to estimate the value of \(k\). [2]
- Calculate estimates of the mean and standard deviation of the daily rainfall in this village. [6]
Feb/Mar 2018 p62 q1
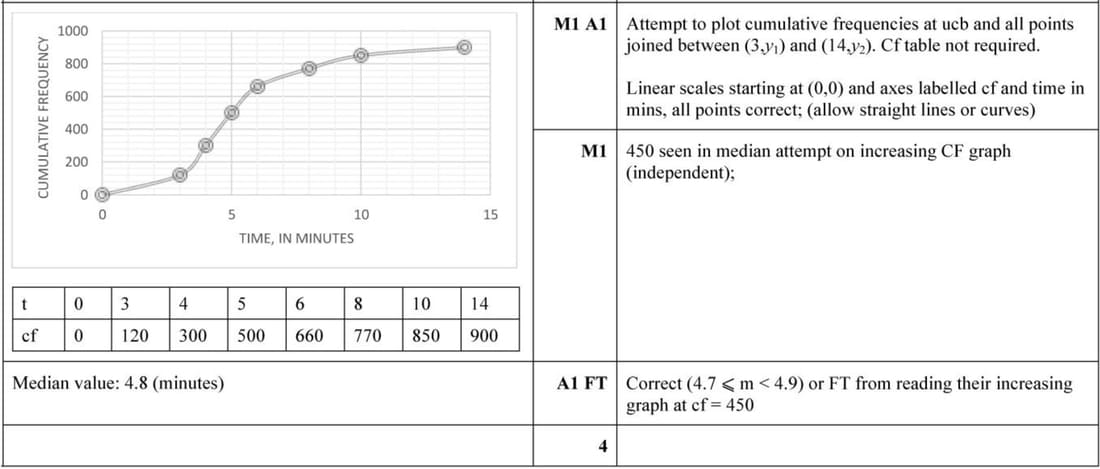
There are 900 students in a certain year-group. An identical puzzle is given to each student and the time taken, \(t\) minutes, to complete the puzzle is recorded. These times are summarised in the following frequency table.
| Time taken, \(t\) minutes | \(t \leq 3\) | \(3 < t \leq 4\) | \(4 < t \leq 5\) | \(5 < t \leq 6\) | \(6 < t \leq 8\) | \(8 < t \leq 10\) | \(10 < t \leq 14\) |
|---|---|---|---|---|---|---|---|
| Frequency | 120 | 180 | 200 | 160 | 110 | 80 | 50 |
On the grid, draw a cumulative frequency graph to represent the data. Use your graph to estimate the median time taken by these students to complete the puzzle.
Nov 2017 p62 q2
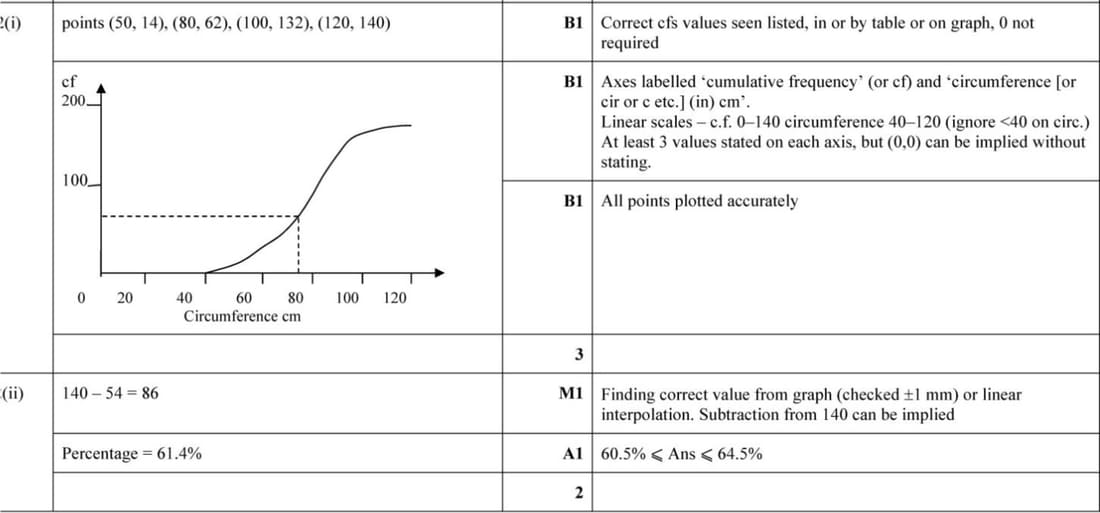
The circumferences, \(c\) cm, of some trees in a wood were measured. The results are summarised in the table.
| Circumference (c cm) | \(40 < c \leq 50\) | \(50 < c \leq 80\) | \(80 < c \leq 100\) | \(100 < c \leq 120\) |
|---|---|---|---|---|
| Frequency | 14 | 48 | 70 | 8 |
(i) On the grid, draw a cumulative frequency graph to represent the information.
(ii) Estimate the percentage of trees which have a circumference larger than 75 cm.
Nov 2017 p61 q2
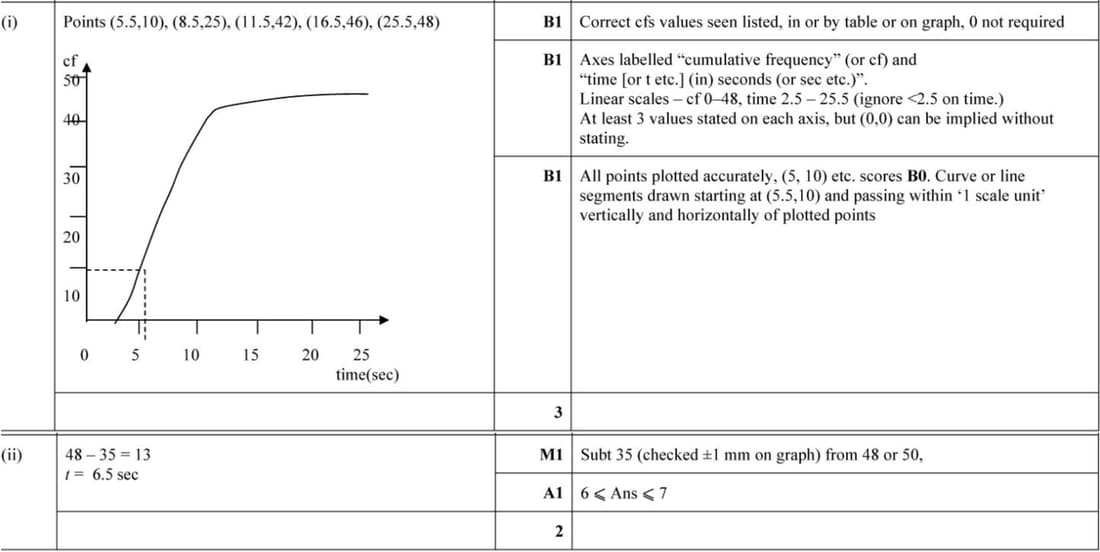
The time taken by a car to accelerate from 0 to 30 metres per second was measured correct to the nearest second. The results from 48 cars are summarised in the following table.
| Time (seconds) | 3 – 5 | 6 – 8 | 9 – 11 | 12 – 16 | 17 – 25 |
|---|---|---|---|---|---|
| Frequency | 10 | 15 | 17 | 4 | 2 |
(i) On the grid, draw a cumulative frequency graph to represent this information. [3]
(ii) 35 of these cars accelerated from 0 to 30 metres per second in a time more than \(t\) seconds. Estimate the value of \(t\). [2]
June 2017 p63 q7
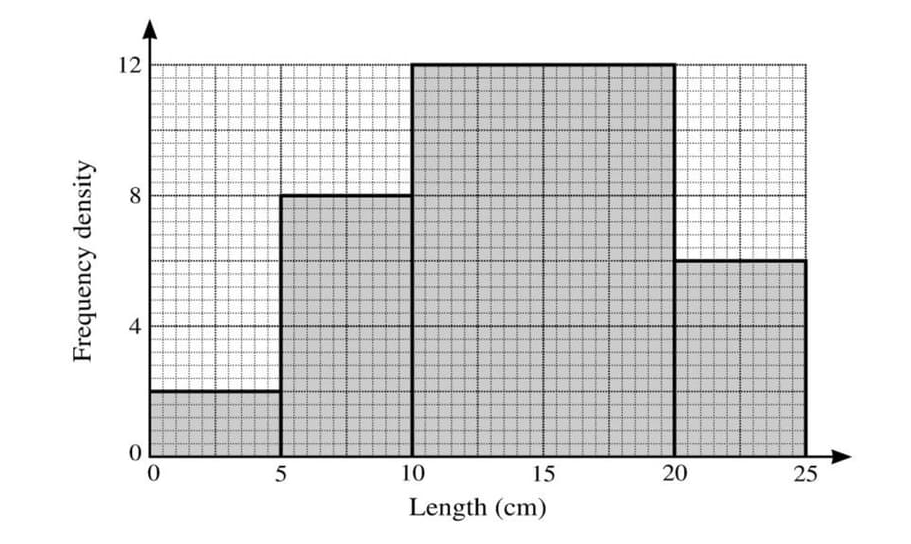
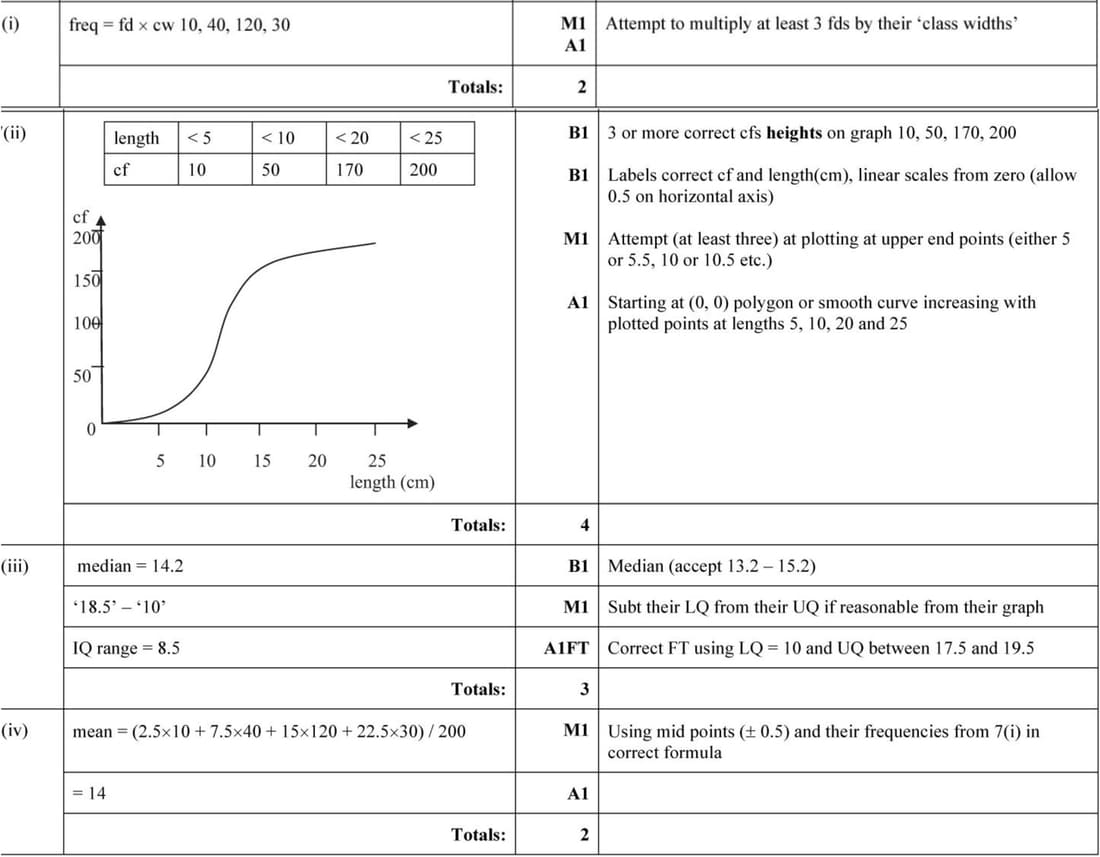
The following histogram represents the lengths of worms in a garden.
(i) Calculate the frequencies represented by each of the four histogram columns.
(ii) On the grid on the next page, draw a cumulative frequency graph to represent the lengths of worms in the garden.
(iii) Use your graph to estimate the median and interquartile range of the lengths of worms in the garden.
(iv) Calculate an estimate of the mean length of worms in the garden.