Exam-Style Problems
⬅ Back to SubchapterNov 2023 p32 q9
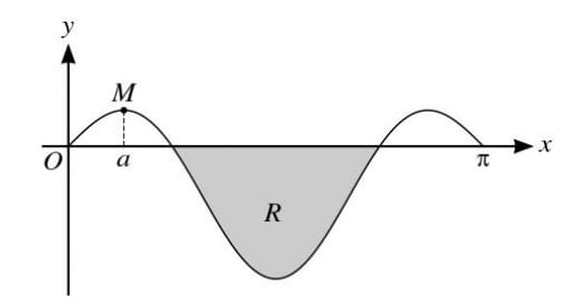
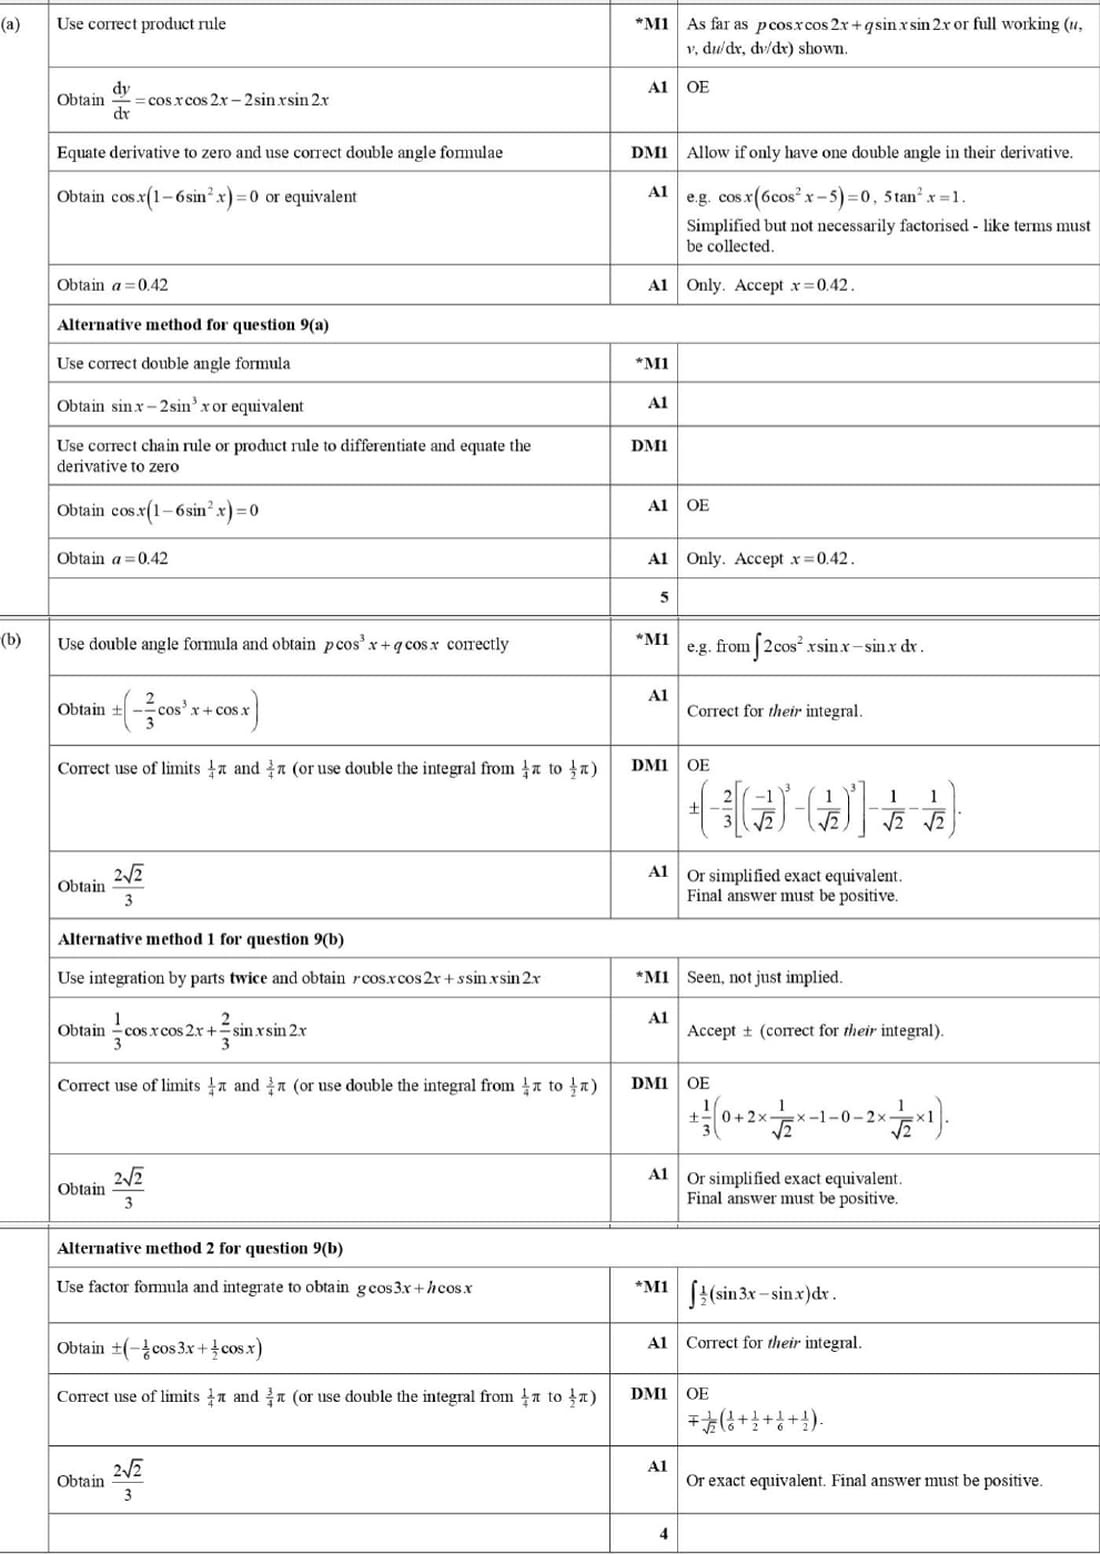
The diagram shows the curve \(y = \\sin x \\cos 2x\), for \(0 \leq x \leq \\pi\), and a maximum point \(M\), where \(x = a\). The shaded region between the curve and the \(x\)-axis is denoted by \(R\).
(a) Find the value of \(a\) correct to 2 decimal places.
(b) Find the exact area of the region \(R\), giving your answer in simplified form.
Feb/Mar 2023 p32 q8
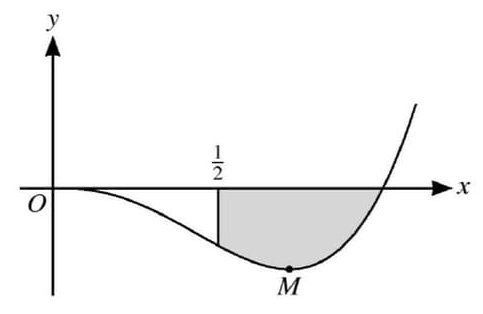
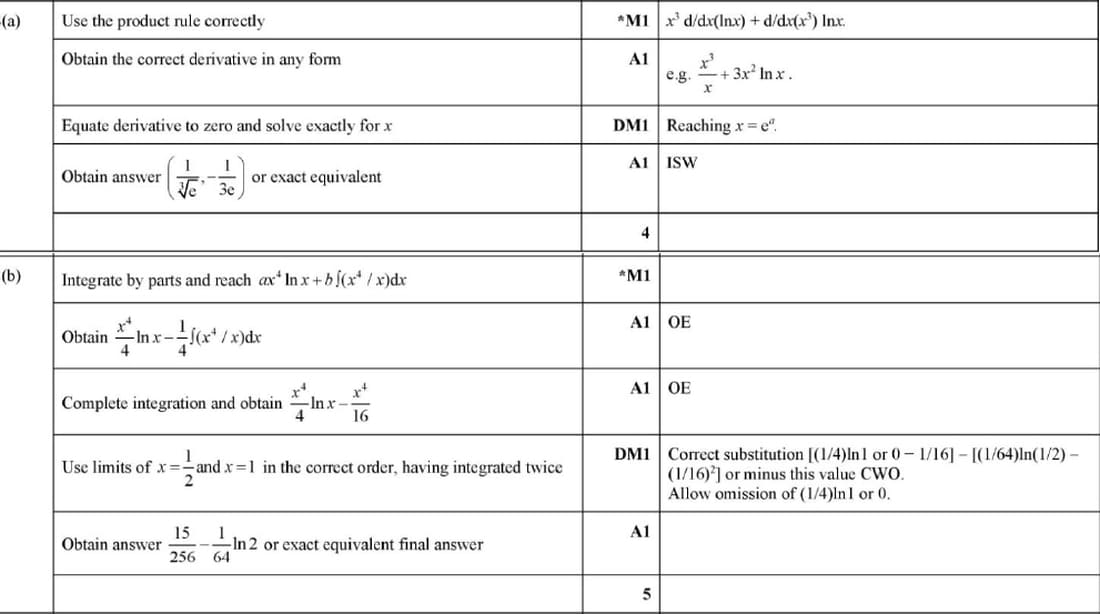
The diagram shows the curve \(y = x^3 \ln x\), for \(x > 0\), and its minimum point \(M\).
(a) Find the exact coordinates of \(M\).
(b) Find the exact area of the shaded region bounded by the curve, the \(x\)-axis and the line \(x = \frac{1}{2}\).
Nov 2022 p31 q9
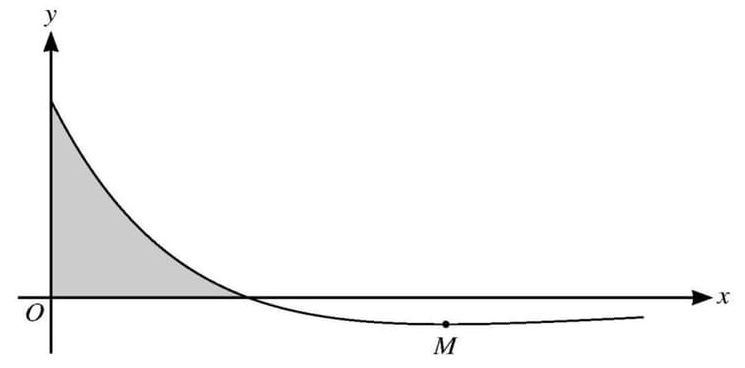
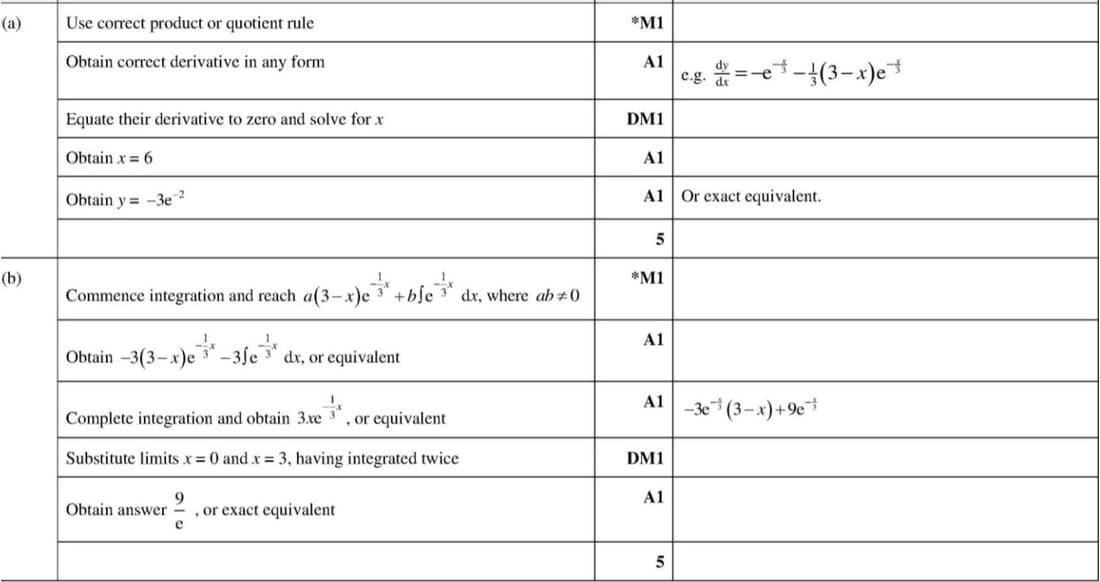
The diagram shows part of the curve \(y = (3-x)e^{-\frac{1}{3}x}\) for \(x \geq 0\), and its minimum point \(M\).
(a) Find the exact coordinates of \(M\).
(b) Find the area of the shaded region bounded by the curve and the axes, giving your answer in terms of \(e\).
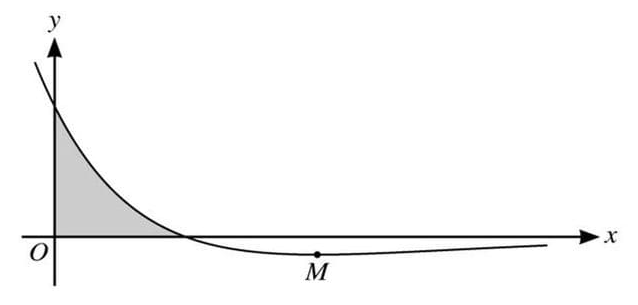
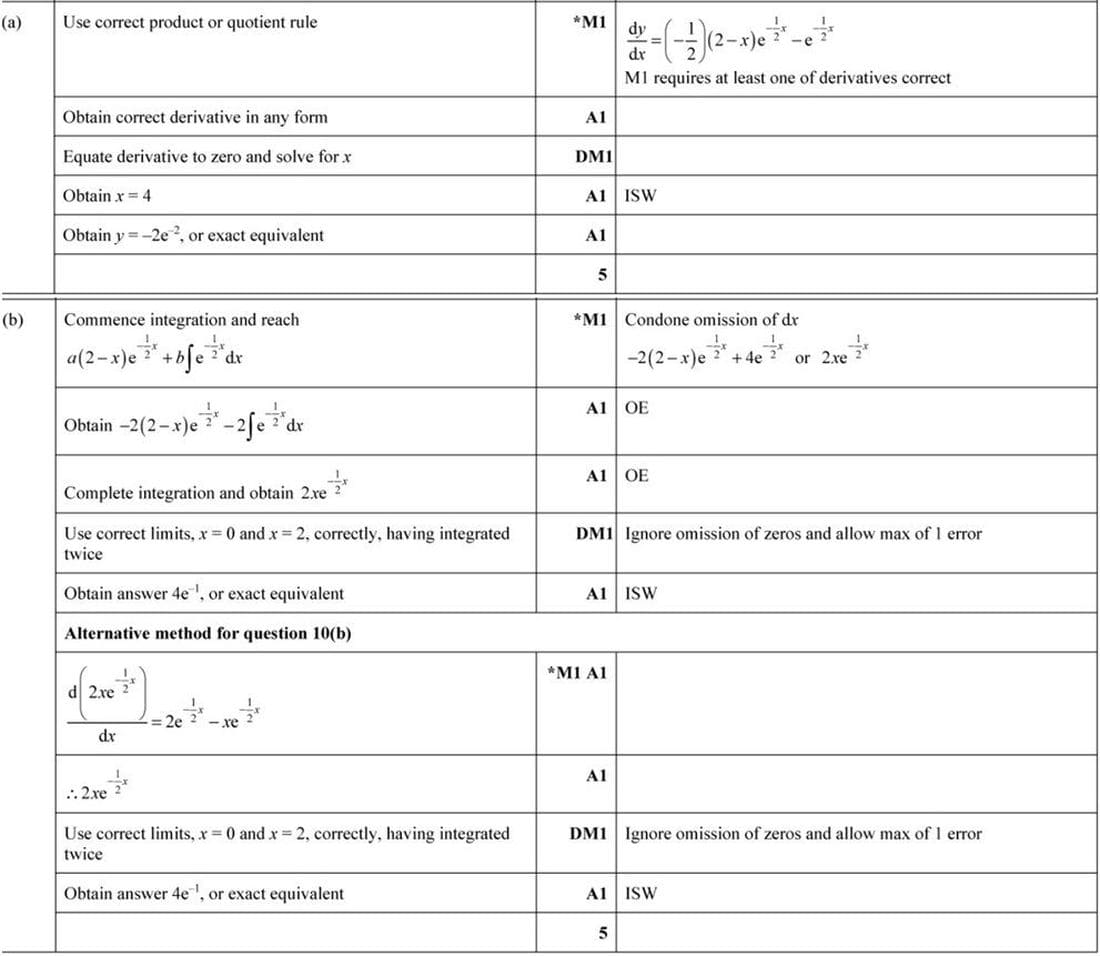
Nov 2020 p31 q10
The diagram shows the curve \(y = (2-x)e^{-\frac{1}{2}x}\), and its minimum point \(M\).
(a) Find the exact coordinates of \(M\).
(b) Find the area of the shaded region bounded by the curve and the axes. Give your answer in terms of \(e\).
June 2018 p32 q8
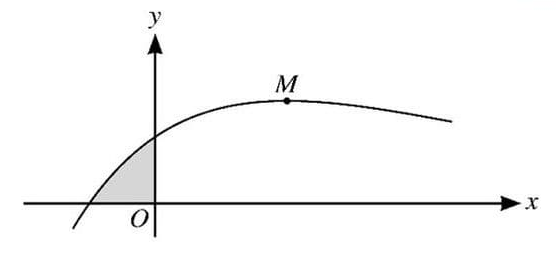
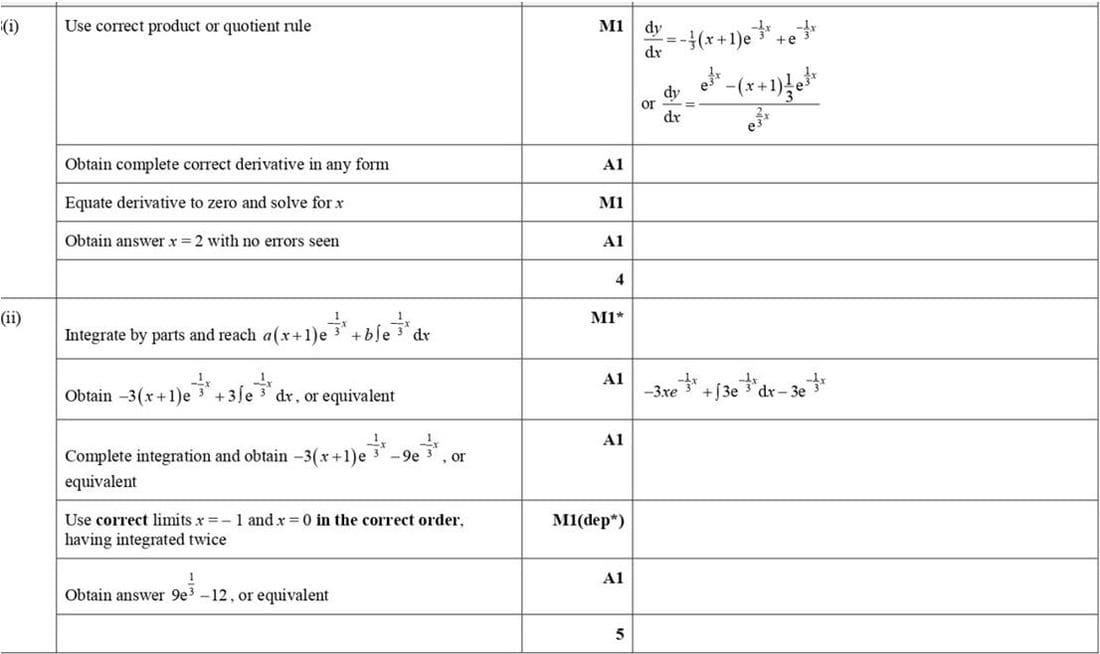
The diagram shows the curve \(y = (x + 1) e^{-\frac{1}{3}x}\) and its maximum point \(M\).
(i) Find the \(x\)-coordinate of \(M\).
(ii) Find the area of the shaded region enclosed by the curve and the axes, giving your answer in terms of \(e\).