Exam-Style Problems
⬅ Back to SubchapterNov 2021 p53 q3
2418
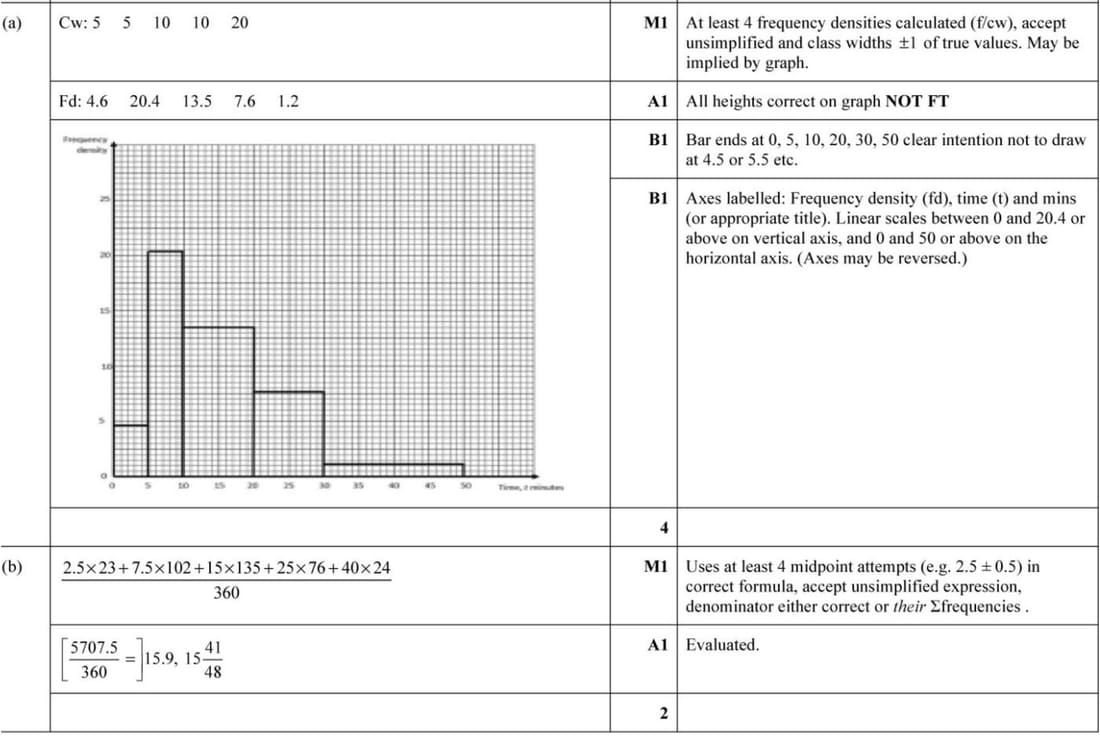
The times taken, in minutes, by 360 employees at a large company to travel from home to work are summarised in the following table.
| Time \( t \) (minutes) | \( 0 \le t < 5 \) | \( 5 \le t < 10 \) | \( 10 \le t < 20 \) | \( 20 \le t < 30 \) | \( 30 \le t < 50 \) |
|---|---|---|---|---|---|
| Frequency | 23 | 102 | 135 | 76 | 24 |
(a) Draw a histogram to represent this information.
(b) Calculate an estimate of the mean time taken by an employee to travel to work.
June 2021 p51 q5
2419
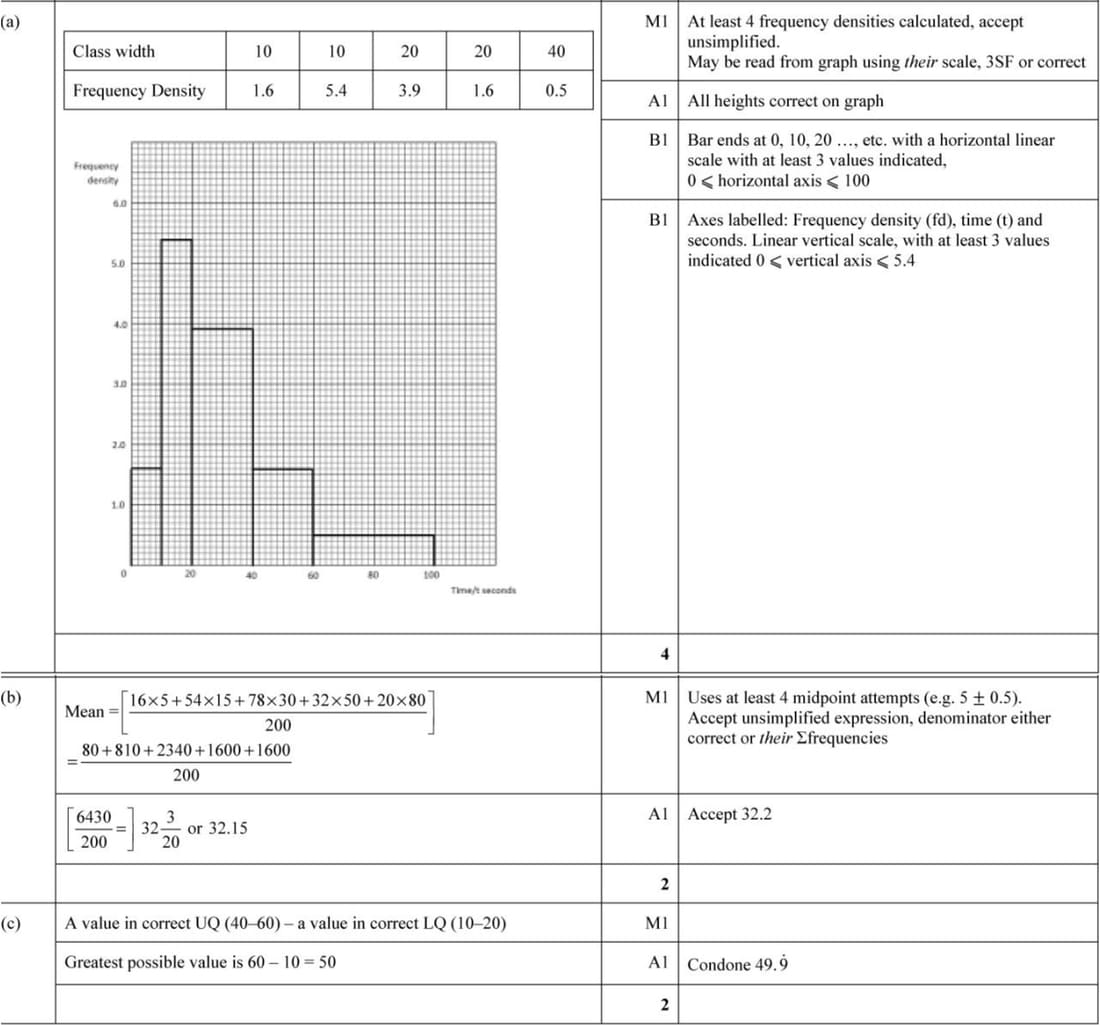
The times taken by 200 players to solve a computer puzzle are summarised in the following table.
| Time \( t \) (seconds) | \( 0 \le t < 10 \) | \( 10 \le t < 20 \) | \( 20 \le t < 40 \) | \( 40 \le t < 60 \) | \( 60 \le t < 100 \) |
|---|---|---|---|---|---|
| Number of players | 16 | 54 | 78 | 32 | 20 |
- Draw a histogram to represent this information.
- Calculate an estimate of the mean time taken by these 200 players.
- Find the greatest possible value of the interquartile range of these times.
Nov 2020 p53 q7
2420
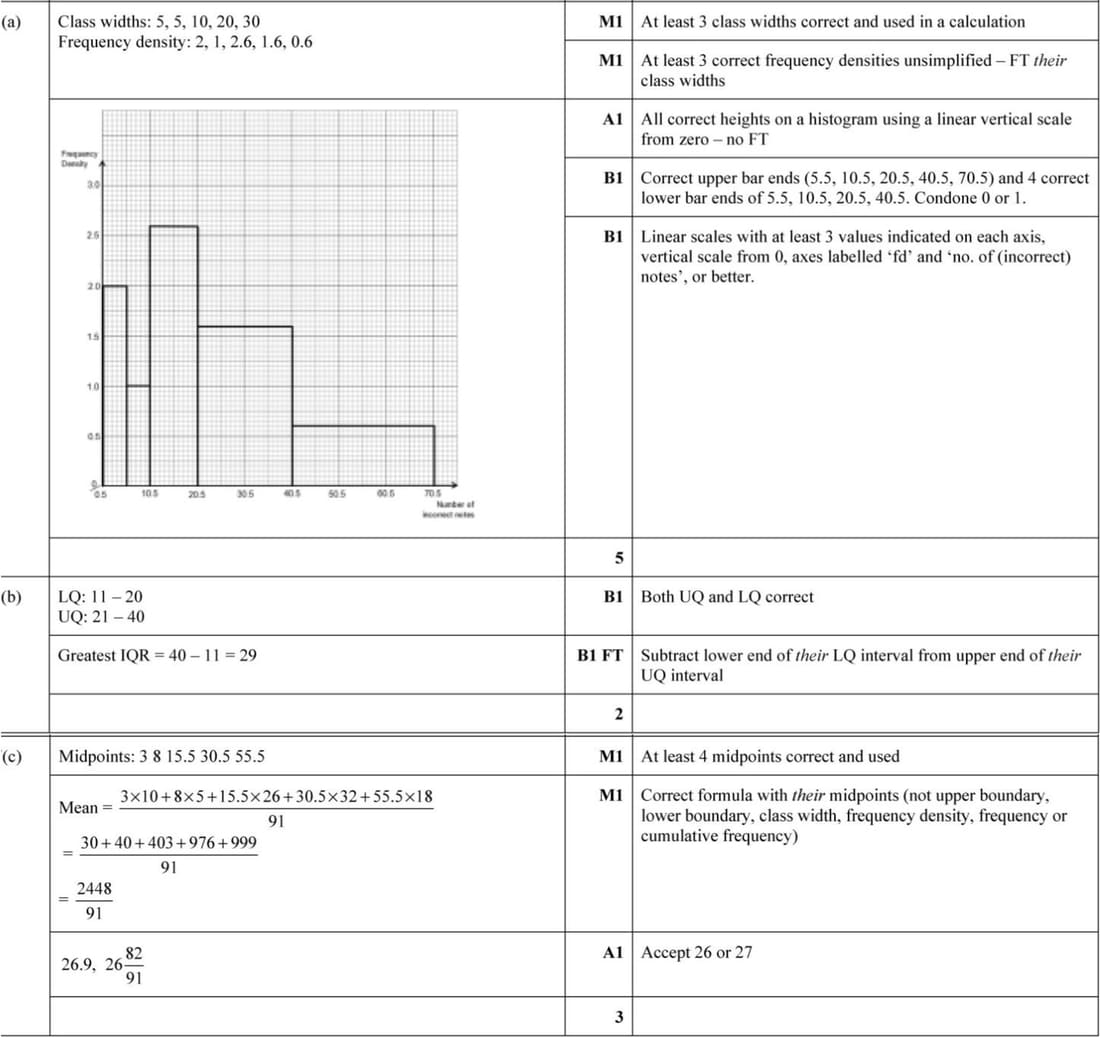
A particular piece of music was played by 91 pianists and for each pianist, the number of incorrect notes was recorded. The results are summarised in the table.
| Number of incorrect notes | 1–5 | 6–10 | 11–20 | 21–40 | 41–70 |
|---|---|---|---|---|---|
| Frequency | 10 | 5 | 26 | 32 | 18 |
- Draw a histogram to represent this information.
- State which class interval contains the lower quartile and which class interval contains the upper quartile. Hence find the greatest possible value of the interquartile range.
- Calculate an estimate for the mean number of incorrect notes.
June 2020 p51 q7
2421
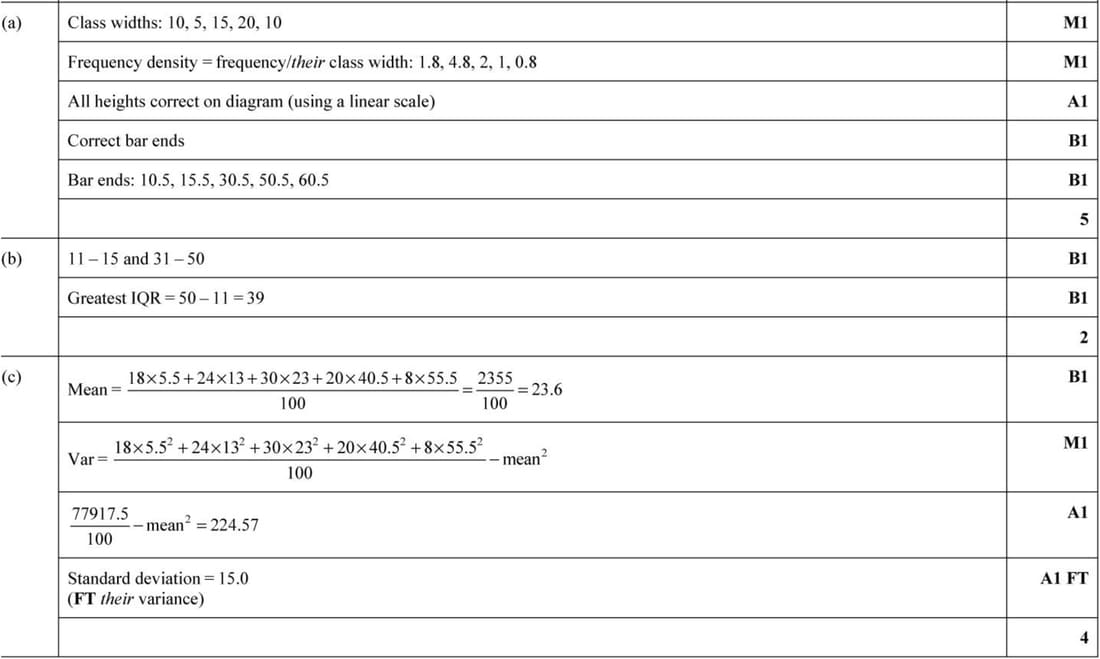
The numbers of chocolate bars sold per day in a cinema over a period of 100 days are summarised in the following table.
| Number of chocolate bars sold | 1–10 | 11–15 | 16–30 | 31–50 | 51–60 |
|---|---|---|---|---|---|
| Number of days | 18 | 24 | 30 | 20 | 8 |
(a) Draw a histogram to represent this information.
(b) What is the greatest possible value of the interquartile range for the data?
(c) Calculate estimates of the mean and standard deviation of the number of chocolate bars sold.