Exam-Style Problems
⬅ Back to SubchapterNov 2007 p6 q5
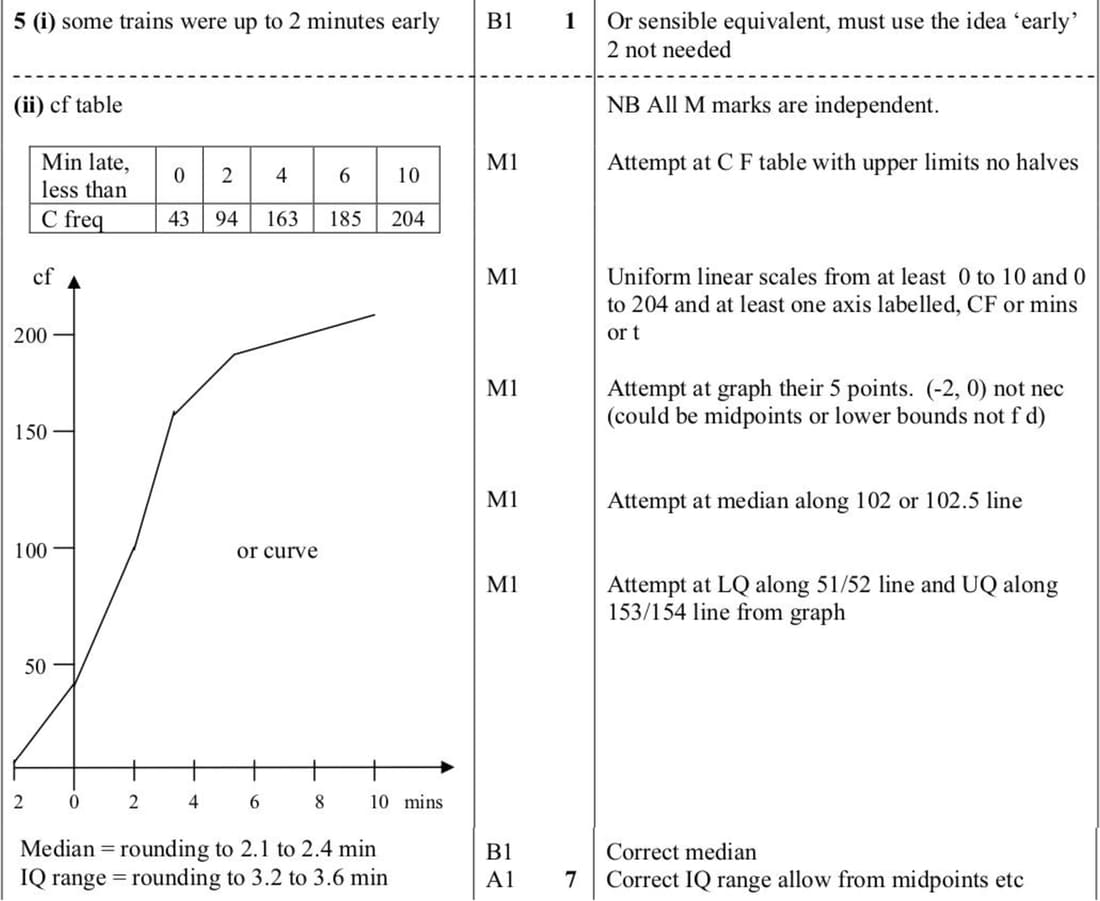
The arrival times of 204 trains were noted and the number of minutes, t, that each train was late was recorded. The results are summarised in the table.
| Number of minutes late (t) | -2 ≤ t < 0 | 0 ≤ t < 2 | 2 ≤ t < 4 | 4 ≤ t < 6 | 6 ≤ t < 10 |
|---|---|---|---|---|---|
| Number of trains | 43 | 51 | 69 | 22 | 19 |
- Explain what -2 ≤ t < 0 means about the arrival times of trains.
- Draw a cumulative frequency graph, and from it estimate the median and the interquartile range of the number of minutes late of these trains.
June 2004 p6 q2
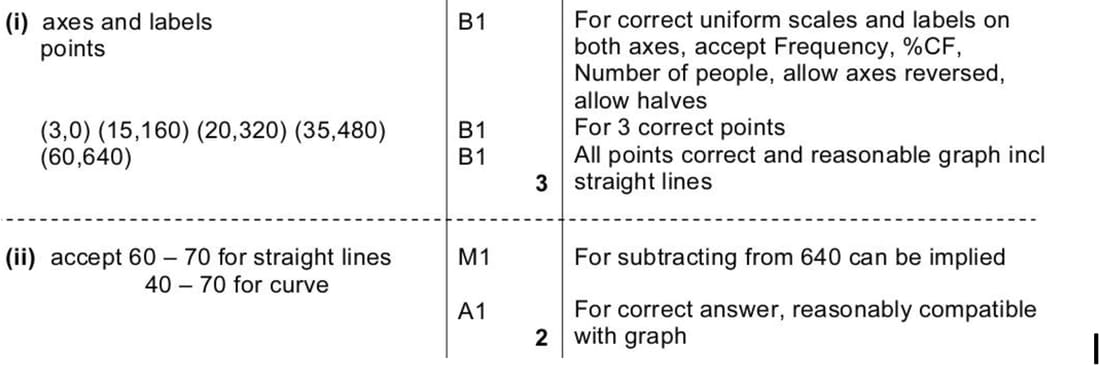
In a recent survey, 640 people were asked about the length of time each week that they spent watching television. The median time was found to be 20 hours, and the lower and upper quartiles were 15 hours and 35 hours respectively. The least amount of time that anyone spent was 3 hours, and the greatest amount was 60 hours.
- On graph paper, show these results using a fully labelled cumulative frequency graph.
- Use your graph to estimate how many people watched more than 50 hours of television each week.
June 2002 p6 q2
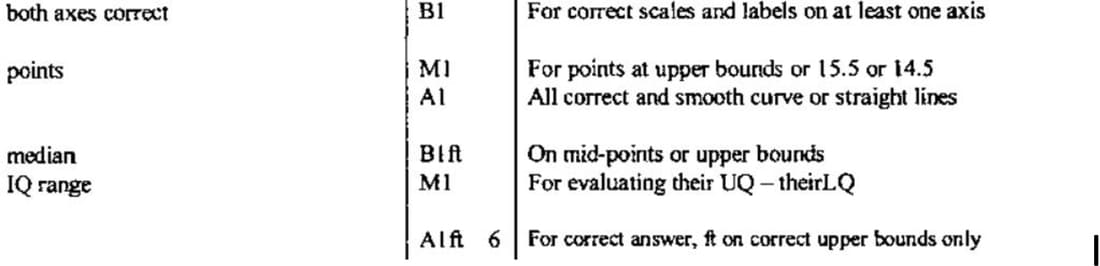
The manager of a company noted the times spent in 80 meetings. The results were as follows.
| Time \((t)\) minutes | \( 0 < t \le 15 \) | \( 15 < t \le 30 \) | \( 30 < t \le 60 \) | \( 60 < t \le 90 \) | \( 90 < t \le 120 \) |
|---|---|---|---|---|---|
| Number of meetings | 4 | 7 | 24 | 38 | 7 |
Draw a cumulative frequency graph and use this to estimate the median time and the interquartile range.
Nov 2022 p53 q3
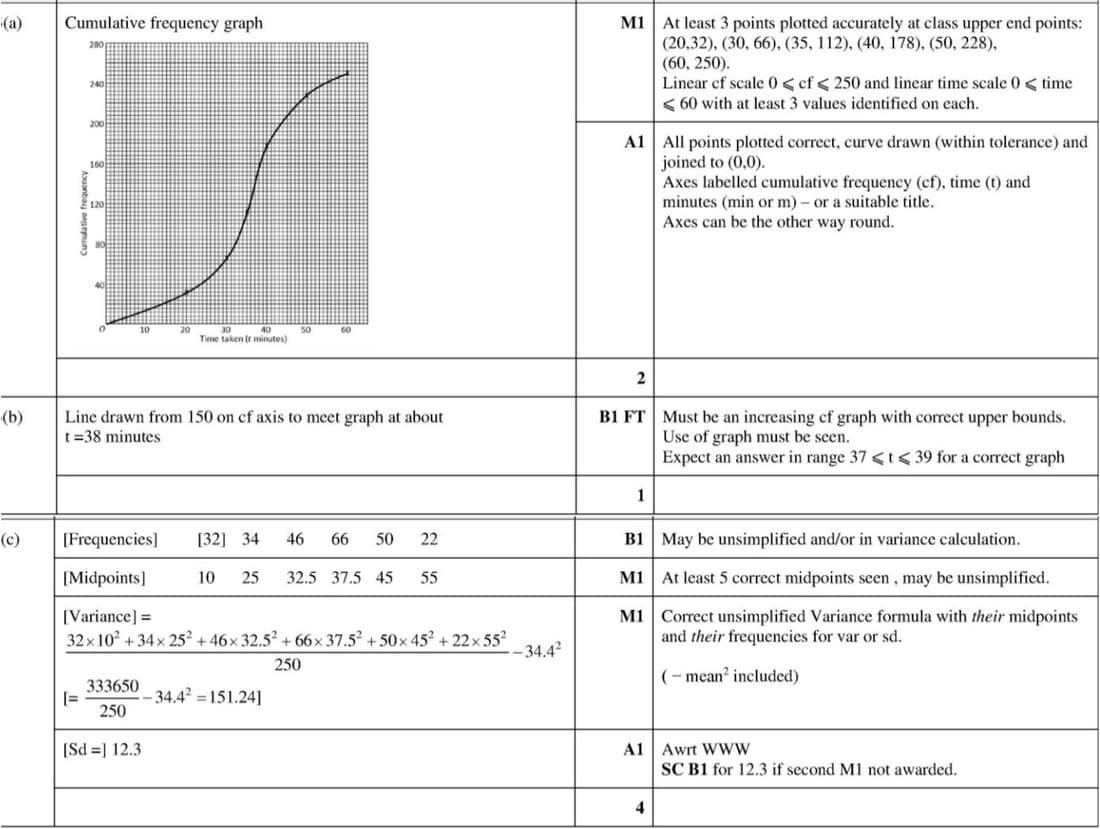
The times, t minutes, taken to complete a walking challenge by 250 members of a club are summarised in the table.
| Time taken (t minutes) | t ≤ 20 | t ≤ 30 | t ≤ 35 | t ≤ 40 | t ≤ 50 | t ≤ 60 |
|---|---|---|---|---|---|---|
| Cumulative frequency | 32 | 66 | 112 | 178 | 228 | 250 |
(a) Draw a cumulative frequency graph to illustrate the data.
(b) Use your graph to estimate the 60th percentile of the data.
It is given that an estimate for the mean time taken to complete the challenge by these 250 members is 34.4 minutes.
(c) Calculate an estimate for the standard deviation of the times taken to complete the challenge by these 250 members.
June 2022 p53 q1
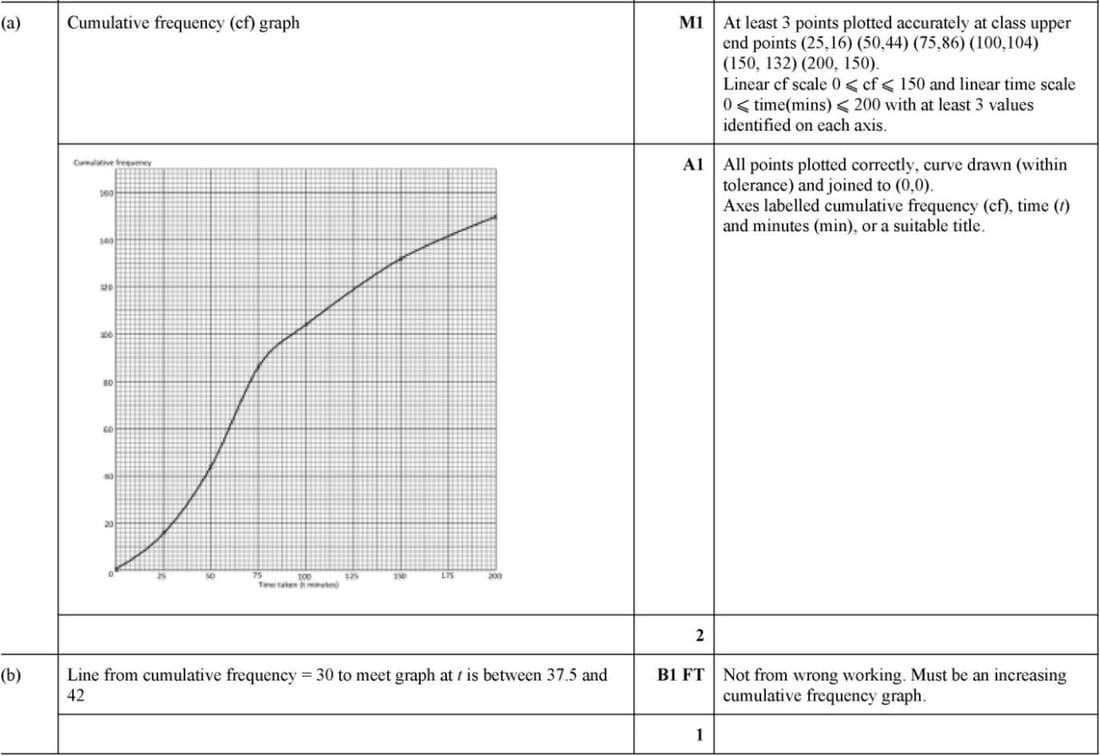
The time taken, \(t\) minutes, to complete a puzzle was recorded for each of 150 students. These times are summarised in the table.
| Time taken \((t)\) minutes | \(t \le 25\) | \(t \le 50\) | \(t \le 75\) | \(t \le 100\) | \(t \le 150\) | \(t \le 200\) |
|---|---|---|---|---|---|---|
| Cumulative frequency | 16 | 44 | 86 | 104 | 132 | 150 |
- Draw a cumulative frequency graph to illustrate the data.
- Use your graph to estimate the 20th percentile of the data.