Exam-Style Problems
⬅ Back to SubchapterNov 2004 p6 q2
2413
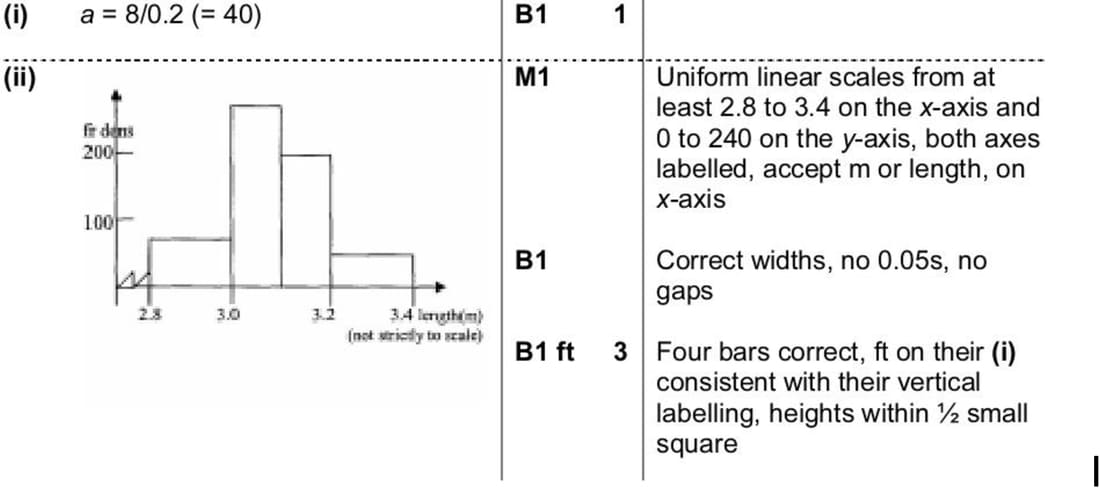
The lengths of cars travelling on a car ferry are noted. The data are summarised in the following table.
| Length of car \( x \) (metres) | \( 2.80 \le x < 3.00 \) | \( 3.00 \le x < 3.10 \) | \( 3.10 \le x < 3.20 \) | \( 3.20 \le x < 3.40 \) |
|---|---|---|---|---|
| Frequency | 17 | 24 | 19 | 8 |
| Frequency density | 85 | 240 | 190 | \( a \) |
(i) Find the value of \( a \).
(ii) Draw a histogram on graph paper to represent the data.
Nov 2003 p6 q2
2414
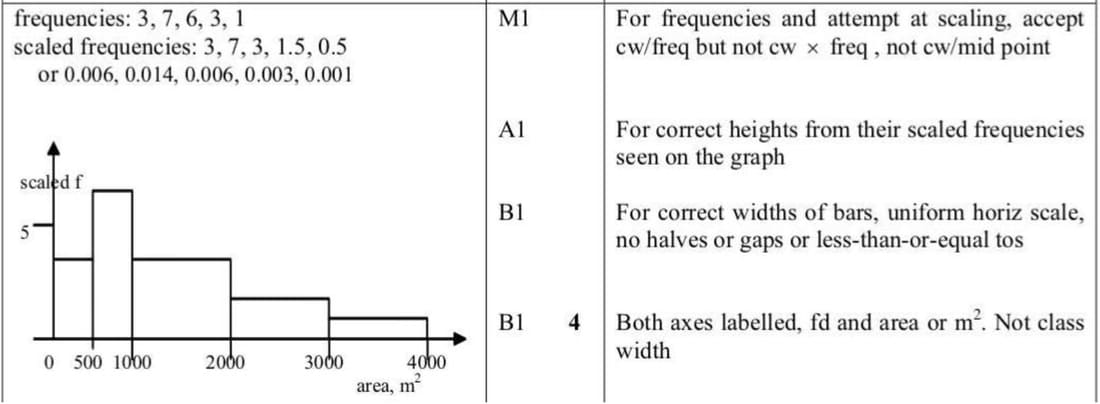
The floor areas, \( x \) m\(^2\), of 20 factories are as follows:
150, 350, 450, 578, 595, 644, 722, 798, 802, 904, 1000, 1330, 1533, 1561, 1778, 1960, 2167, 2330, 2433, 3231
Represent these data by a histogram on graph paper, using intervals:
- \( 0 \le x < 500 \)
- \( 500 \le x < 1000 \)
- \( 1000 \le x < 2000 \)
- \( 2000 \le x < 3000 \)
- \( 3000 \le x < 4000 \)
June 2003 p6 q7
2415
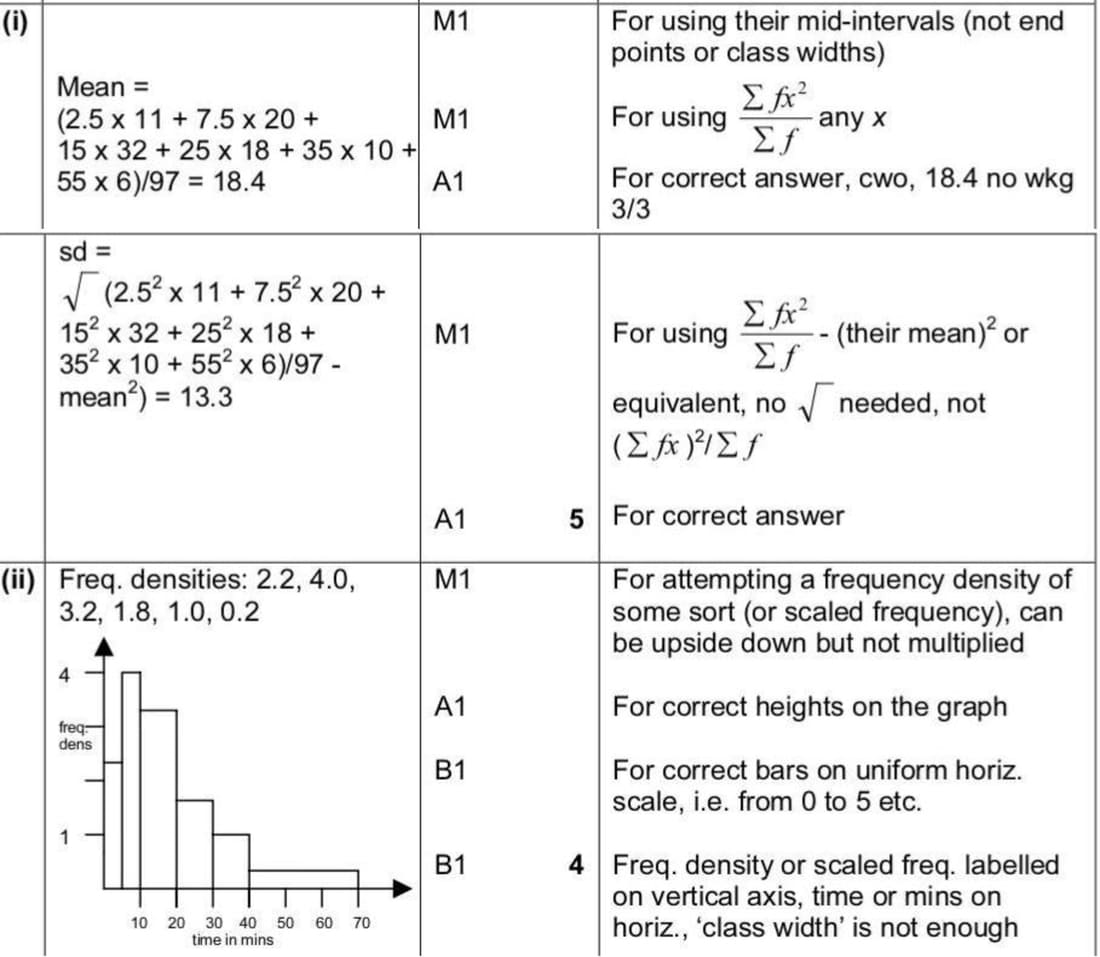
A random sample of 97 people who own mobile phones was used to collect data on the amount of time they spent per day on their phones. The results are displayed in the table below.
| Time spent per day \( t \) (minutes) | \( 0 \le t < 5 \) | \( 5 \le t < 10 \) | \( 10 \le t < 20 \) | \( 20 \le t < 30 \) | \( 30 \le t < 40 \) | \( 40 \le t < 70 \) |
|---|---|---|---|---|---|---|
| Frequency (people) | 11 | 20 | 32 | 18 | 10 | 6 |
(i) Calculate estimates of the mean and standard deviation of the time spent per day on these mobile phones.
(ii) On graph paper, draw a fully labelled histogram to represent the data.
June 2022 p51 q3
2416
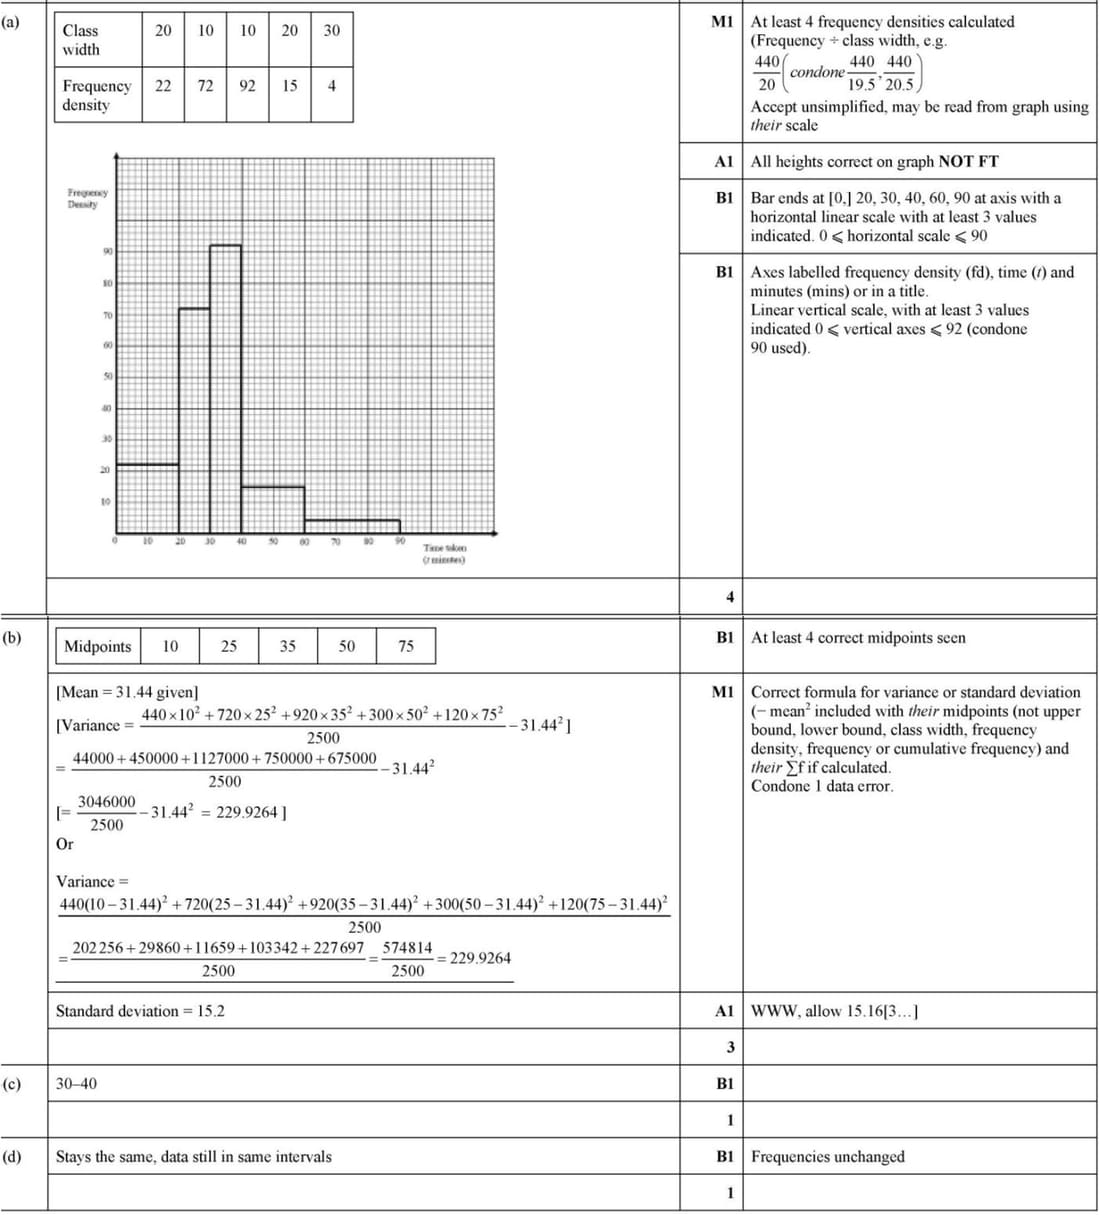
The times taken to travel to college by 2500 students are summarised in the table.
| Time taken \( t \) (minutes) | \( 0 \le t < 20 \) | \( 20 \le t < 30 \) | \( 30 \le t < 40 \) | \( 40 \le t < 60 \) | \( 60 \le t < 90 \) |
|---|---|---|---|---|---|
| Frequency | 440 | 720 | 920 | 300 | 120 |
(a) Draw a histogram to represent this information.
From the data, the estimate of the mean value of \( t \) is \( 31.44 \).
(b) Calculate an estimate of the standard deviation of the times taken to travel to college.
(c) In which class interval does the upper quartile lie?
It was later discovered that the times taken to travel to college by two students were incorrectly recorded. One student’s time was recorded as \( 15 \) instead of \( 5 \) and the other’s time was recorded as \( 65 \) instead of \( 75 \).
(d) Without doing any further calculations, state with a reason whether the estimate of the standard deviation in part (b) would be increased, decreased or stay the same.
Mar 2022 p52 q3
2417
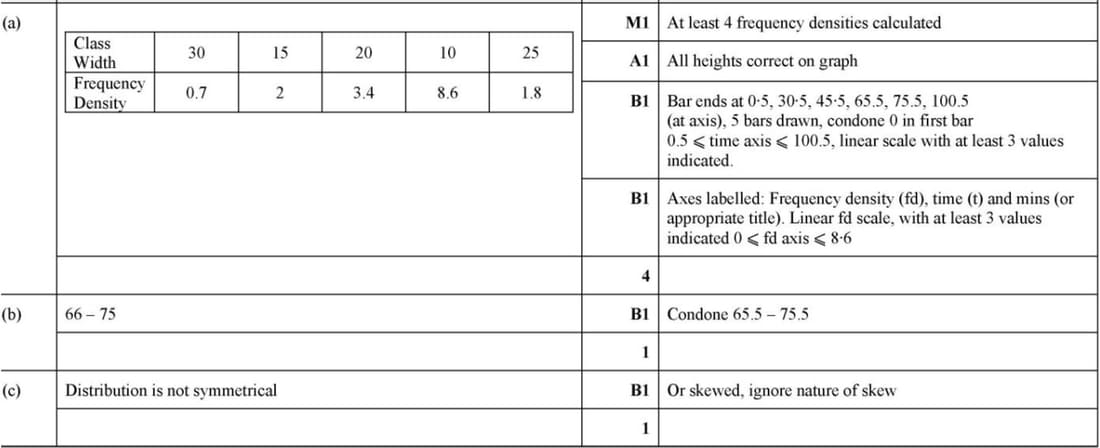
At a summer camp an arithmetic test is taken by 250 children. The times taken, to the nearest minute, to complete the test were recorded. The results are summarised in the table.
| Time taken (minutes) | 1–30 | 31–45 | 46–65 | 66–75 | 76–100 |
|---|---|---|---|---|---|
| Frequency | 21 | 30 | 68 | 86 | 45 |
(a) Draw a histogram to represent this information.
(b) State which class interval contains the median.
(c) Given that an estimate of the mean time is 61.05 minutes, state what feature of the distribution accounts for the median and the mean being different.