Exam-Style Problems
⬅ Back to SubchapterJune 2004 p6 q1
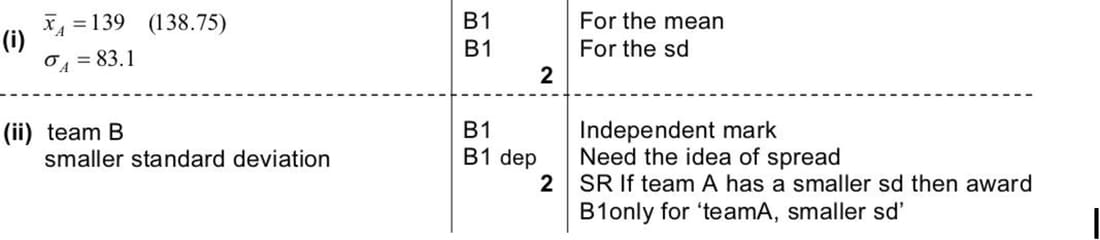
Two cricket teams kept records of the number of runs scored by their teams in 8 matches. The scores are shown in the following table.
| Team A | 150 | 220 | 77 | 30 | 298 | 118 | 160 | 57 |
|---|---|---|---|---|---|---|---|---|
| Team B | 166 | 142 | 170 | 93 | 111 | 130 | 148 | 86 |
- Find the mean and standard deviation of the scores for team A. [2]
- State with a reason which team has the more consistent scores. [2]
The mean and standard deviation for team B are 130.75 and 29.63 respectively.
Nov 2003 p6 q1
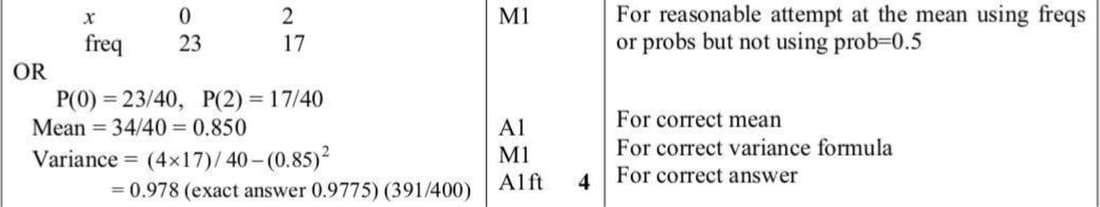
A computer can generate random numbers which are either 0 or 2. On a particular occasion, it generates a set of numbers which consists of 23 zeros and 17 twos. Find the mean and variance of this set of 40 numbers.
June 2022 p53 q2
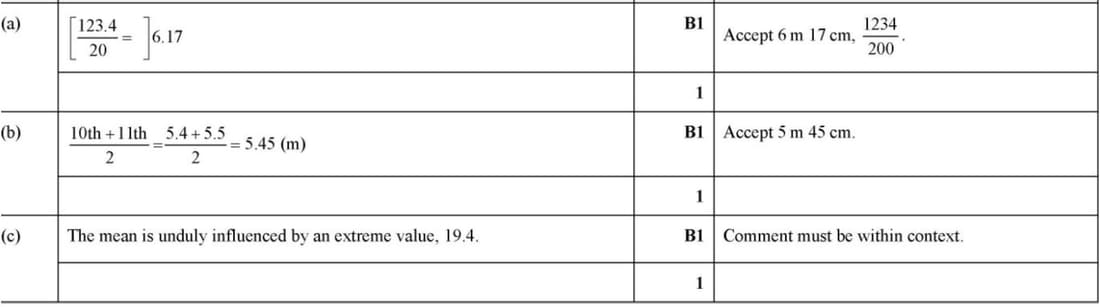
Twenty children were asked to estimate the height of a particular tree. Their estimates, in metres, were as follows.
4.1, 4.2, 4.4, 4.5, 4.6, 4.8, 5.0, 5.2, 5.3, 5.4, 5.5, 5.8, 6.0, 6.2, 6.3, 6.4, 6.6, 6.8, 6.9, 19.4
(a) Find the mean of the estimated heights.
(b) Find the median of the estimated heights.
(c) Give a reason why the median is likely to be more suitable than the mean as a measure of the central tendency for this information.
June 2021 p53 q3
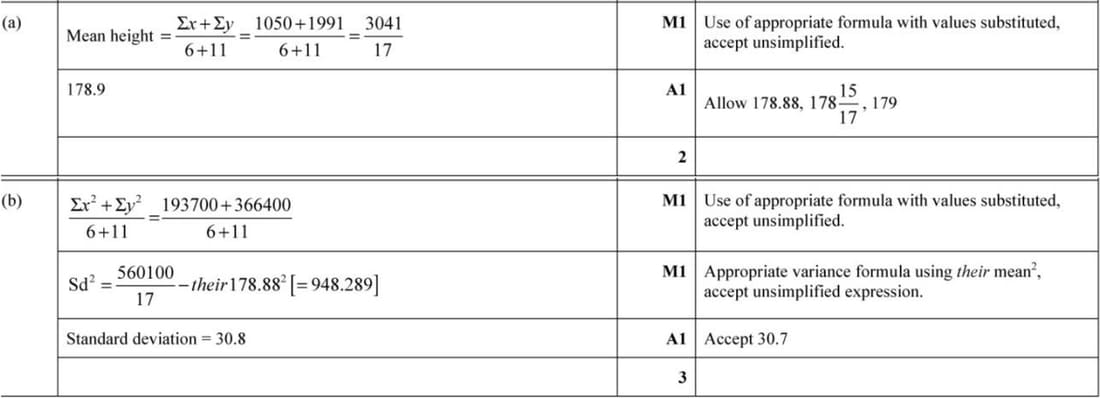
A sports club has a volleyball team and a hockey team. The heights of the 6 members of the volleyball team are summarised by \(\Sigma x = 1050\) and \(\Sigma x^2 = 193700\), where \(x\) is the height of a member in cm. The heights of the 11 members of the hockey team are summarised by \(\Sigma y = 1991\) and \(\Sigma y^2 = 366400\), where \(y\) is the height of a member in cm.
(a) Find the mean height of all 17 members of the club.
(b) Find the standard deviation of the heights of all 17 members of the club.
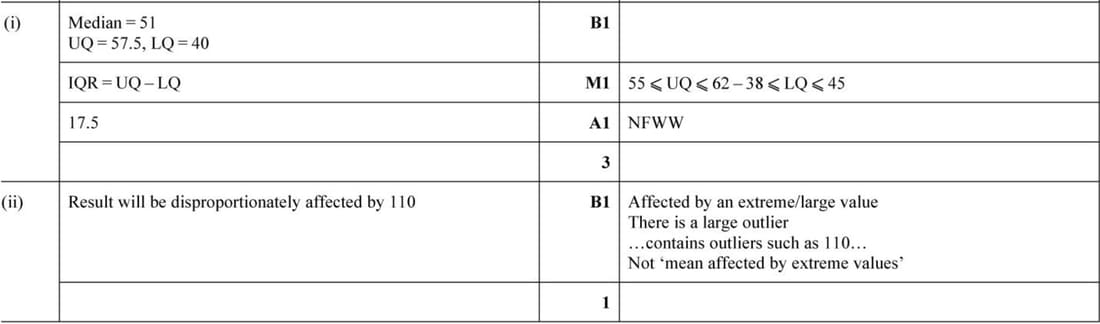
Nov 2019 p62 q1
Twelve tourists were asked to estimate the height, in metres, of a new building. Their estimates were as follows.
50, 45, 62, 30, 40, 55, 110, 38, 52, 60, 55, 40
- Find the median and the interquartile range for the data.
- Give a disadvantage of using the mean as a measure of the central tendency in this case.