Exam-Style Problems
⬅ Back to SubchapterJune 2011 p62 q5
A hotel has 90 rooms. The table summarises information about the number of rooms occupied each day for a period of 200 days.
| Number of rooms occupied | 1 – 20 | 21 – 40 | 41 – 50 | 51 – 60 | 61 – 70 | 71 – 90 |
|---|---|---|---|---|---|---|
| Frequency | 10 | 32 | 62 | 50 | 28 | 18 |
- Draw a cumulative frequency graph on graph paper to illustrate this information.
- Estimate the number of days when over 30 rooms were occupied.
- On 75% of the days at most n rooms were occupied. Estimate the value of n.
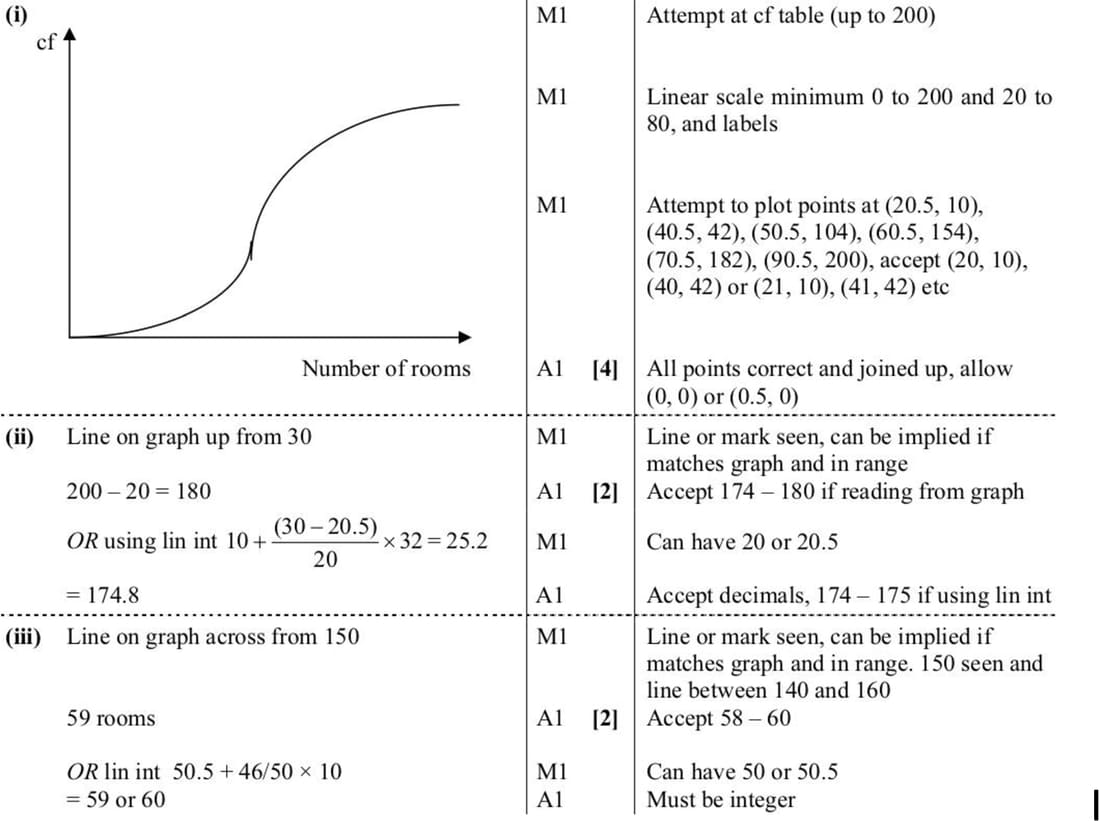
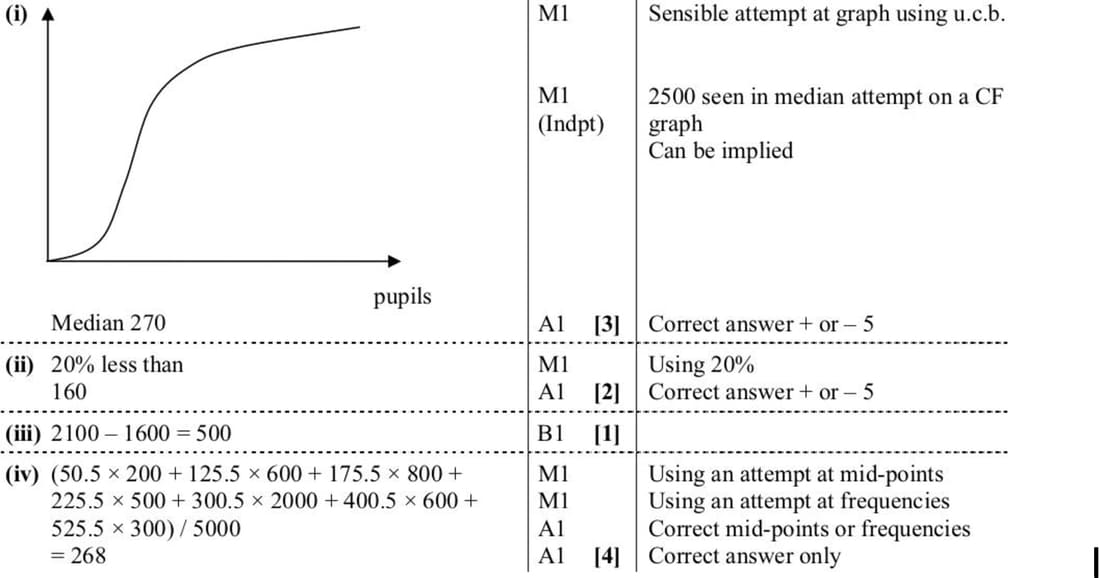
June 2011 p61 q6
There are 5000 schools in a certain country. The cumulative frequency table shows the number of pupils in a school and the corresponding number of schools.
| Number of pupils in a school | \(\leq 100\) | \(\leq 150\) | \(\leq 200\) | \(\leq 250\) | \(\leq 350\) | \(\leq 450\) | \(\leq 600\) |
|---|---|---|---|---|---|---|---|
| Cumulative frequency | 200 | 800 | 1600 | 2100 | 4100 | 4700 | 5000 |
- Draw a cumulative frequency graph with a scale of 2 cm to 100 pupils on the horizontal axis and a scale of 2 cm to 1000 schools on the vertical axis. Use your graph to estimate the median number of pupils in a school.
- 80% of the schools have more than \(n\) pupils. Estimate the value of \(n\) correct to the nearest ten.
- Find how many schools have between 201 and 250 (inclusive) pupils.
- Calculate an estimate of the mean number of pupils per school.
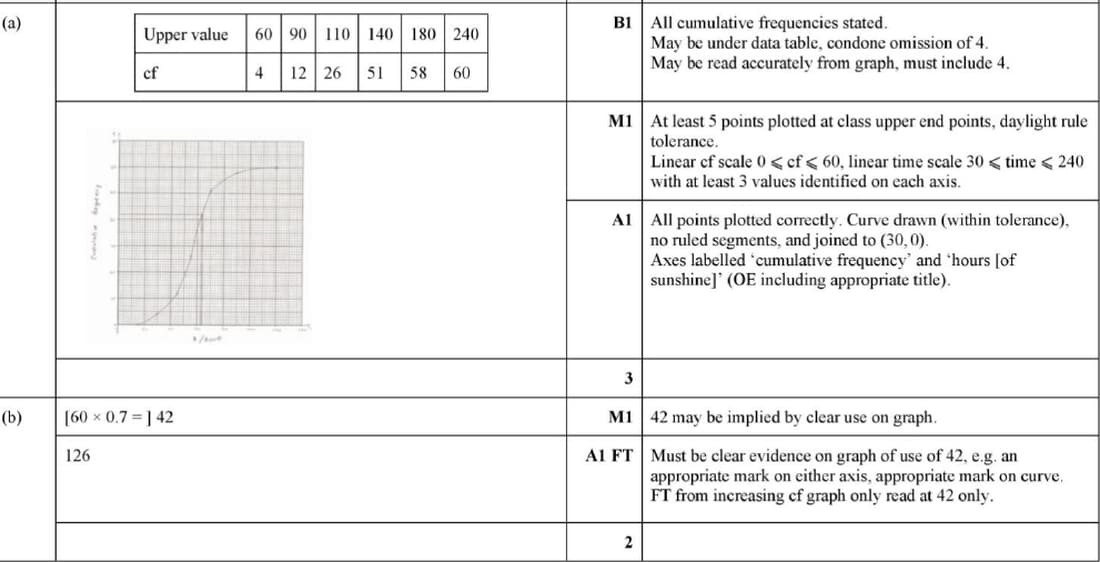
Feb/Mar 2023 p52 q1
Each year the total number of hours, \(x\), of sunshine in Kintoo is recorded during the month of June. The results for the last 60 years are summarised in the table.
| \(x\) | 30 \(\leq x <\) 60 | 60 \(\leq x <\) 90 | 90 \(\leq x <\) 110 | 110 \(\leq x <\) 140 | 140 \(\leq x <\) 180 | 180 \(\leq x <\) 240 |
|---|---|---|---|---|---|---|
| Number of years | 4 | 8 | 14 | 25 | 7 | 2 |
(a) Draw a cumulative frequency graph to illustrate the data.
(b) Use your graph to estimate the 70th percentile of the data.
June 2010 p62 q3
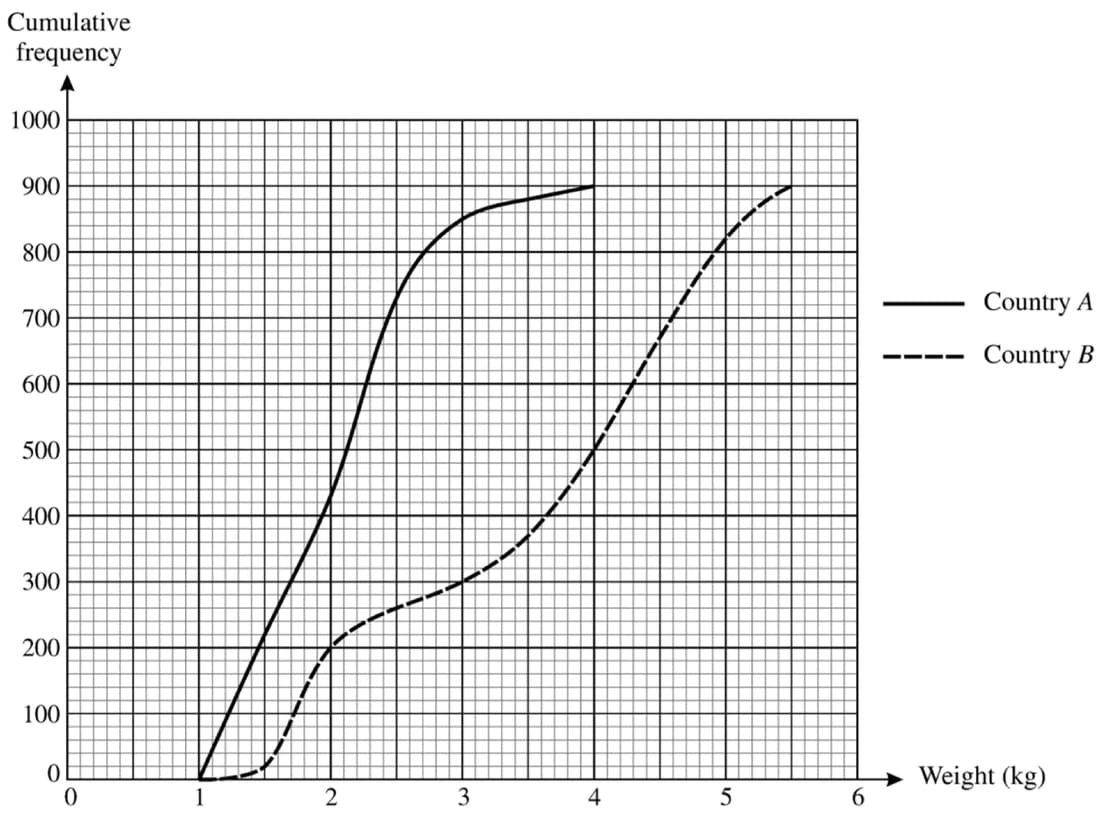
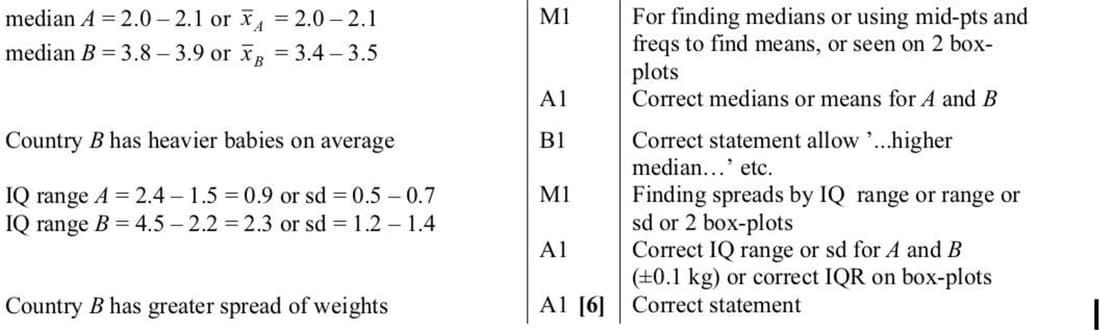
The birth weights of random samples of 900 babies born in country A and 900 babies born in country B are illustrated in the cumulative frequency graphs. Use suitable data from these graphs to compare the central tendency and spread of the birth weights of the two sets of babies.
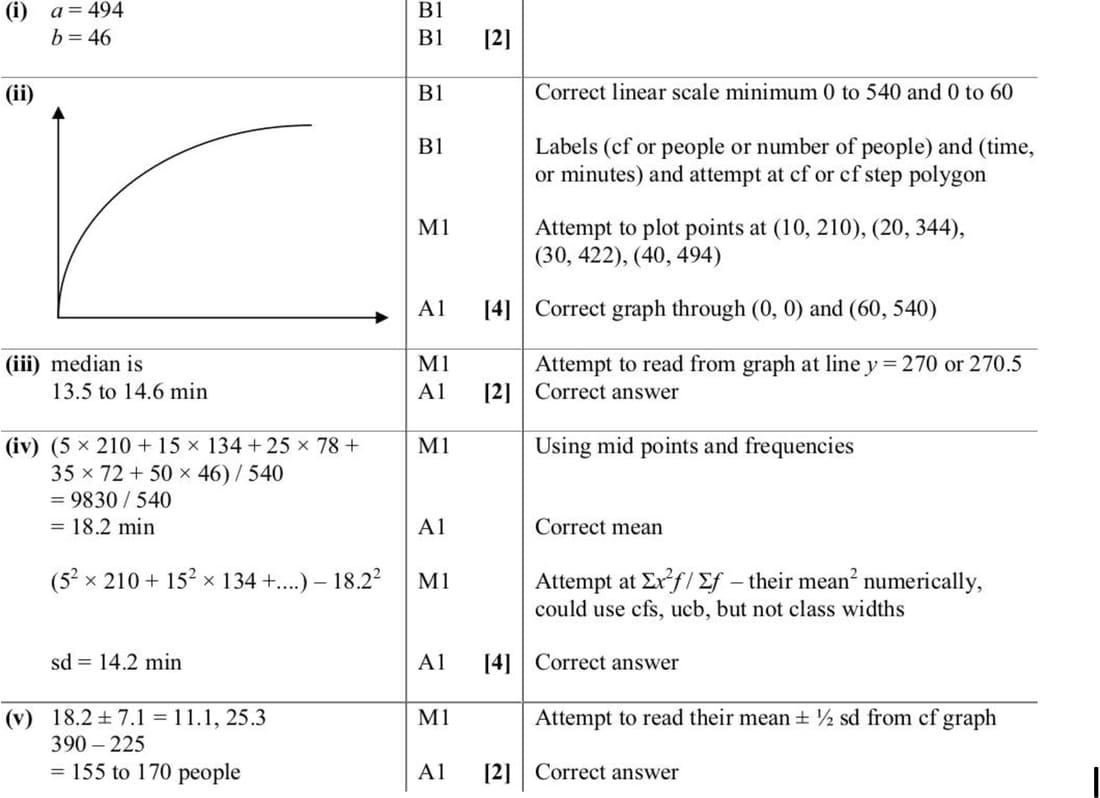
June 2009 p6 q6
During January the numbers of people entering a store during the first hour after opening were as follows.
| Time after opening, x minutes | Frequency | Cumulative frequency |
|---|---|---|
| 0 < x ≤ 10 | 210 | 210 |
| 10 < x ≤ 20 | 134 | 344 |
| 20 < x ≤ 30 | 78 | 422 |
| 30 < x ≤ 40 | 72 | a |
| 40 < x ≤ 60 | b | 540 |
- Find the values of a and b.
- Draw a cumulative frequency graph to represent this information. Take a scale of 2 cm for 10 minutes on the horizontal axis and 2 cm for 50 people on the vertical axis.
- Use your graph to estimate the median time after opening that people entered the store.
- Calculate estimates of the mean, m minutes, and standard deviation, s minutes, of the time after opening that people entered the store.
- Use your graph to estimate the number of people entering the store between \(m - \frac{1}{2}s\) and \(m + \frac{1}{2}s\) minutes after opening.