Exam-Style Problems
⬅ Back to SubchapterNov 2009 p62 q6
2408
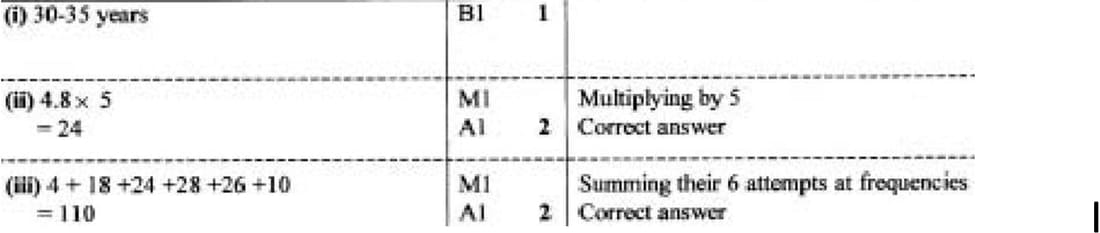
The following table gives the marks, out of 75, in a pure mathematics examination taken by 234 students.
| Marks | 1–20 | 21–30 | 31–40 | 41–50 | 51–60 | 61–75 |
|---|---|---|---|---|---|---|
| Frequency | 40 | 34 | 56 | 54 | 29 | 21 |
(i) Draw a histogram on graph paper to represent these results.
(ii) Calculate estimates of the mean mark and the standard deviation.
June 2008 p6 q5
2409
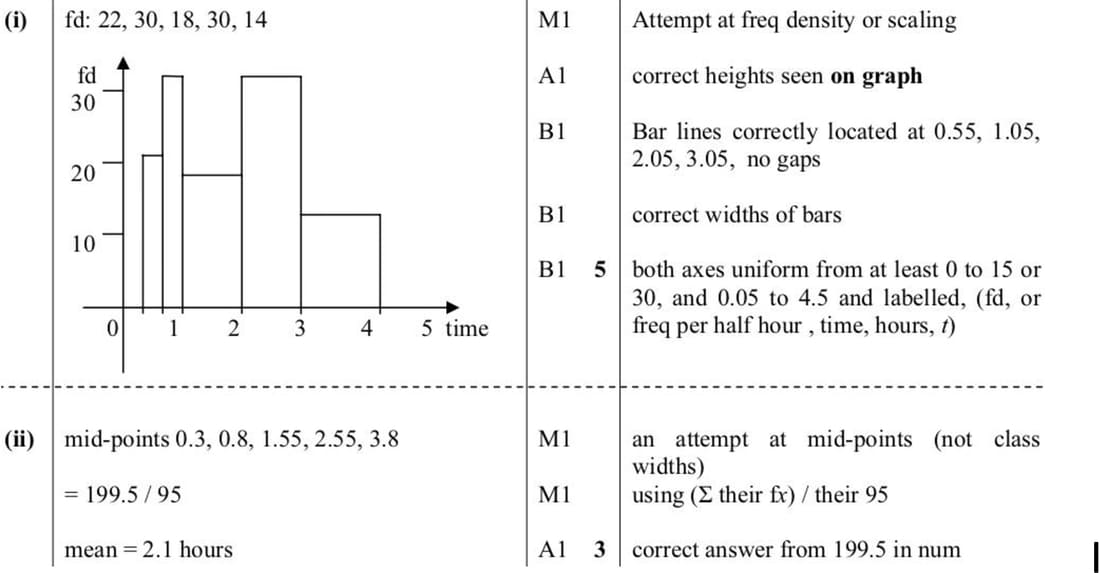
As part of a data collection exercise, members of a certain school year group were asked how long they spent on their Mathematics homework during one particular week. The times are given to the nearest 0.1 hour. The results are displayed in the following table.
| Time spent \( t \) (hours) | \( 0.1 \le t \le 0.5 \) | \( 0.6 \le t \le 1.0 \) | \( 1.1 \le t \le 2.0 \) | \( 2.1 \le t \le 3.0 \) | \( 3.1 \le t \le 4.5 \) |
|---|---|---|---|---|---|
| Frequency | 11 | 15 | 18 | 30 | 21 |
(i) Draw, on graph paper, a histogram to illustrate this information.
(ii) Calculate an estimate of the mean time spent on their Mathematics homework by members of this year group.
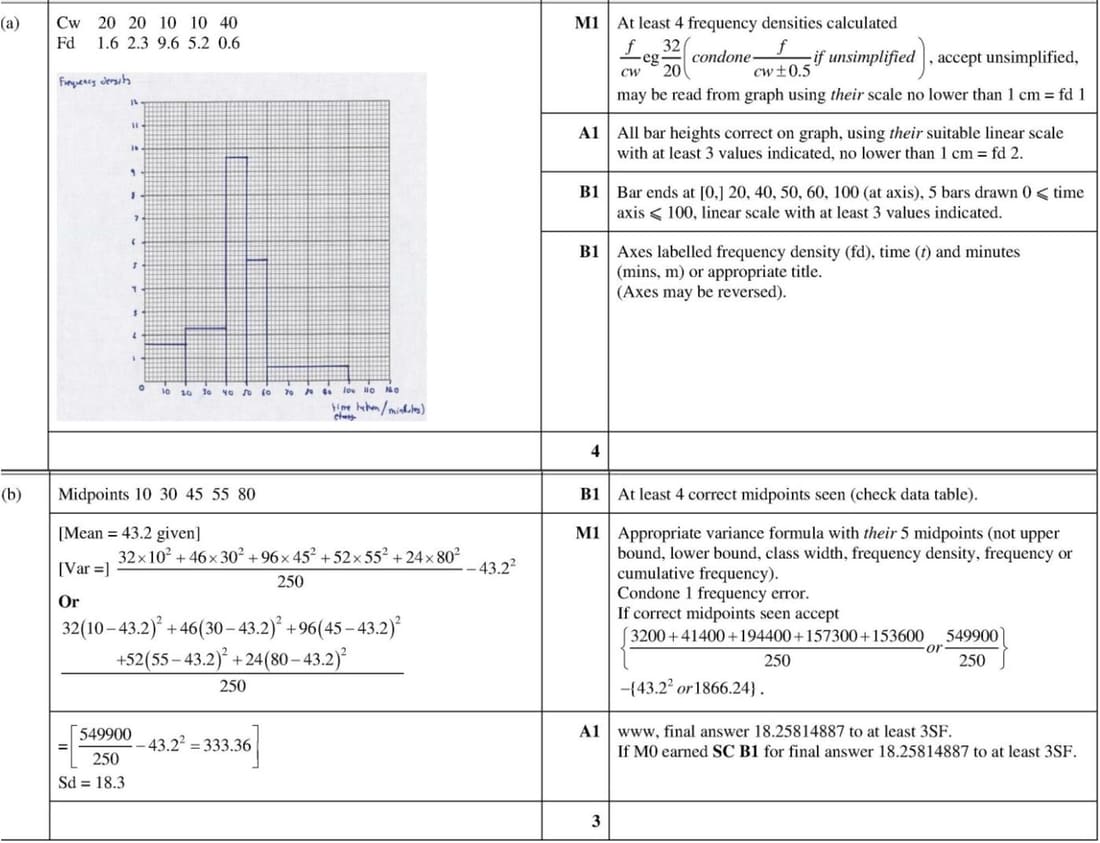
Nov 2022 p52 q4
2410
The times taken, in minutes, to complete a word processing task by 250 employees at a particular company are summarised in the table.
| Time taken \( t \) (minutes) | \( 0 \le t \lt 20 \) | \( 20 \le t \lt 40 \) | \( 40 \le t \lt 50 \) | \( 50 \le t \lt 60 \) | \( 60 \le t \lt 100 \) |
|---|---|---|---|---|---|
| Frequency | 32 | 46 | 96 | 52 | 24 |
(a) Draw a histogram to represent this information.
From the data, the estimate of the mean time taken by these 250 employees is \( 43.2 \) minutes.
(b) Calculate an estimate for the standard deviation of these times.
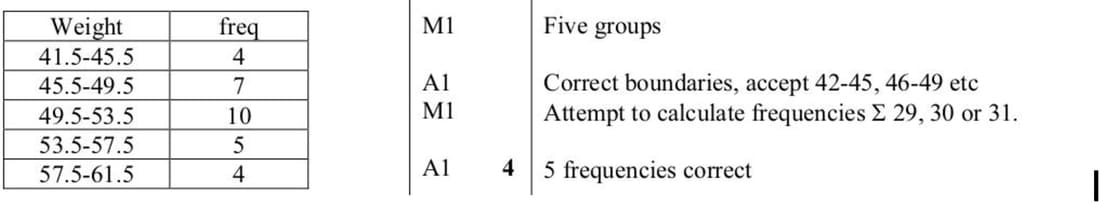
Nov 2006 p6 q1
2411
The weights of 30 children in a class, to the nearest kilogram, were as follows:
50, 45, 61, 53, 55, 47, 52, 49, 46, 51, 60, 52, 54, 47, 57, 59, 42, 46, 51, 53, 56, 48, 50, 51, 44, 52, 49, 58, 55, 45
Construct a grouped frequency table for these data such that there are five equal class intervals with the first class having a lower boundary of 41.5 kg and the fifth class having an upper boundary of 61.5 kg.
June 2006 p6 q5
2412
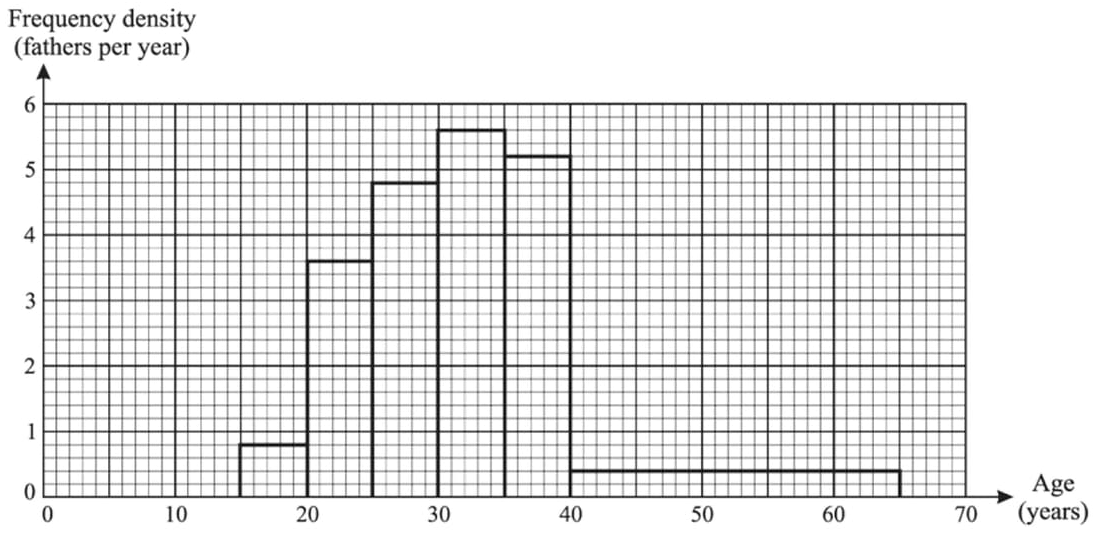
Each father in a random sample of fathers was asked how old he was when his first child was born. The following histogram represents the information.
- What is the modal age group?
- How many fathers were between 25 and 30 years old when their first child was born?
- How many fathers were in the sample?