Exam-Style Problems
⬅ Back to SubchapterNov 2012 p63 q4
2403
In a survey, the percentage of meat in a certain type of take-away meal was found. The results, to the nearest integer, for 193 take-away meals are summarised in the table.
| Percentage of meat | 1–5 | 6–10 | 11–20 | 21–30 | 31–50 |
|---|---|---|---|---|---|
| Frequency | 59 | 67 | 38 | 18 | 11 |
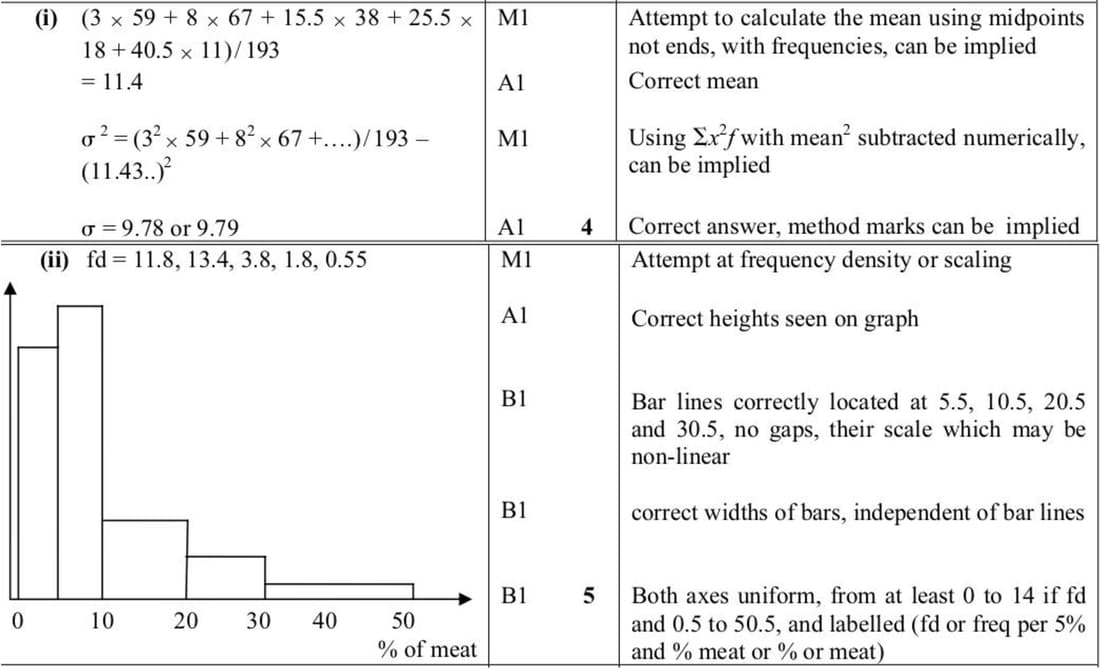
(i) Calculate estimates of the mean and standard deviation of the percentage of meat in these take-away meals.
(ii) Draw, on graph paper, a histogram to illustrate the information in the table.
Nov 2012 p62 q3
2404
The table summarises the times that 112 people took to travel to work on a particular day.
| Time (minutes) | 0 < t ≤ 10 | 10 < t ≤ 15 | 15 < t ≤ 20 | 20 < t ≤ 25 | 25 < t ≤ 40 | 40 < t ≤ 60 |
|---|---|---|---|---|---|---|
| Frequency | 19 | 12 | 28 | 22 | 18 | 13 |
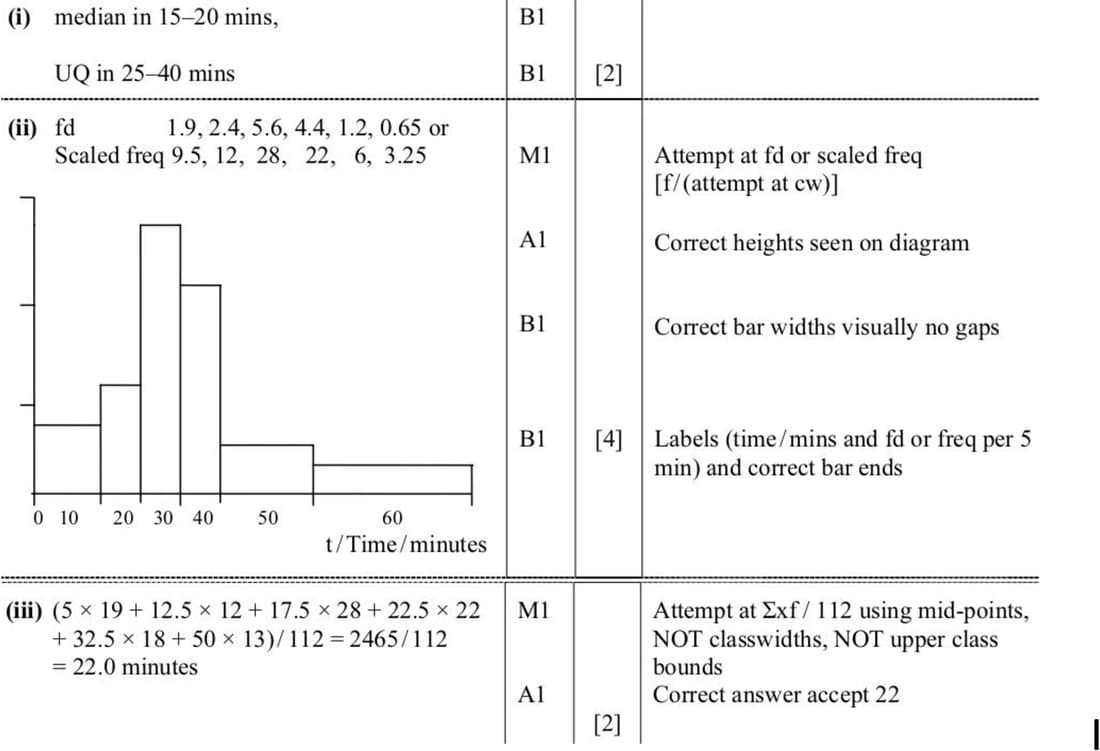
- State which time interval in the table contains the median and which time interval contains the upper quartile.
- On graph paper, draw a histogram to represent the data.
- Calculate an estimate of the mean time to travel to work.
Nov 2011 p62 q4
2405
The weights of 220 sausages are summarised in the following table.
| Weight (grams) | <20 | <30 | <40 | <45 | <50 | <60 | <70 |
|---|---|---|---|---|---|---|---|
| Cumulative frequency | 0 | 20 | 50 | 100 | 160 | 210 | 220 |
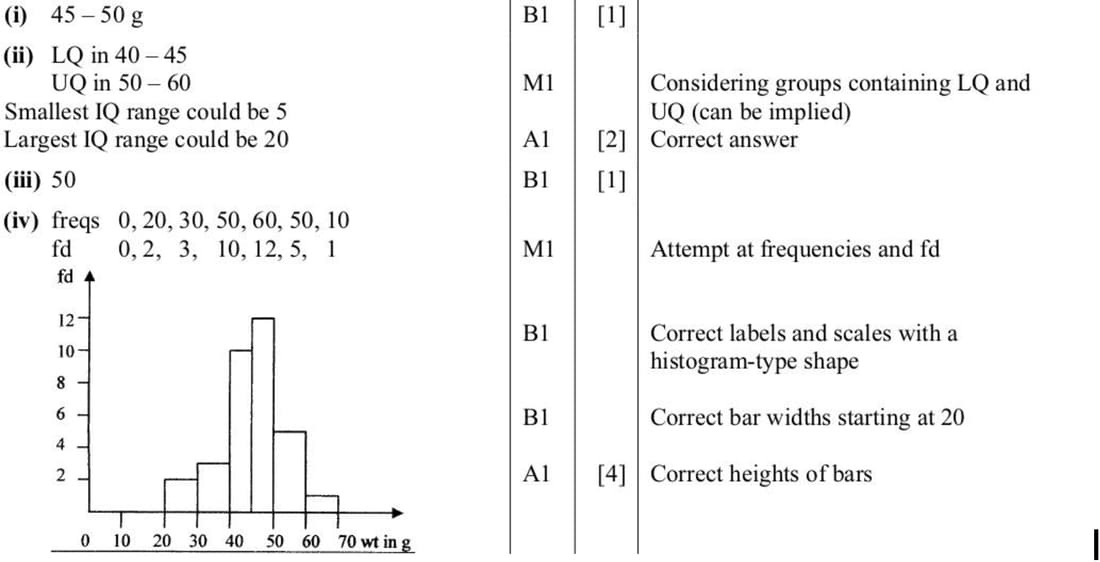
- State which interval the median weight lies in.
- Find the smallest possible value and the largest possible value for the interquartile range.
- State how many sausages weighed between 50 g and 60 g.
- On graph paper, draw a histogram to represent the weights of the sausages.
Nov 2010 p63 q5
2406
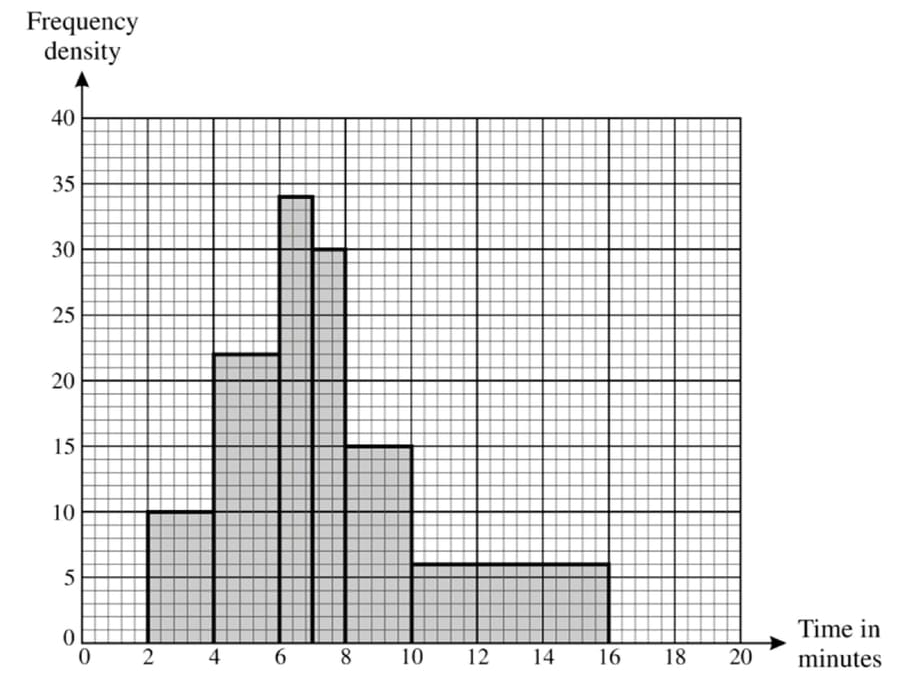
The following histogram illustrates the distribution of times, in minutes, that some students spent taking a shower.
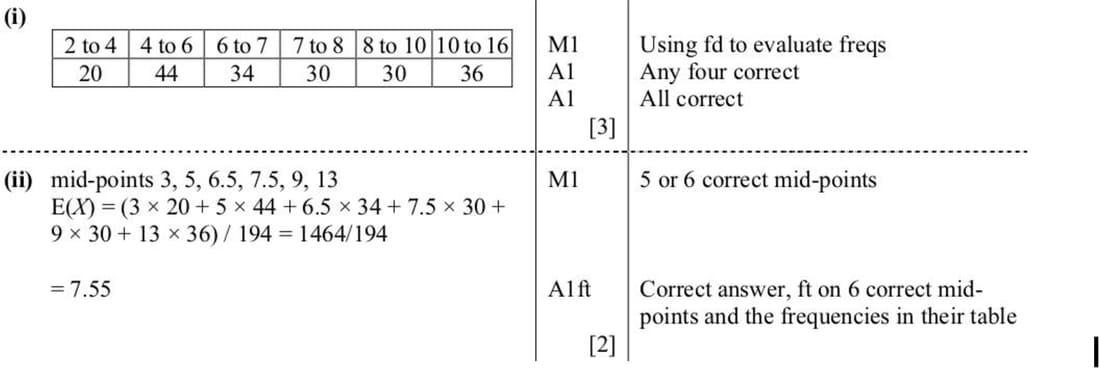
(i) Copy and complete the following frequency table for the data.
| Time \( t \) (minutes) | \( 2 < t \le 4 \) | \( 4 < t \le 6 \) | \( 6 < t \le 7 \) | \( 7 < t \le 8 \) | \( 8 < t \le 10 \) | \( 10 < t \le 16 \) |
|---|---|---|---|---|---|---|
| Frequency |
(ii) Calculate an estimate of the mean time to take a shower.
Nov 2010 p61 q4
2407
The weights in grams of a number of stones, measured correct to the nearest gram, are represented in the following table.
| Weight (grams) | 1–10 | 11–20 | 21–25 | 26–30 | 31–50 | 51–70 |
|---|---|---|---|---|---|---|
| Frequency | 2x | 4x | 3x | 5x | 4x | x |
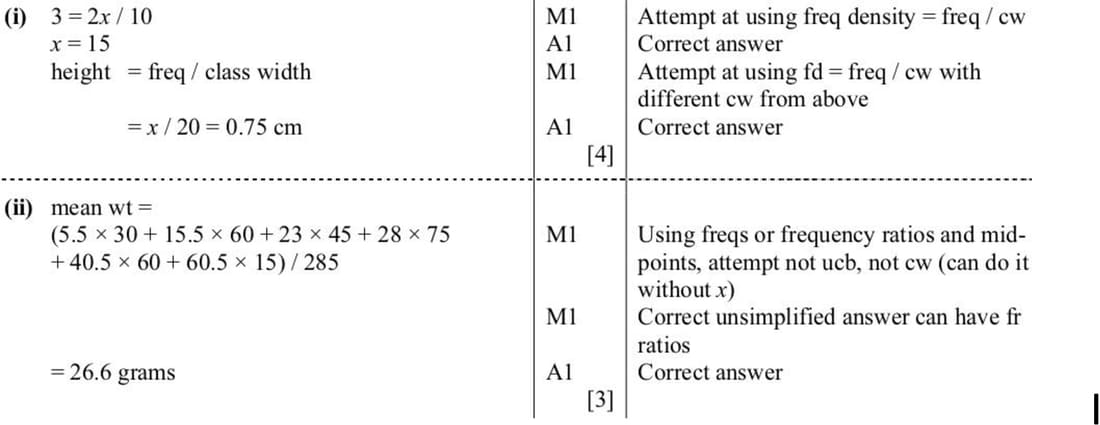
A histogram is drawn with a scale of 1 cm to 1 unit on the vertical axis, which represents frequency density. The 1–10 rectangle has height 3 cm.
(i) Calculate the value of \( x \) and the height of the 51–70 rectangle.
(ii) Calculate an estimate of the mean weight of the stones.