Exam-Style Problems
⬅ Back to SubchapterJune 2008 p6 q1
The stem-and-leaf diagram below represents data collected for the number of hits on an internet site on each day in March 2007. There is one missing value, denoted by \(x\).
Stem-and-leaf diagram:
| Stem | leaf | |
|---|---|---|
| 0 | 0 1 5 6 | (4) |
| 1 | 1 3 5 6 6 8 | (6) |
| 2 | 1 1 2 3 4 4 4 8 9 | (9) |
| 3 | 1 2 2 2 x 8 9 | (7) |
| 4 | 2 5 6 7 9 | (5) |
Key: \( 1 \mid 5 \) represents 15 hits.
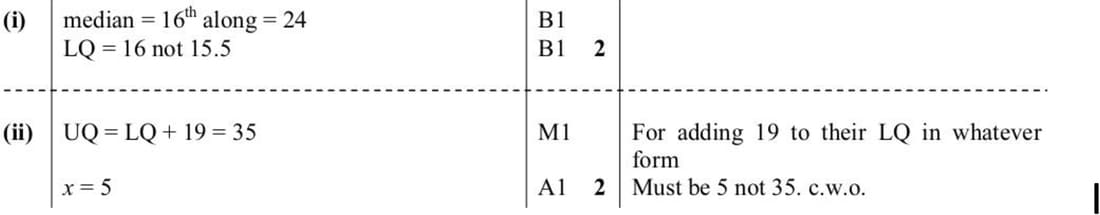
(i) Find the median and lower quartile for the number of hits each day.
(ii) The interquartile range is 19. Find the value of \(x\).
June 2007 p6 q4
The lengths of time in minutes to swim a certain distance by the members of a class of twelve 9-year-olds and by the members of a class of eight 16-year-olds are shown below.
9-year-olds: 13.0, 16.1, 16.0, 14.4, 15.9, 15.1, 14.2, 13.7, 16.7, 16.4, 15.0, 13.2
16-year-olds: 14.8, 13.0, 11.4, 11.7, 16.5, 13.7, 12.8, 12.9
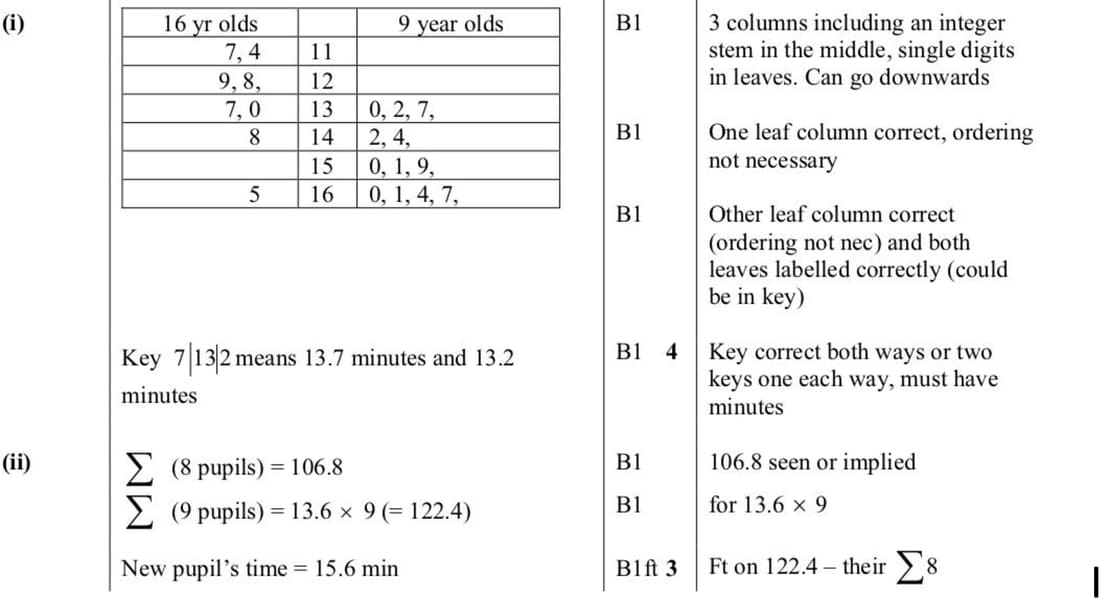
(i) Draw a back-to-back stem-and-leaf diagram to represent the information above.
(ii) A new pupil joined the 16-year-old class and swam the distance. The mean time for the class of nine pupils was now 13.6 minutes. Find the new pupil’s time to swim the distance.
June 2003 p6 q1
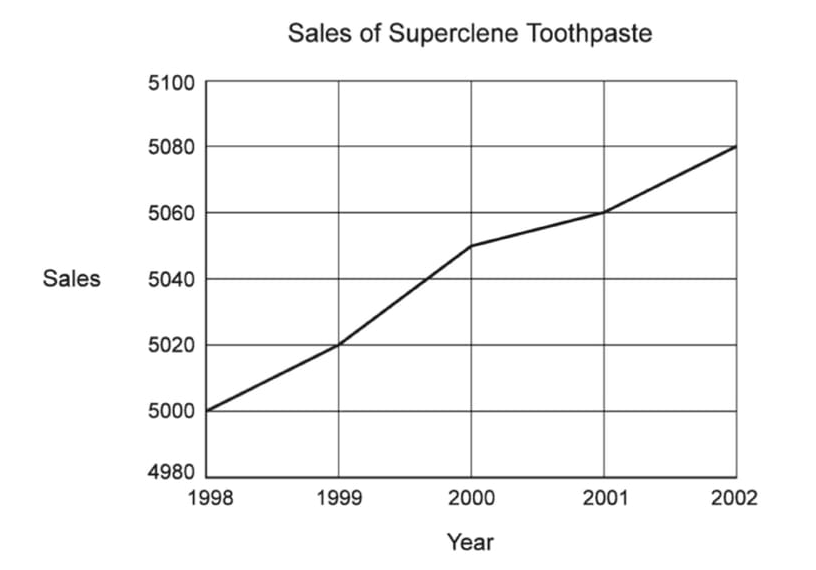
(i) The diagram represents the sales of Superclene toothpaste over the last few years. Give a reason why it is misleading.
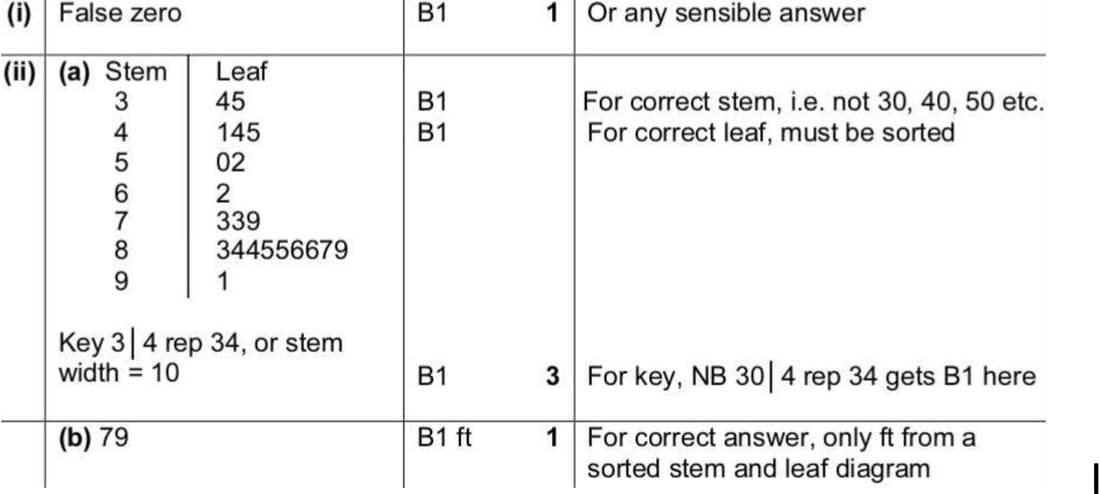
(ii) The following data represent the daily ticket sales at a small theatre during three weeks.
52, 73, 34, 85, 62, 79, 89, 50, 45, 83, 84, 91, 85, 84, 87, 44, 86, 41, 35, 73, 86.
(a) Construct a stem-and-leaf diagram to illustrate the data.
(b) Use your diagram to find the median of the data.
Nov 2022 p51 q3
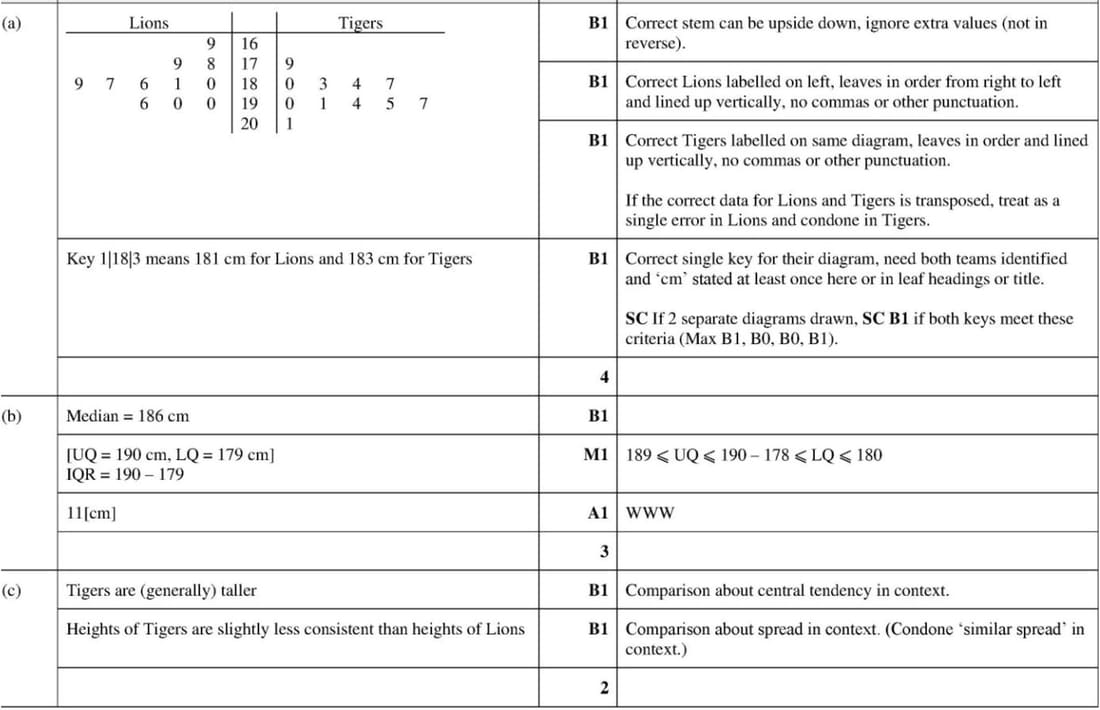
The Lions and the Tigers are two basketball clubs. The heights, in cm, of the 11 players in each of their first team squads are given in the table.
| Lions | 178 | 186 | 181 | 187 | 179 | 190 | 189 | 190 | 180 | 169 | 196 |
|---|---|---|---|---|---|---|---|---|---|---|---|
| Tigers | 194 | 179 | 187 | 190 | 183 | 201 | 184 | 180 | 195 | 191 | 197 |
- Draw a back-to-back stem-and-leaf diagram to represent this information, with the Lions on the left.
- Find the median and the interquartile range of the heights of the Lions first team squad.
- It is given that for the Tigers, the lower quartile is 183 cm, the median is 190 cm and the upper quartile is 195 cm.
- Make two comparisons between the heights of the players in the Lions first team squad and the heights of the players in the Tigers first team squad.
Nov 2021 p53 q2
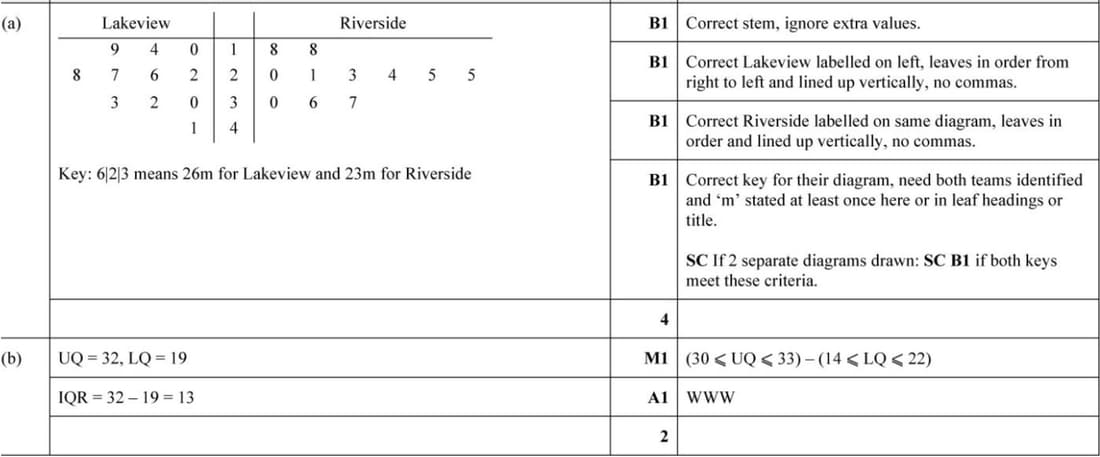
Lakeview and Riverside are two schools. The pupils at both schools took part in a competition to see how far they could throw a ball. The distances thrown, to the nearest metre, by 11 pupils from each school are shown in the following table.
| Lakeview | 10 | 14 | 19 | 22 | 26 | 27 | 28 | 30 | 32 | 33 | 41 |
|---|---|---|---|---|---|---|---|---|---|---|---|
| Riverside | 23 | 36 | 21 | 18 | 37 | 25 | 18 | 20 | 24 | 30 | 25 |
- Draw a back-to-back stem-and-leaf diagram to represent this information, with Lakeview on the left-hand side.
- Find the interquartile range of the distances thrown by the 11 pupils at Lakeview school.