Exam-Style Problems
⬅ Back to SubchapterNov 2021 p51 q6
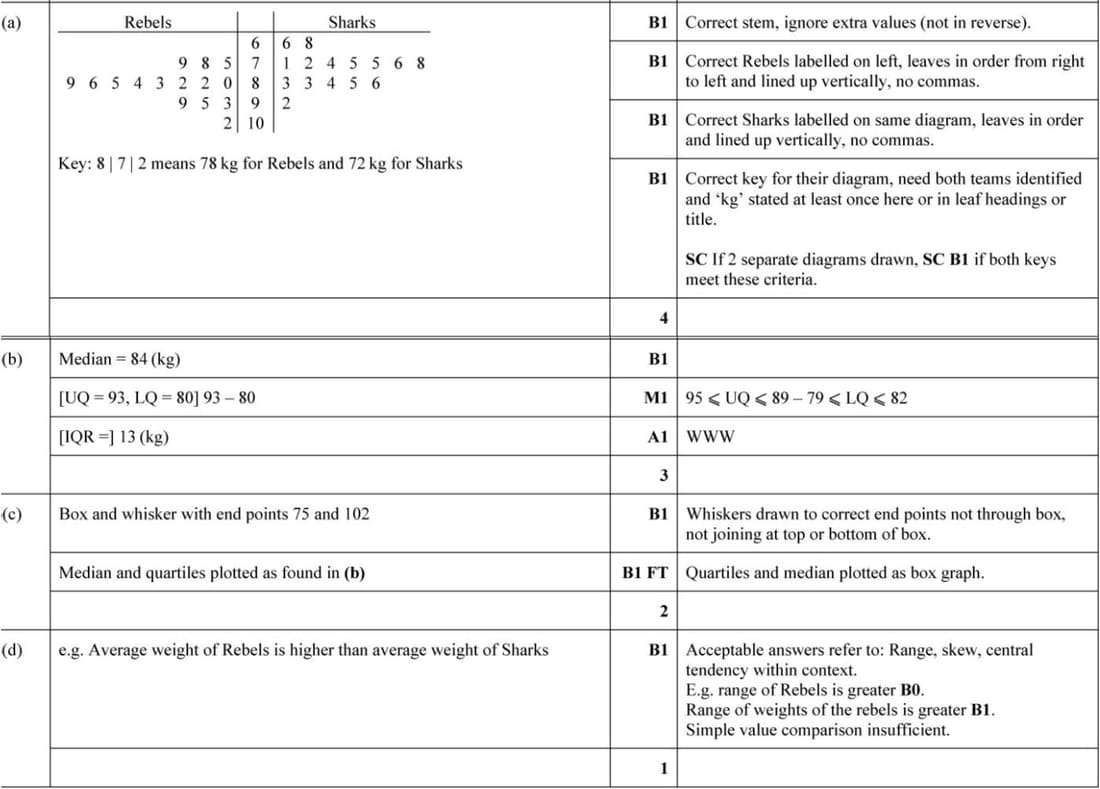
The weights, in kg, of 15 rugby players in the Rebels club and 15 soccer players in the Sharks club are shown below.
| Rebels | 75 | 78 | 79 | 80 | 82 | 82 | 83 | 84 | 85 | 86 | 89 | 93 | 95 | 99 | 102 |
| Sharks | 66 | 68 | 71 | 72 | 74 | 75 | 75 | 76 | 78 | 83 | 83 | 84 | 85 | 86 | 92 |
(a) Represent the data by drawing a back-to-back stem-and-leaf diagram with Rebels on the left-hand side of the diagram.
(b) Find the median and the interquartile range for the Rebels.
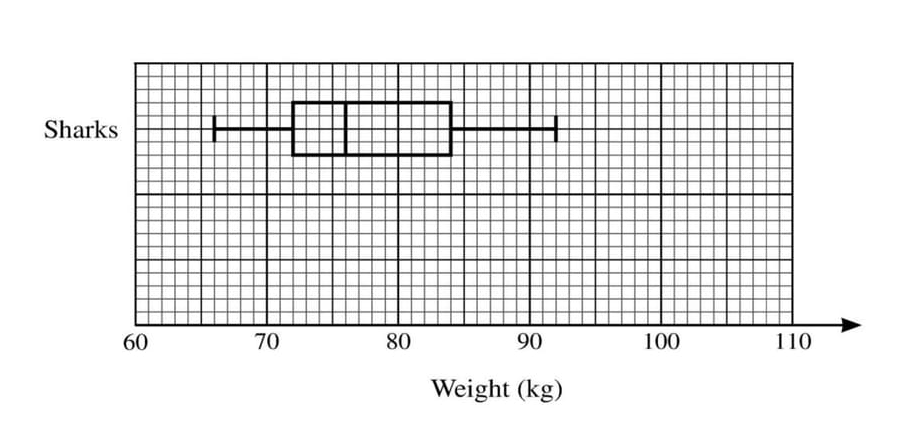
A box-and-whisker plot for the Sharks is shown below.
(c) On the same diagram, draw a box-and-whisker plot for the Rebels.
(d) Make one comparison between the weights of the players in the Rebels club and the weights of the players in the Sharks club.
June 2020 p52 q3
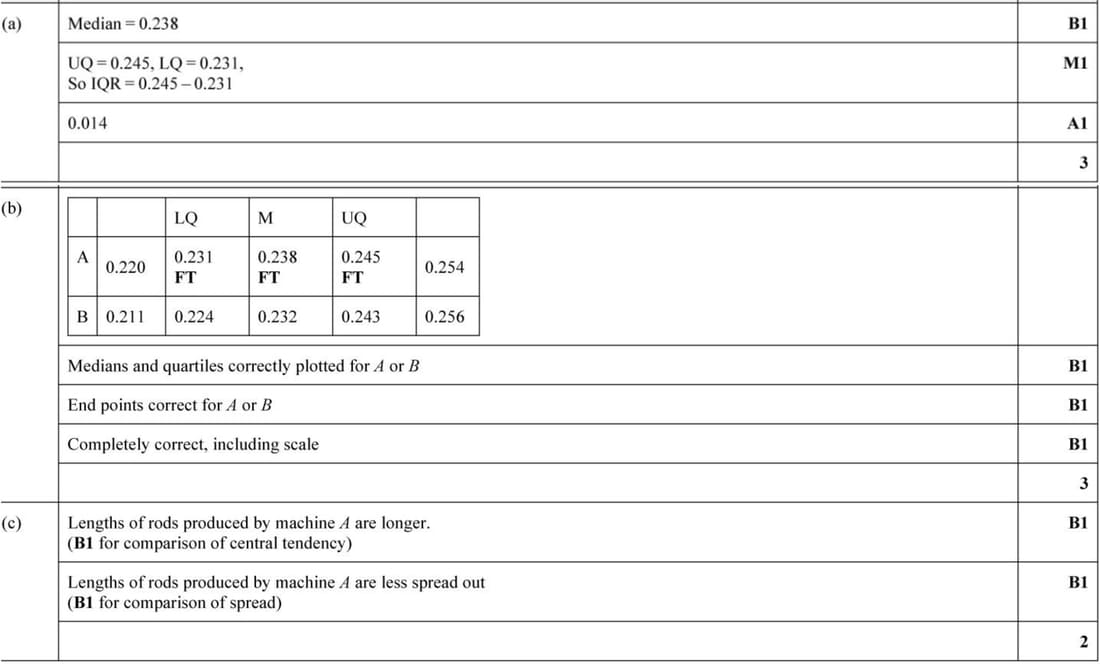
Two machines, A and B, produce metal rods of a certain type. The lengths, in metres, of 19 rods produced by machine A and 19 rods produced by machine B are shown in the following back-to-back stem-and-leaf diagram.
Stem-and-leaf diagram:
| A | B | |
|---|---|---|
| 21 | 1 2 4 | |
| 7 6 3 0 | 22 | 2 4 5 5 6 |
| 8 7 4 3 1 1 | 23 | 0 2 6 8 9 9 |
| 5 5 5 3 2 | 24 | 3 3 4 6 |
| 4 3 1 0 | 25 | 6 |
Key: 7 | 22 | 4 means 0.227 m for machine A and 0.224 m for machine B.
- Find the median and the interquartile range for machine A.
- It is given that for machine B the median is 0.232 m, the lower quartile is 0.224 m and the upper quartile is 0.243 m. Draw box-and-whisker plots for A and B.
- Hence make two comparisons between the lengths of the rods produced by machine A and those produced by machine B.
June 2019 p62 q6
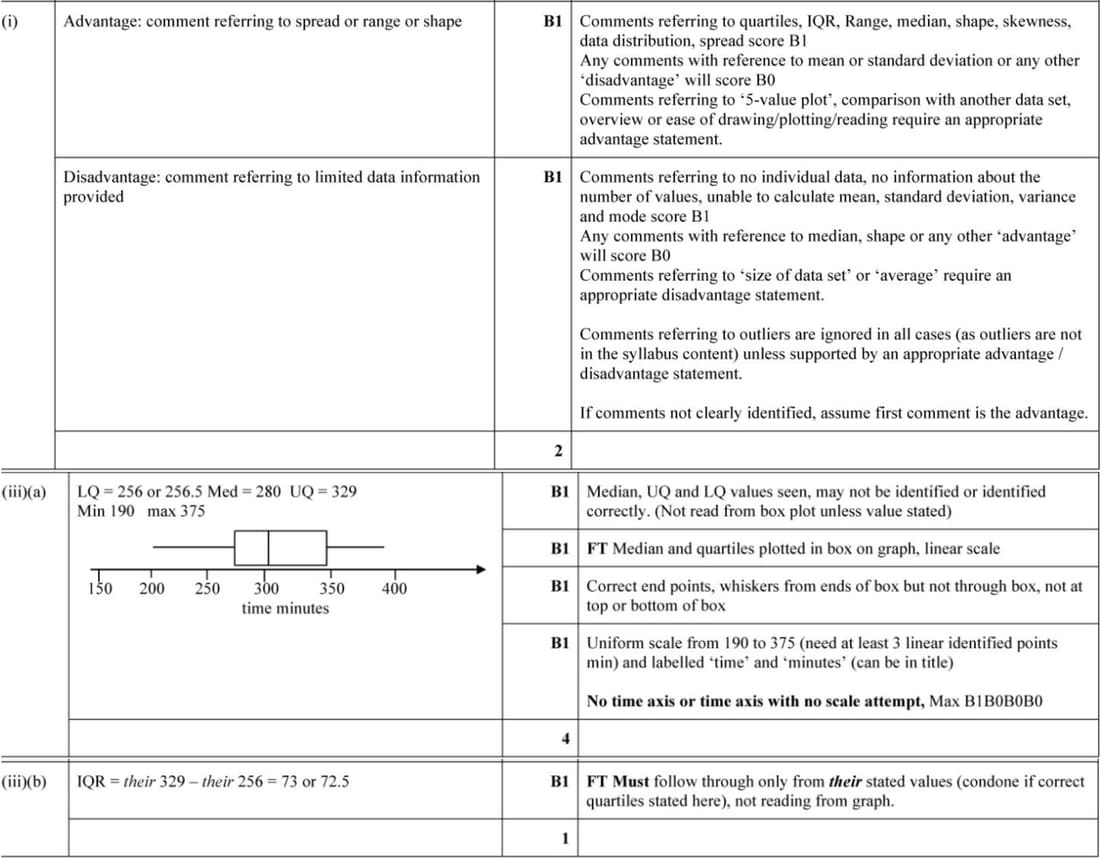
- Give one advantage and one disadvantage of using a box-and-whisker plot to represent a set of data.
- On the grid below, draw a box-and-whisker plot to illustrate the times for these 33 people.
- Find the interquartile range of these times.
Another group of 33 people ran the same marathon. Their times (in minutes) are:
| 190 | 203 | 215 | 246 | 249 | 253 | 255 | 254 | 258 | 260 | 261 |
| 263 | 267 | 269 | 274 | 276 | 280 | 288 | 283 | 287 | 294 | 300 |
| 307 | 318 | 327 | 331 | 336 | 345 | 351 | 353 | 360 | 368 | 375 |
June 2018 p61 q2
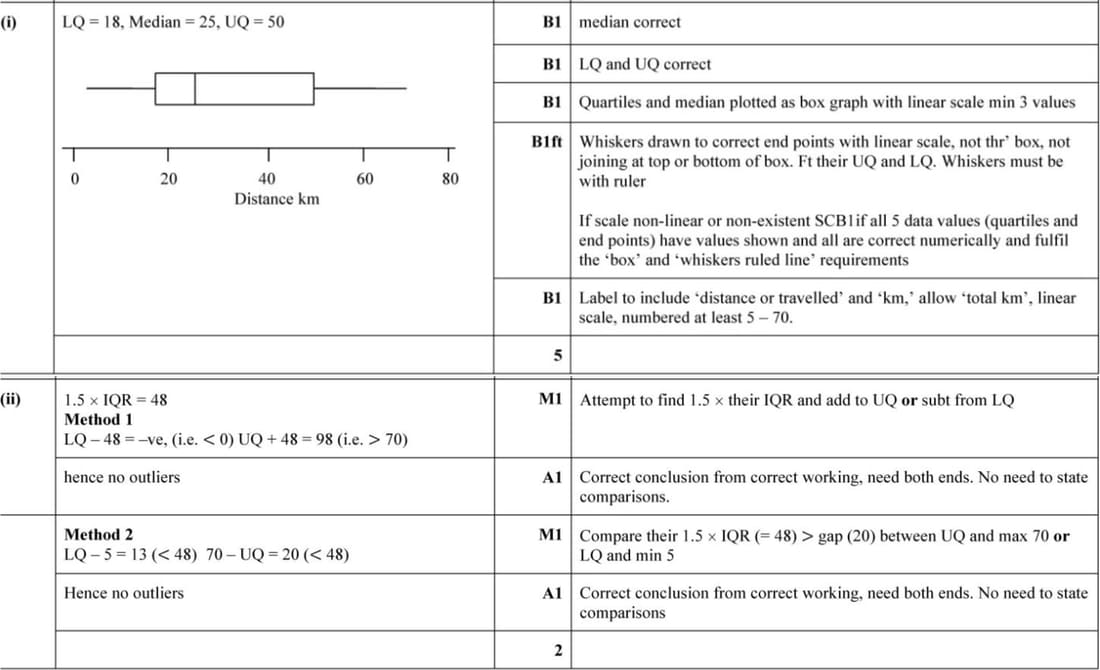
In a survey 55 students were asked to record, to the nearest kilometre, the total number of kilometres they travelled to school in a particular week. The results are shown below.
| 5 | 5 | 9 | 10 | 13 | 13 | 13 | 15 | 15 | 15 | 15 |
| 16 | 18 | 18 | 18 | 19 | 19 | 20 | 20 | 20 | 20 | 21 |
| 21 | 21 | 23 | 25 | 25 | 25 | 27 | 27 | 29 | 30 | 33 |
| 35 | 38 | 39 | 40 | 42 | 45 | 48 | 50 | 50 | 51 | 51 |
| 52 | 55 | 57 | 57 | 60 | 61 | 64 | 65 | 66 | 69 | 70 |
- On the grid, draw a box-and-whisker plot to illustrate the data.
- Show that there are no outliers.
Nov 2017 p63 q5
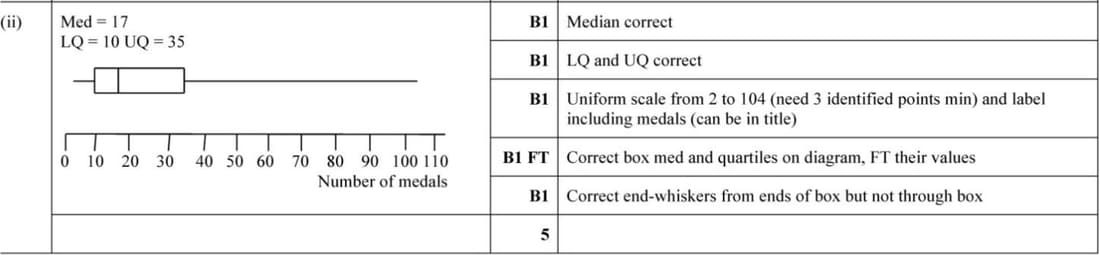
The number of Olympic medals won in the 2012 Olympic Games by the top \(27\) countries is shown below.
| 104 | 88 | 82 | 65 | 44 | 38 | 35 | 34 | 28 |
| 28 | 18 | 18 | 17 | 17 | 14 | 13 | 13 | 12 |
| 12 | 10 | 10 | 10 | 9 | 6 | 5 | 2 | 2 |
Find the median and quartiles of the data and draw a box-and-whisker plot on the grid.