Exam-Style Problems
⬅ Back to SubchapterJune 2010 p62 q1
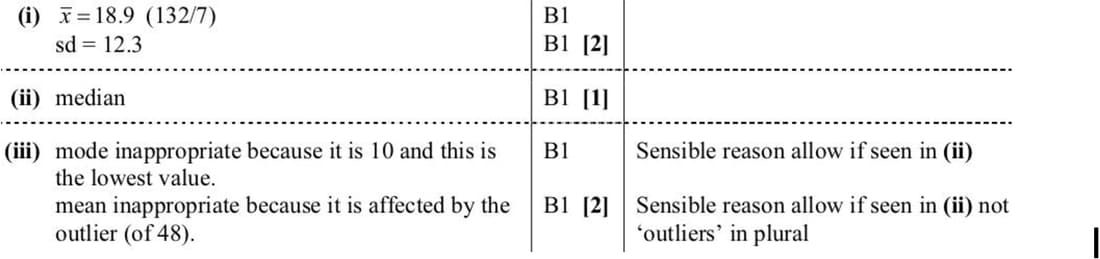
The times in minutes for seven students to become proficient at a new computer game were measured. The results are shown below.
15, 10, 48, 10, 19, 14, 16
- Find the mean and standard deviation of these times.
- State which of the mean, median or mode you consider would be most appropriate to use as a measure of central tendency to represent the data in this case.
- For each of the two measures of average you did not choose in part (ii), give a reason why you consider it inappropriate.
June 2010 p61 q4
The numbers of rides taken by two students, Fei and Graeme, at a fairground are shown in the following table.
| Roller coaster | Water slide | Revolving drum | |
|---|---|---|---|
| Fei | 4 | 2 | 0 |
| Graeme | 1 | 3 | 6 |
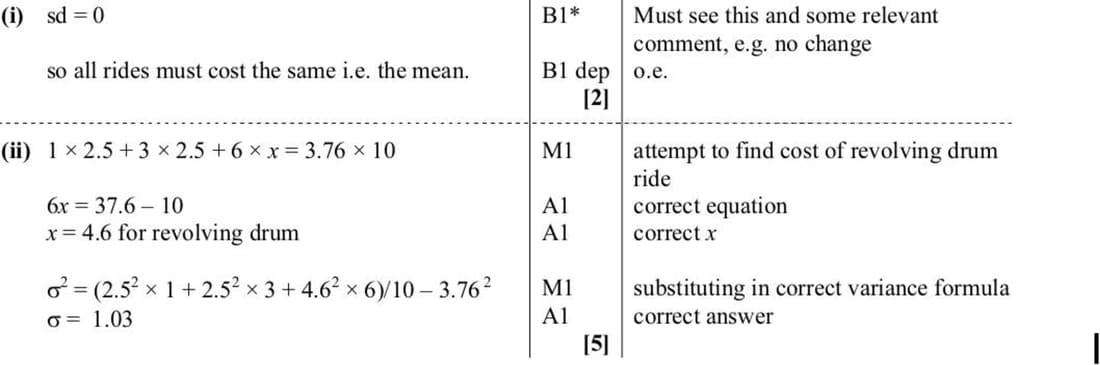
(i) The mean cost of Fei’s rides is $2.50 and the standard deviation of the costs of Fei’s rides is $0. Explain how you can tell that the roller coaster and the water slide each cost $2.50 per ride. [2]
(ii) The mean cost of Graeme’s rides is $3.76. Find the standard deviation of the costs of Graeme’s rides. [5]
Nov 2008 p6 q1
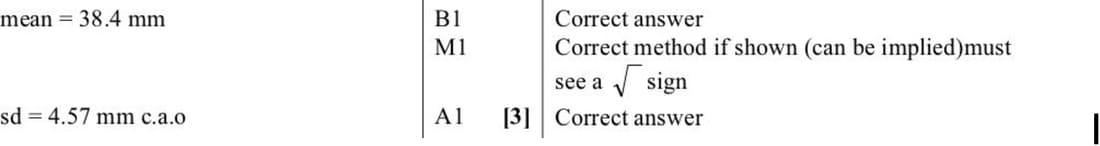
Rachel measured the lengths in millimetres of some of the leaves on a tree. Her results are recorded below.
32, 35, 45, 37, 38, 44, 33, 39, 36, 45
Find the mean and standard deviation of the lengths of these leaves.
June 2006 p6 q6
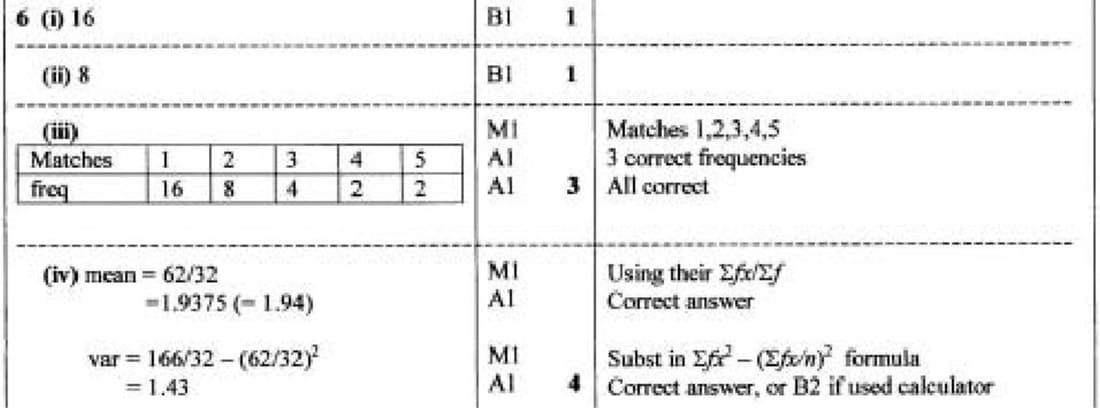
32 teams enter for a knockout competition, in which each match results in one team winning and the other team losing. After each match the winning team goes on to the next round, and the losing team takes no further part in the competition. Thus 16 teams play in the second round, 8 teams play in the third round, and so on, until 2 teams play in the final round.
- How many teams play in only 1 match?
- How many teams play in exactly 2 matches?
- Draw up a frequency table for the numbers of matches which the teams play.
- Calculate the mean and variance of the numbers of matches which the teams play.
June 2006 p6 q1
The salaries, in thousands of dollars, of 11 people, chosen at random in a certain office, were found to be:
40, 42, 45, 41, 352, 40, 50, 48, 51, 49, 47.
Choose and calculate an appropriate measure of central tendency (mean, mode or median) to summarise these salaries. Explain briefly why the other measures are not suitable.
