Exam-Style Problems
⬅ Back to SubchapterJune 2017 p62 q2
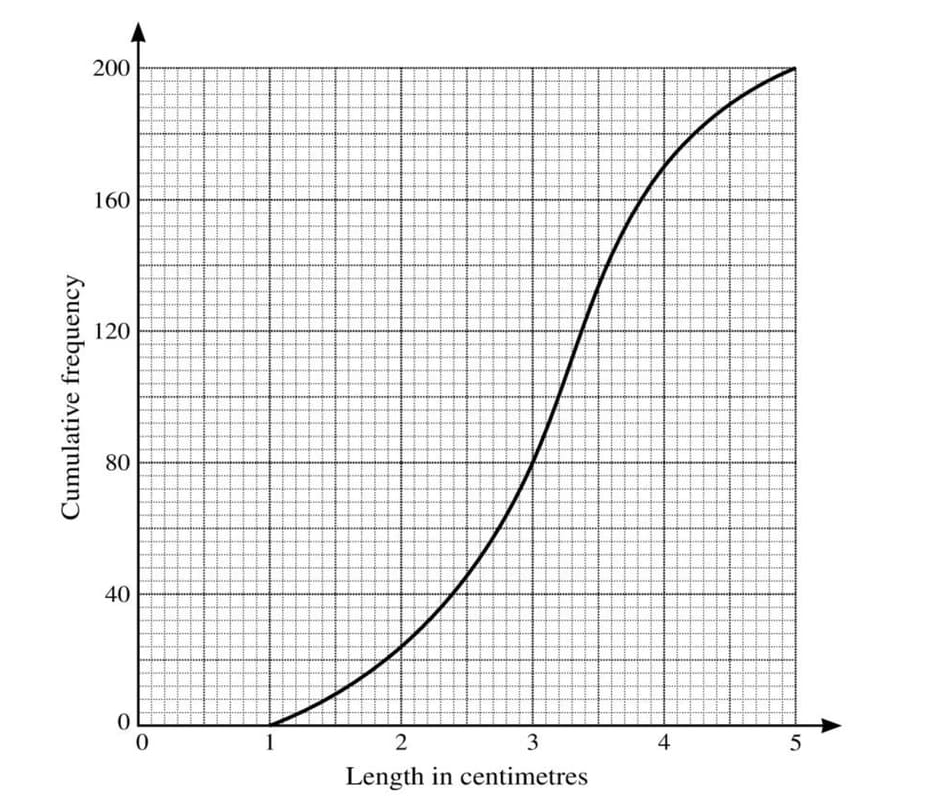
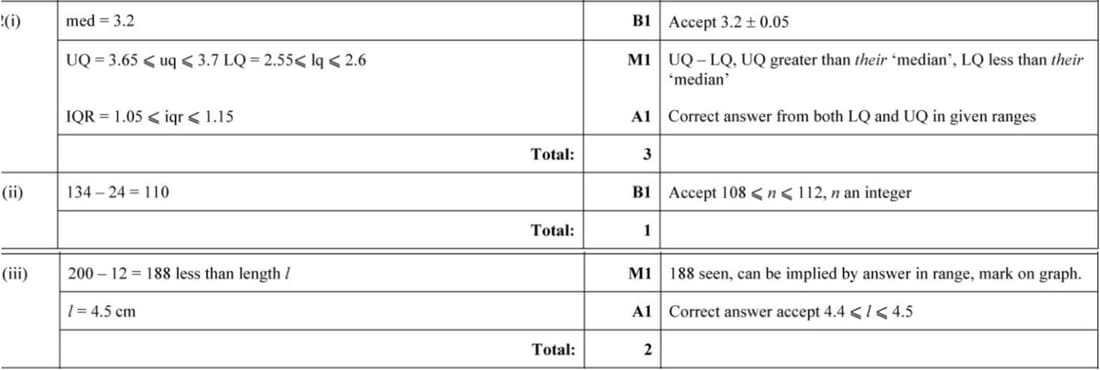
Anabel measured the lengths, in centimetres, of 200 caterpillars. Her results are illustrated in the cumulative frequency graph below.
(i) Estimate the median and the interquartile range of the lengths.
(ii) Estimate how many caterpillars had a length of between 2 and 3.5 cm.
(iii) 6% of caterpillars were of length \(l\) centimetres or more. Estimate \(l\).
Nov 2023 p51 q1
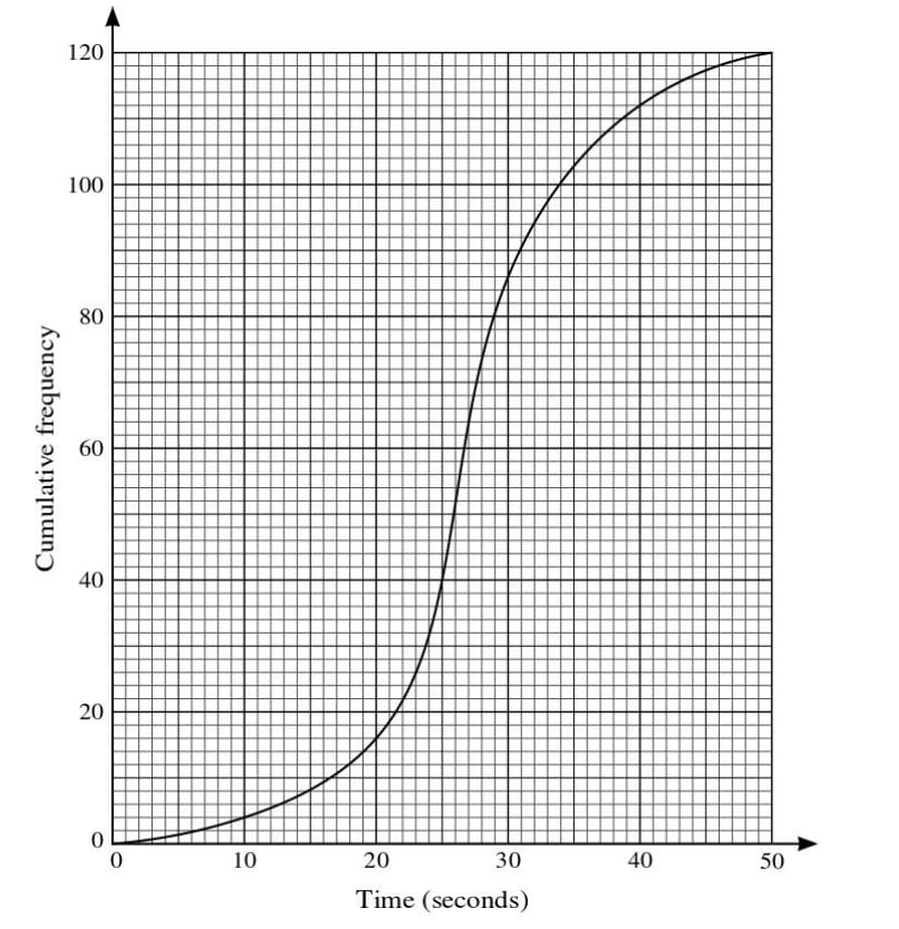
The times taken by 120 children to complete a particular puzzle are represented in the cumulative frequency graph.
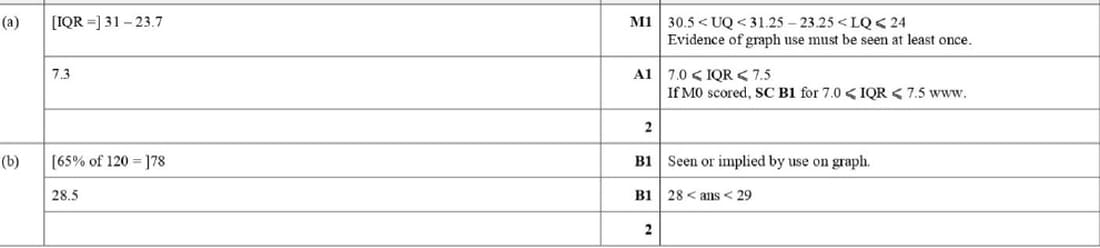
(a) Use the graph to estimate the interquartile range of the data.
35% of the children took longer than \(T\) seconds to complete the puzzle.
(b) Use the graph to estimate the value of \(T\).
Nov 2016 p63 q5
The tables summarise the heights, \(h\) (cm), of 60 girls and 60 boys.
| Height of girls (cm) | \(140 < h \le 150\) | \(150 < h \le 160\) | \(160 < h \le 170\) | \(170 < h \le 180\) | \(180 < h \le 190\) |
|---|---|---|---|---|---|
| Frequency | 12 | 21 | 17 | 10 | 0 |
| Height of boys (cm) | \(140 < h \le 150\) | \(150 < h \le 160\) | \(160 < h \le 170\) | \(170 < h \le 180\) | \(180 < h \le 190\) |
|---|---|---|---|---|---|
| Frequency | 0 | 20 | 23 | 12 | 5 |
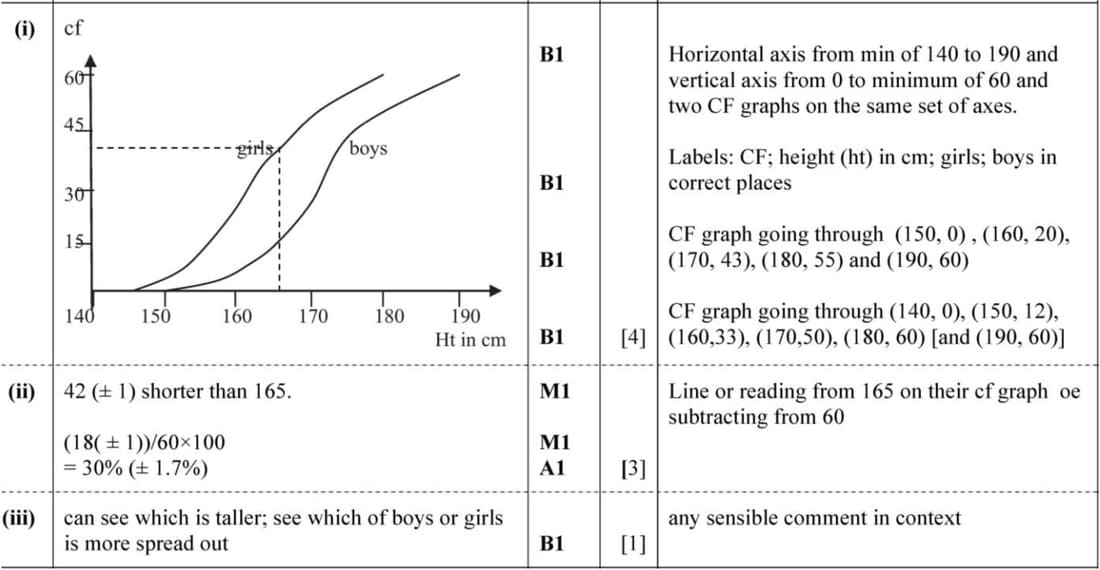
- On graph paper, using the same axes, draw two cumulative frequency graphs to illustrate the data.
- The cave on the school trip is \(165\ \text{cm}\) high. Use your graph to estimate the percentage of girls who will be unable to stand upright.
- State one advantage of using a pair of box-and-whisker plots rather than cumulative frequency graphs to compare the heights of the girls and the boys.
June 2016 p61 q7
The amounts spent by 160 shoppers at a supermarket are summarised in the following table.
| Amount spent \((x)\) | \(0 < x \le 30\) | \(30 < x \le 50\) | \(50 < x \le 70\) | \(70 < x \le 90\) | \(90 < x \le 140\) |
|---|---|---|---|---|---|
| Number of shoppers | 16 | 40 | 48 | 26 | 30 |
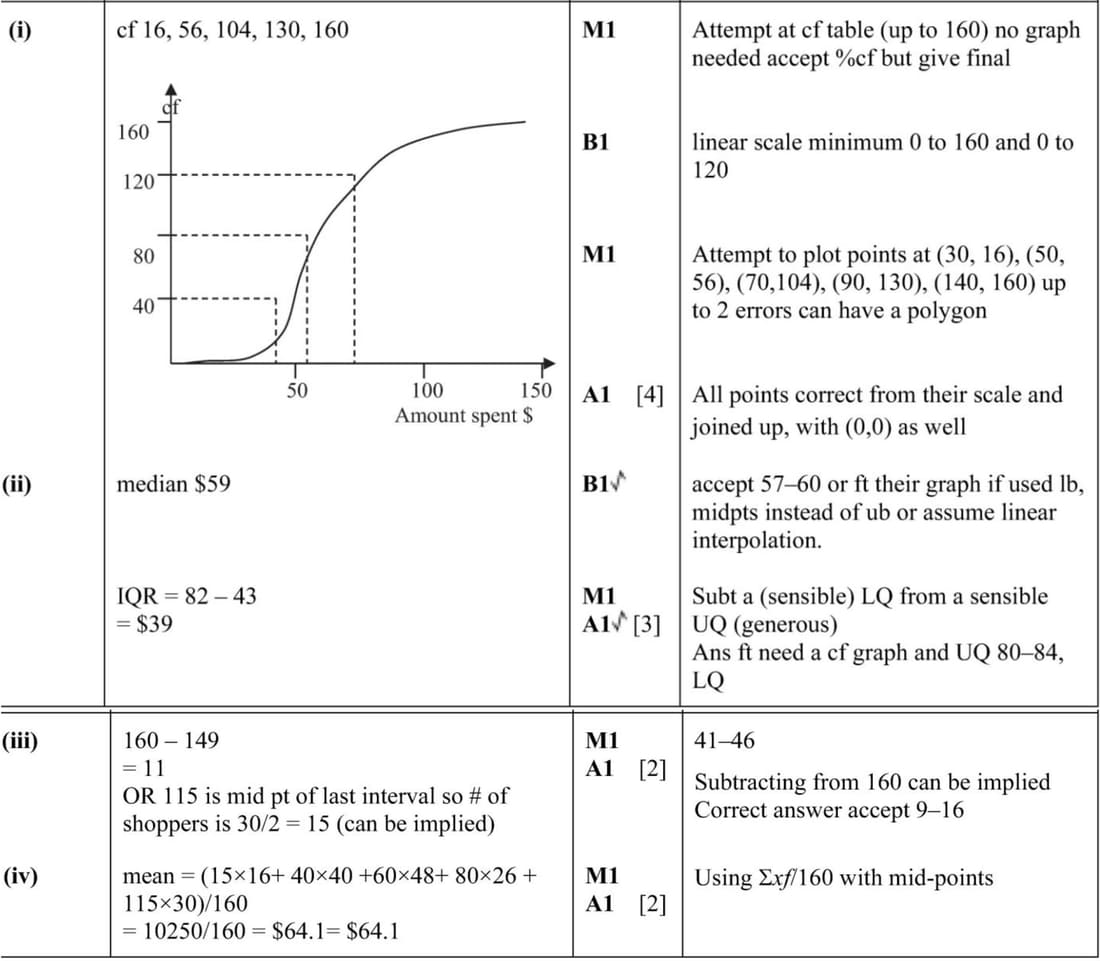
- Draw a cumulative frequency graph of this distribution.
- Estimate the median and the interquartile range of the amount spent.
- Estimate the number of shoppers who spent more than \(\$115\).
- Calculate an estimate of the mean amount spent.
June 2015 p63 q6
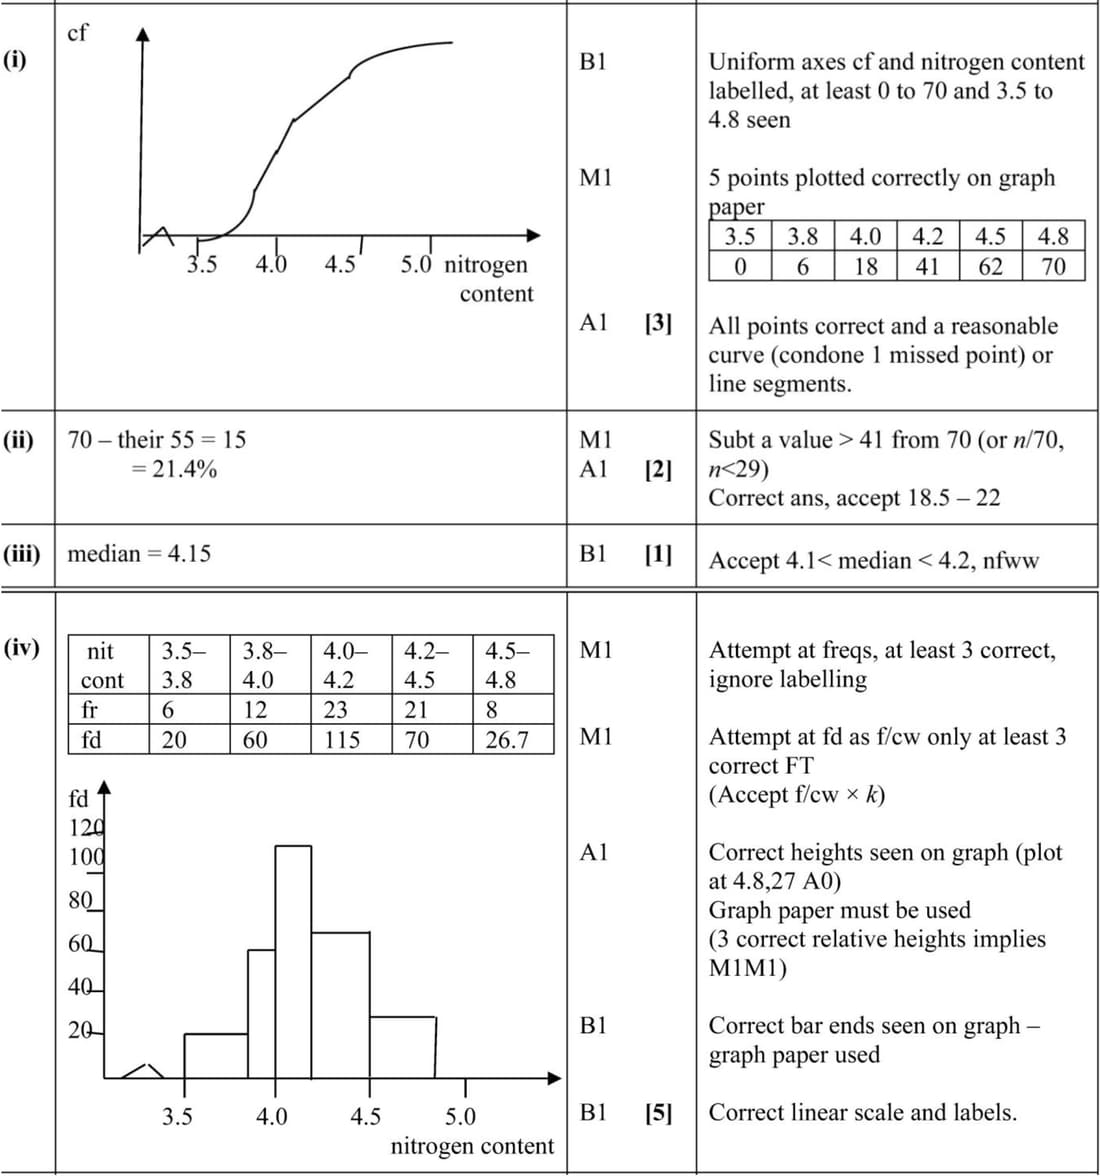
Seventy samples of fertiliser were collected and the nitrogen content was measured for each sample. The cumulative frequency distribution is shown below.
| Nitrogen content | \(\le 3.5\) | \(\le 3.8\) | \(\le 4.0\) | \(\le 4.2\) | \(\le 4.5\) | \(\le 4.8\) |
|---|---|---|---|---|---|---|
| Cumulative frequency | 0 | 6 | 18 | 41 | 62 | 70 |
- On graph paper, draw a cumulative frequency graph to represent the data.
- Estimate the percentage of samples with a nitrogen content greater than \(4.4\).
- Estimate the median.
- Construct a frequency table for these results and draw a histogram on graph paper.