Exam-Style Problems
⬅ Back to SubchapterJune 2014 p62 q6
2398
The times taken by 57 athletes to run 100 metres are summarised in the following cumulative frequency table.
| Time (seconds) | <10.0 | <10.5 | <11.0 | <12.0 | <12.5 | <13.5 |
|---|---|---|---|---|---|---|
| Cumulative frequency | 0 | 4 | 10 | 40 | 49 | 57 |
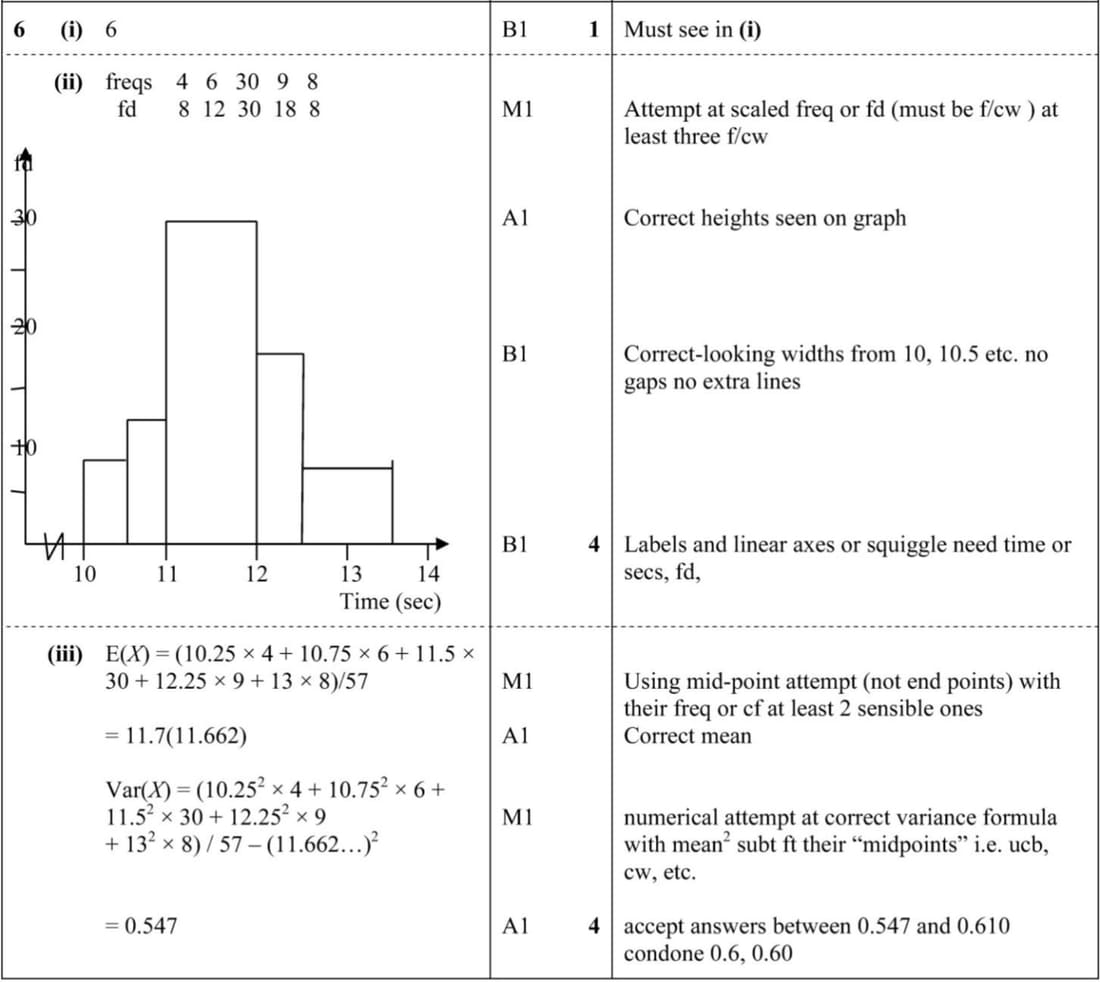
- State how many athletes ran 100 metres in a time between 10.5 and 11.0 seconds.
- Draw a histogram on graph paper to represent the times taken by these athletes to run 100 metres.
- Calculate estimates of the mean and variance of the times taken by these athletes.
June 2023 p51 q5
2399
The populations of 150 villages in the UK, to the nearest hundred, are summarised in the table.
| Population | 100–800 | 900–1200 | 1300–2000 | 2100–3200 | 3300–4800 |
|---|---|---|---|---|---|
| Number of villages | 8 | 12 | 50 | 48 | 32 |
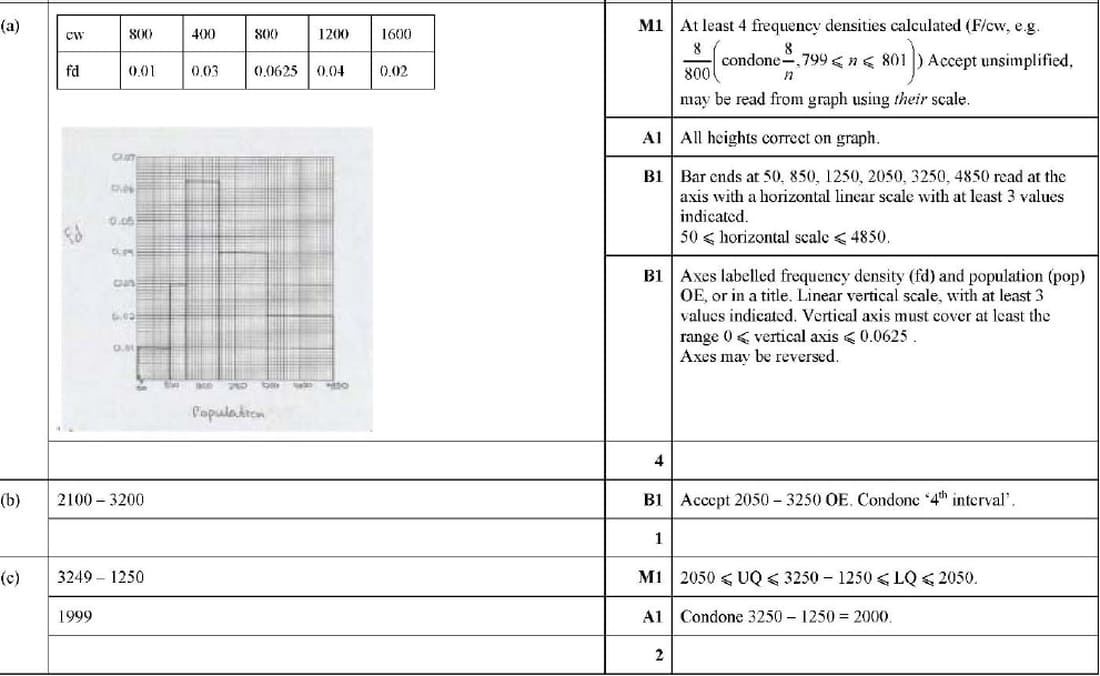
(a) Draw a histogram to represent this information.
(b) Write down the class interval which contains the median for this information.
(c) Find the greatest possible value of the interquartile range for the populations of the 150 villages.
June 2014 p61 q7
2400
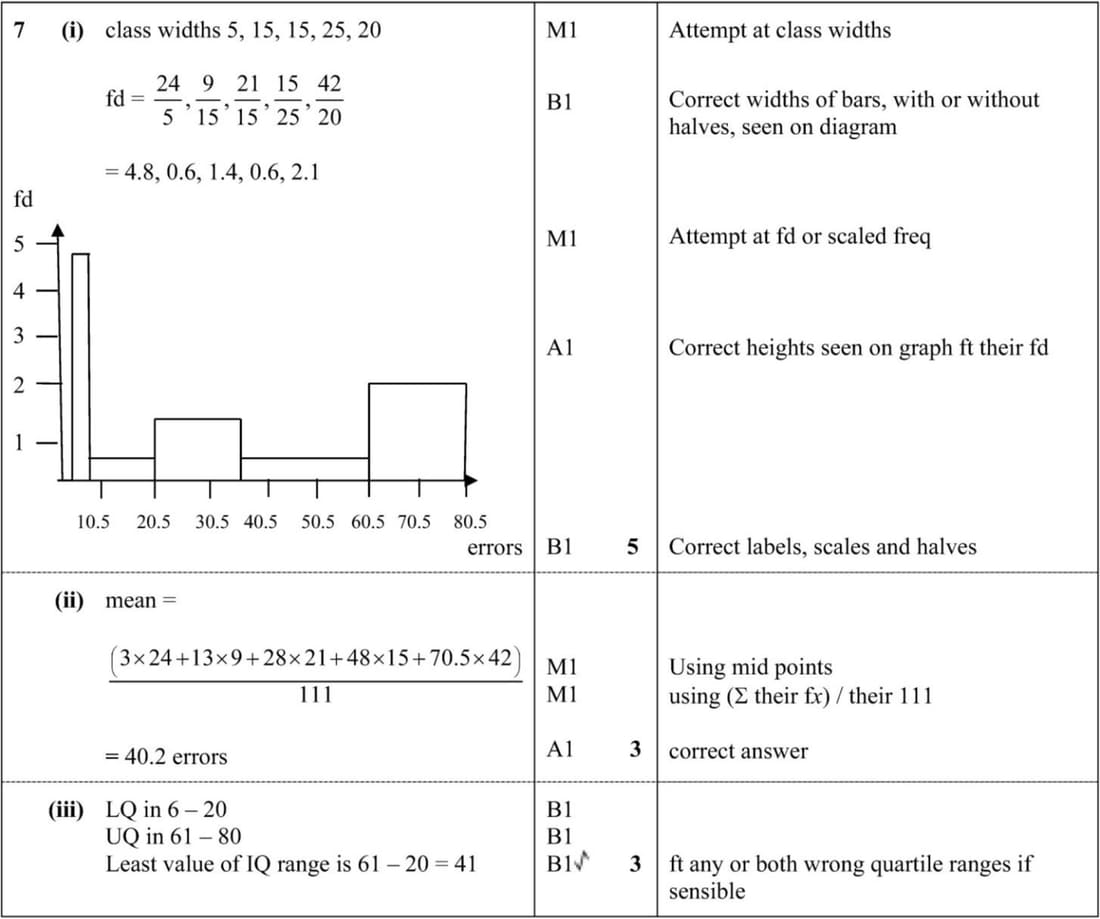
A typing test is taken by 111 people. The numbers of typing errors they make in the test are summarised in the table below.
| Number of typing errors | 1–5 | 6–20 | 21–35 | 36–60 | 61–80 |
|---|---|---|---|---|---|
| Frequency | 24 | 9 | 21 | 15 | 42 |
- Draw a histogram on graph paper to represent this information.
- Calculate an estimate of the mean number of typing errors for these 111 people.
- State which class contains the lower quartile and which class contains the upper quartile. Hence find the least possible value of the interquartile range.
Nov 2013 p63 q1
2401
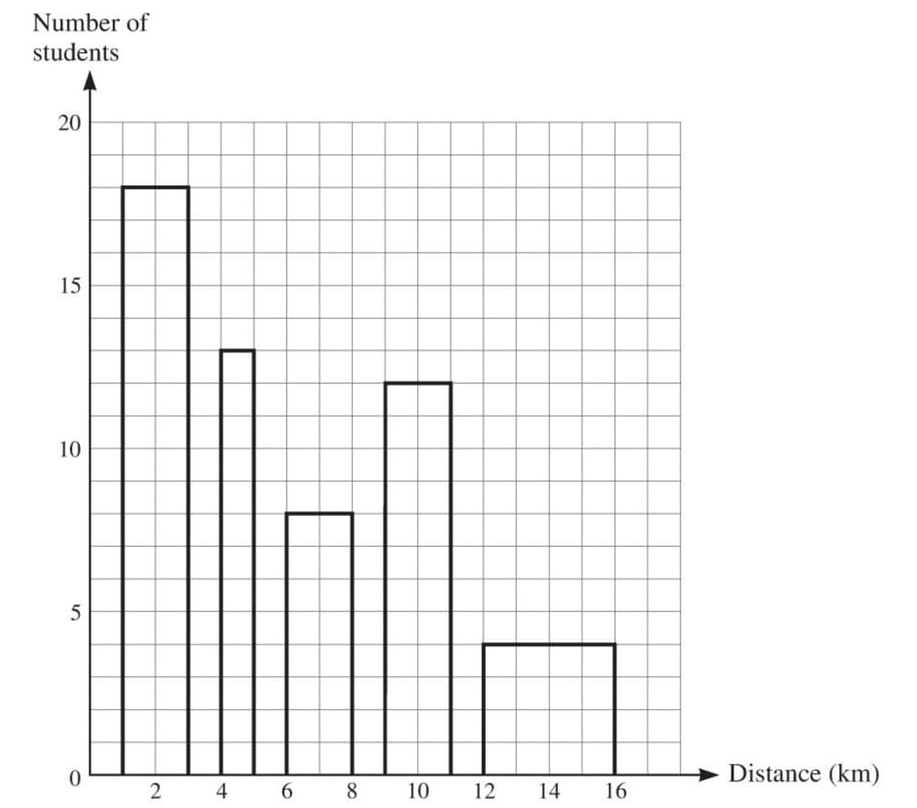
The distance of a student’s home from college, correct to the nearest kilometre, was recorded for each of 55 students. The distances are summarised in the following table.
| Distance from college (km) | 1–3 | 4–5 | 6–8 | 9–11 | 12–16 |
|---|---|---|---|---|---|
| Number of students | 18 | 13 | 8 | 12 | 4 |
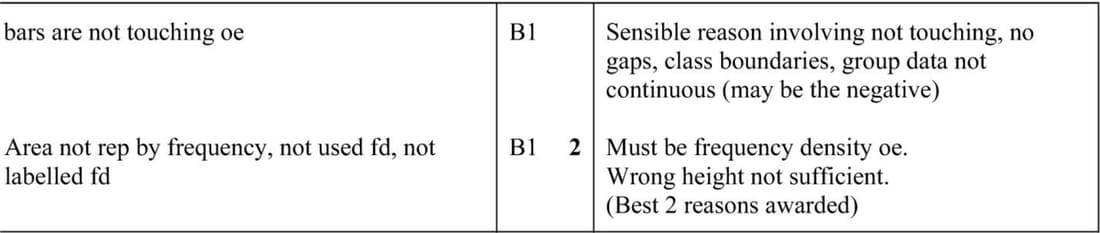
Dominic is asked to draw a histogram to illustrate the data. Dominic’s diagram is shown below.
Give two reasons why this is not a correct histogram.
Nov 2013 p62 q4
2402
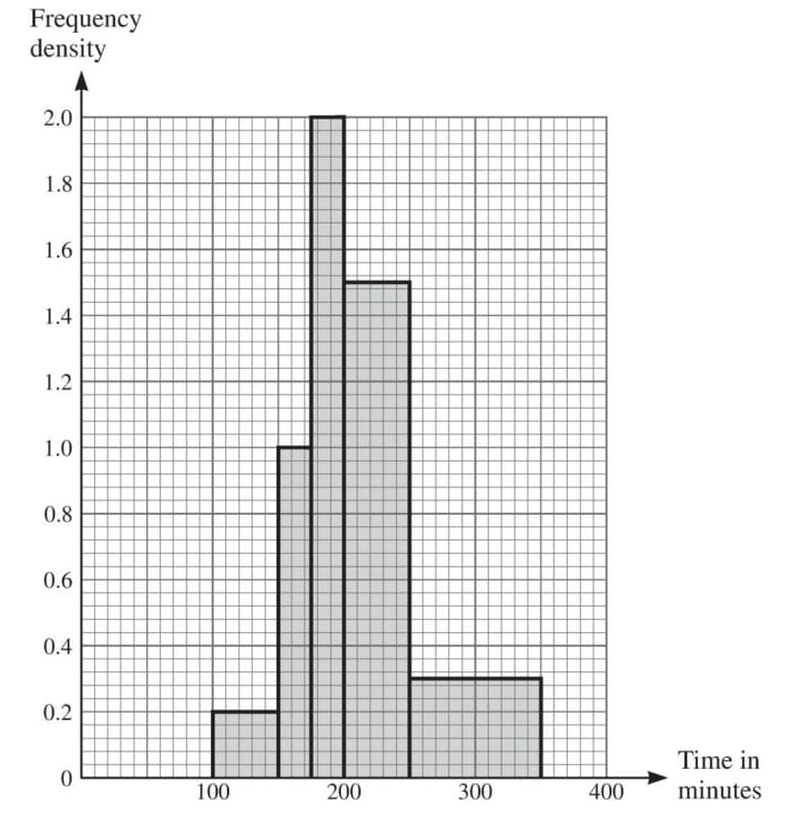
The following histogram summarises the times, in minutes, taken by 190 people to complete a race.
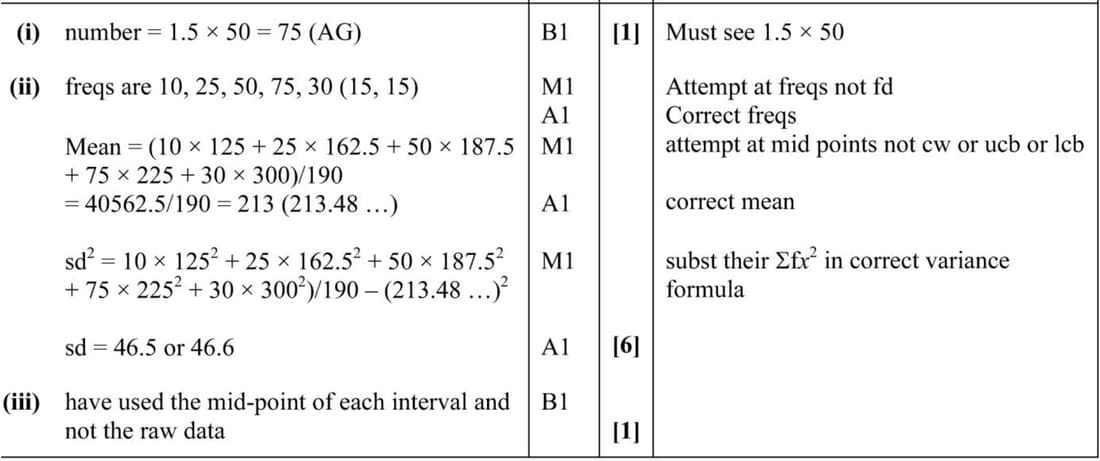
(i) Show that 75 people took between 200 and 250 minutes to complete the race.
(ii) Calculate estimates of the mean and standard deviation of the times of the 190 people.
(iii) Explain why your answers to part (ii) are estimates.