Exam-Style Problems
⬅ Back to SubchapterJune 2012 p61 q5
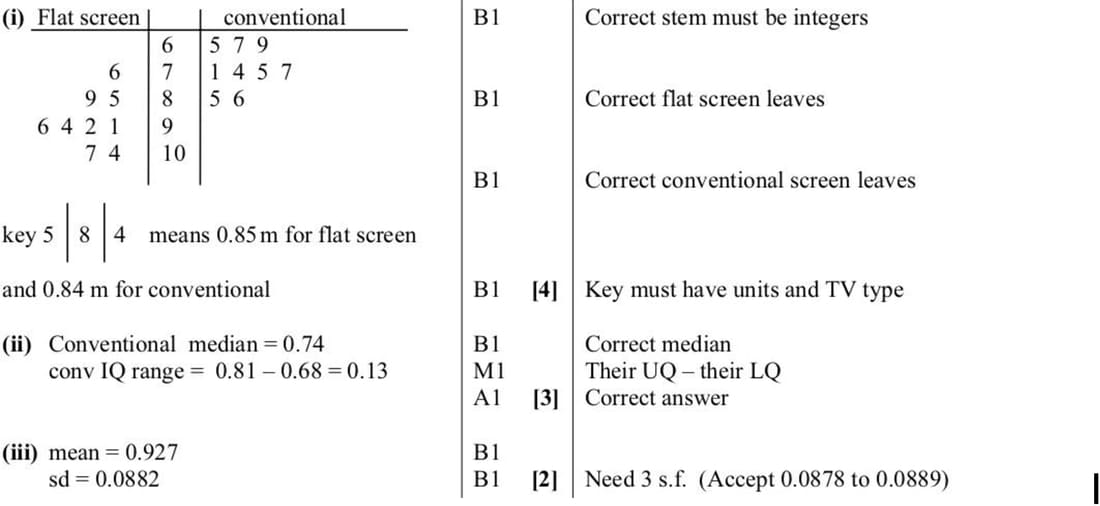
The lengths of the diagonals in metres of the 9 most popular flat screen TVs and the 9 most popular conventional TVs are shown below.
Flat screen: 0.85, 0.94, 0.91, 0.96, 1.04, 0.89, 1.07, 0.92, 0.76
Conventional: 0.69, 0.65, 0.85, 0.77, 0.74, 0.67, 0.71, 0.86, 0.75
- Represent this information on a back-to-back stem-and-leaf diagram.
- Find the median and the interquartile range of the lengths of the diagonals of the 9 conventional TVs.
- Find the mean and standard deviation of the lengths of the diagonals of the 9 flat screen TVs.
June 2023 p53 q4
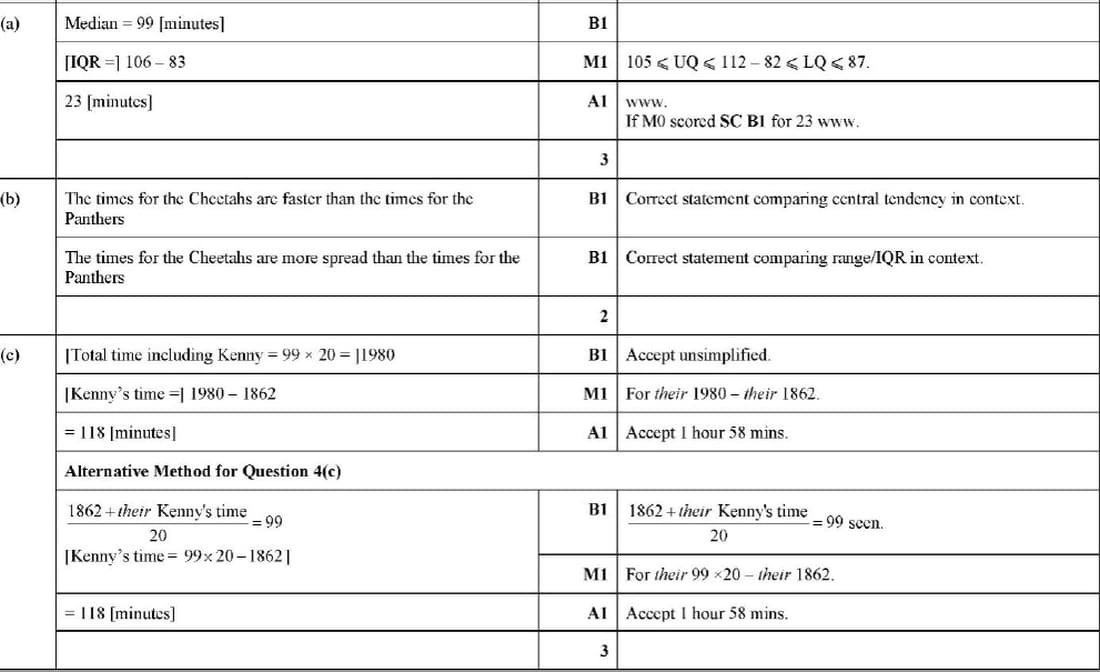
The times taken, in minutes, to complete a cycle race by 19 cyclists from each of two clubs, the Cheetahs and the Panthers, are represented in the following back-to-back stem-and-leaf diagram.
| Cheetahs | Panthers | |
|---|---|---|
| 9 8 | 7 | 4 |
| 8 7 3 2 0 | 8 | 6 8 |
| 9 8 7 | 9 | 1 7 8 8 9 9 |
| 6 5 3 3 | 10 | 2 3 4 4 5 6 |
| 9 8 2 | 11 | 1 2 8 |
| 4 | 12 | 0 6 |
Key: \( 7 \mid 9 \mid 1 \) means 97 minutes for Cheetahs and 91 minutes for Panthers.
(a) Find the median and the interquartile range of the times of the Cheetahs.
The median and interquartile range for the Panthers are 103 minutes and 14 minutes respectively.
(b) Make two comparisons between the times taken by the Cheetahs and the times taken by the Panthers.
Another cyclist, Kenny, from the Cheetahs also took part in the race. The mean time taken by the 20 cyclists from the Cheetahs was 99 minutes.
(c) Find the time taken by Kenny to complete the race.
Nov 2010 p62 q4
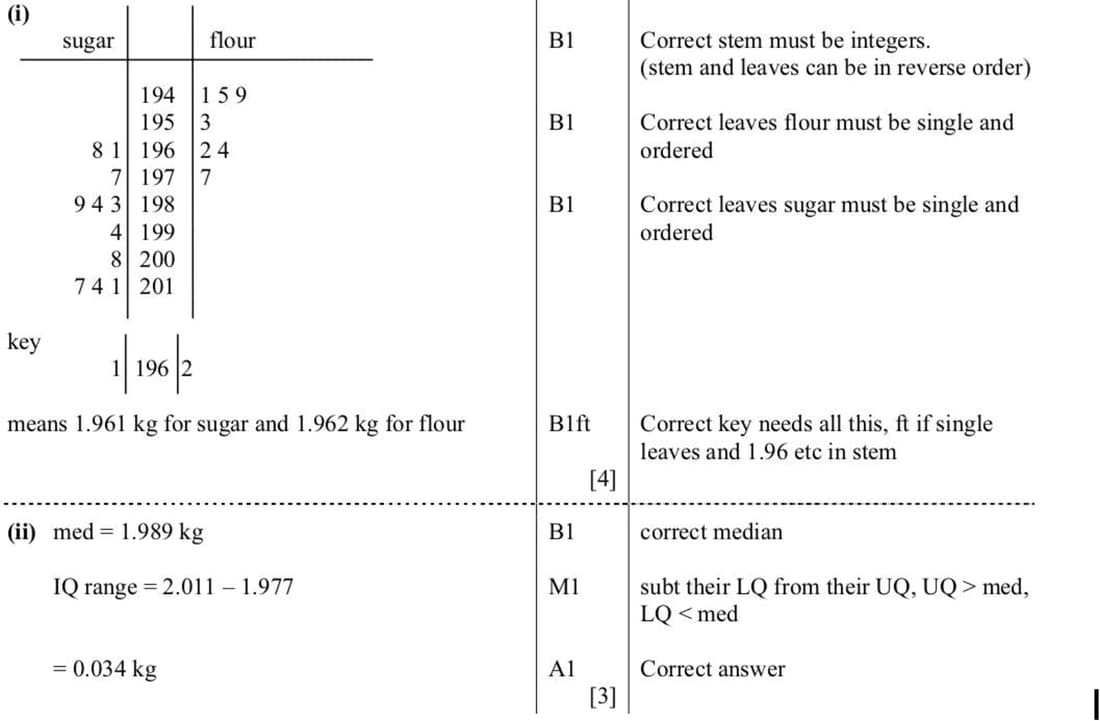
The weights in kilograms of 11 bags of sugar and 7 bags of flour are as follows:
Sugar: 1.961, 1.983, 2.008, 2.014, 1.968, 1.994, 2.011, 2.017, 1.977, 1.984, 1.989
Flour: 1.945, 1.962, 1.949, 1.977, 1.964, 1.941, 1.953
(i) Represent this information on a back-to-back stem-and-leaf diagram with sugar on the left-hand side.
(ii) Find the median and interquartile range of the weights of the bags of sugar.
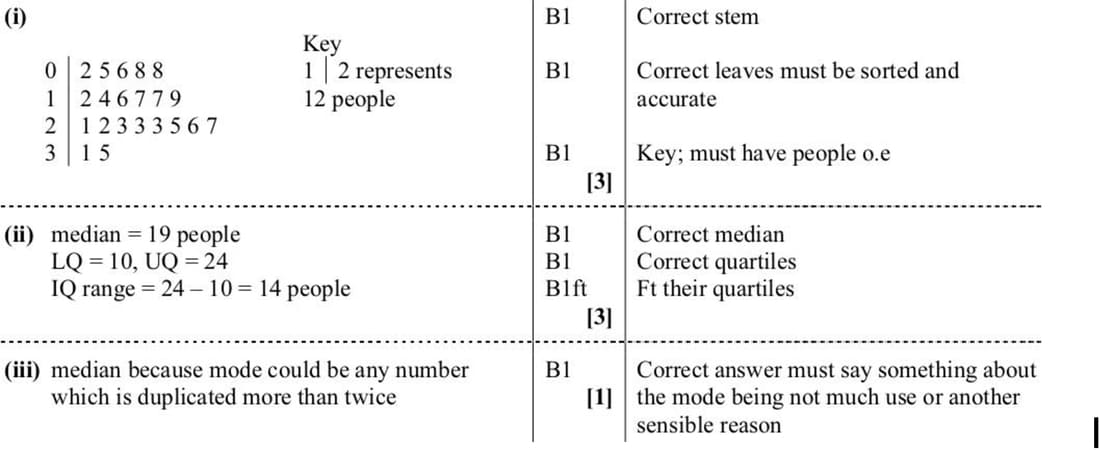
June 2010 p61 q2
The numbers of people travelling on a certain bus at different times of the day are as follows.
17, 5, 2, 23, 16, 31, 8, 22, 14, 25, 35, 17, 27, 12, 6, 23, 19, 21, 23, 8, 26
(i) Draw a stem-and-leaf diagram to illustrate the information given above. [3]
(ii) Find the median, the lower quartile, the upper quartile and the interquartile range. [3]
(iii) State, in this case, which of the median and mode is preferable as a measure of central tendency, and why. [1]
Nov 2008 p6 q5
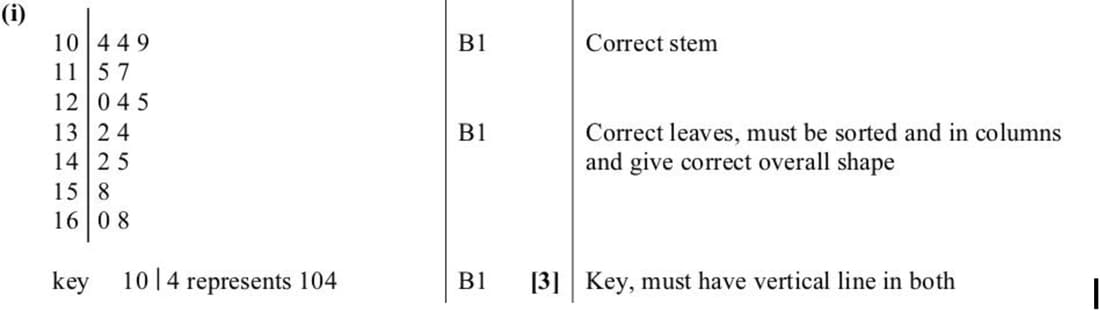
The pulse rates, in beats per minute, of a random sample of 15 small animals are shown in the following table.
115, 120, 158, 132, 125, 104, 142, 160, 145, 104, 162, 117, 109, 124, 134
Draw a stem-and-leaf diagram to represent the data.