Exam-Style Problems
⬅ Back to SubchapterJune 2023 p41 q4
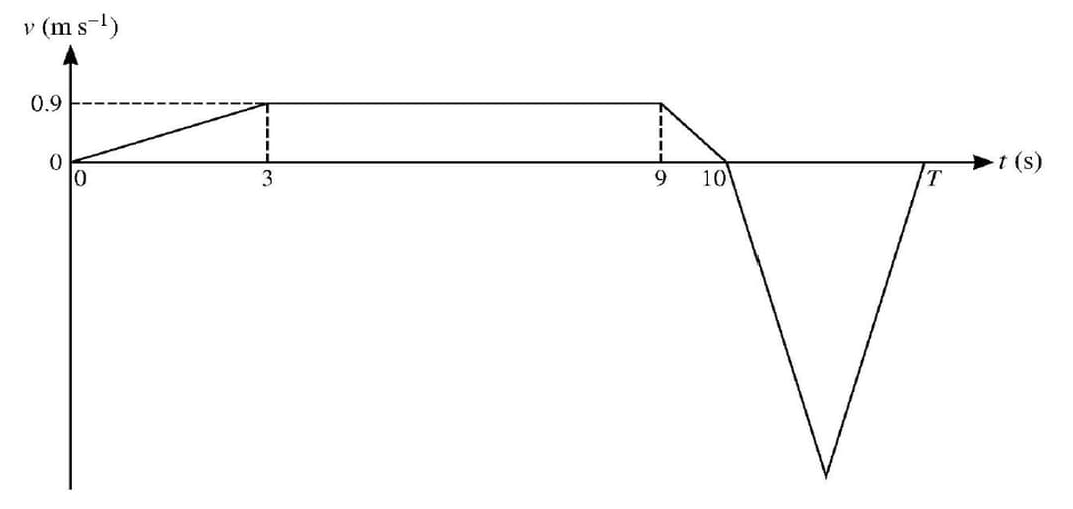
The velocity of a particle at time t s after leaving a fixed point O is v m s-1. The diagram shows a velocity-time graph which models the motion of the particle. The graph consists of 5 straight line segments. The particle accelerates to a speed of 0.9 m s-1 in a period of 3 s, then travels at constant speed for 6 s, and then comes instantaneously to rest 1 s later. The particle then moves back and returns to rest at O at time T s.
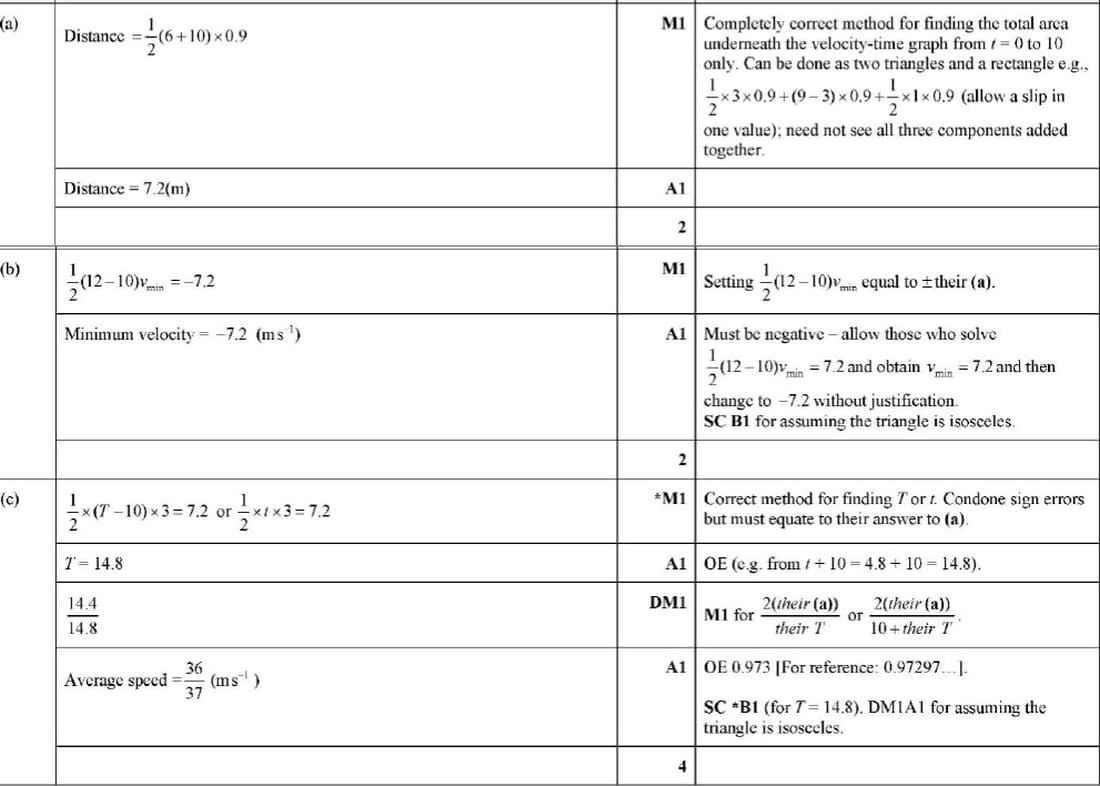
- Find the distance travelled by the particle in the first 10 s of its motion.
- Given that T = 12, find the minimum velocity of the particle.
- Given instead that the greatest speed of the particle is 3 m s-1, find the value of T and hence find the average speed of the particle for the whole of the motion.
June 2022 p43 q3
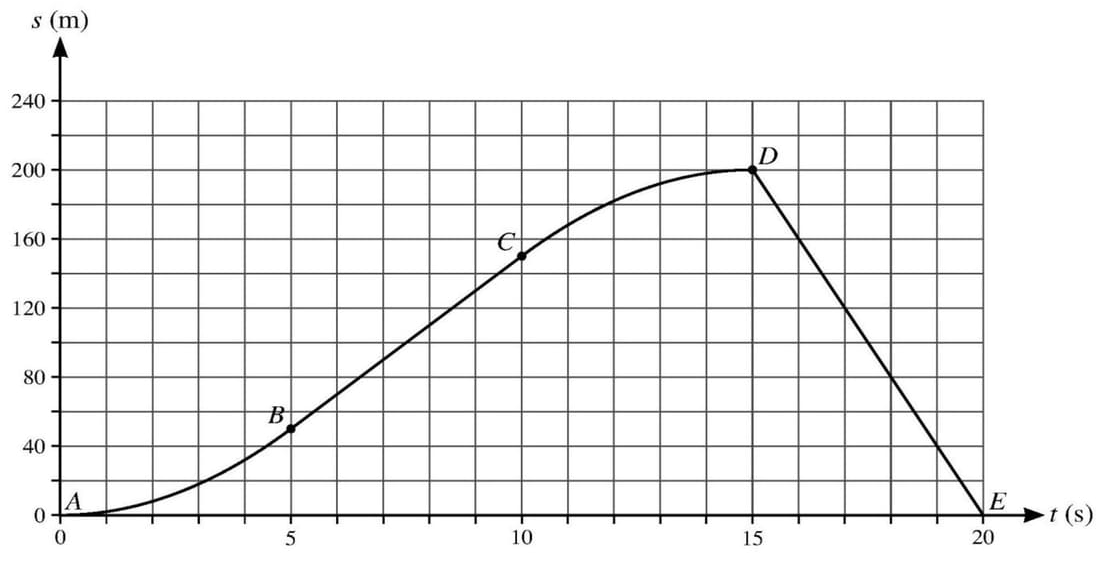
The displacement of a particle moving in a straight line is s metres at time t seconds after leaving a fixed point O. The particle starts from rest and passes through points P, Q and R, at times t = 5, t = 10 and t = 15 respectively, and returns to O at time t = 20. The distances OP, OQ and OR are 50 m, 150 m and 200 m respectively.
The diagram shows a displacement-time graph which models the motion of the particle from t = 0 to t = 20. The graph consists of two curved segments AB and CD and two straight line segments BC and DE.
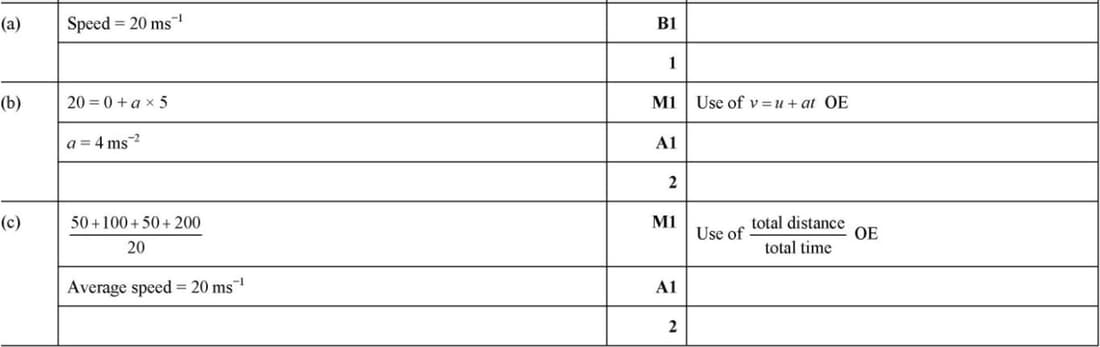
- Find the speed of the particle between t = 5 and t = 10.
- Find the acceleration of the particle between t = 0 and t = 5, given that it is constant.
- Find the average speed of the particle during its motion.
Nov 2021 p42 q1
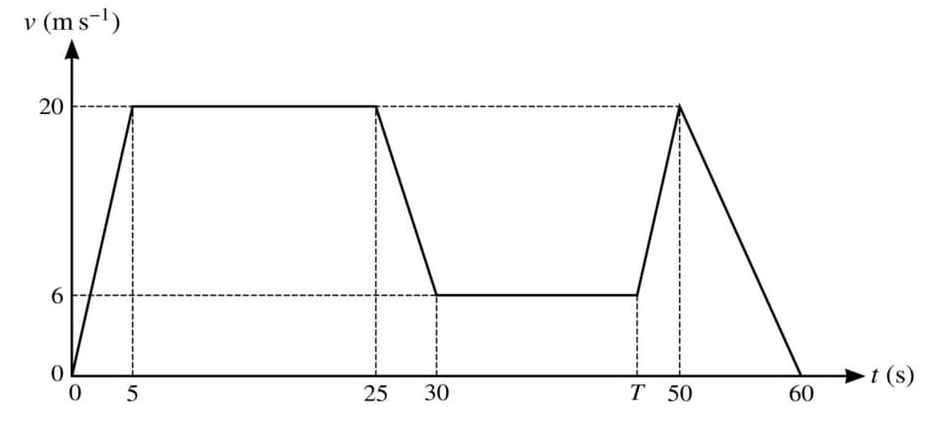
The diagram shows a velocity-time graph which models the motion of a car. The graph consists of six straight line segments. The car accelerates from rest to a speed of 20 m s-1 over a period of 5 s, and then travels at this speed for a further 20 s. The car then decelerates to a speed of 6 m s-1 over a period of 5 s. This speed is maintained for a further (T - 30) s. The car then accelerates again to a speed of 20 m s-1 over a period of (50 - T) s, before decelerating to rest over a period of 10 s.
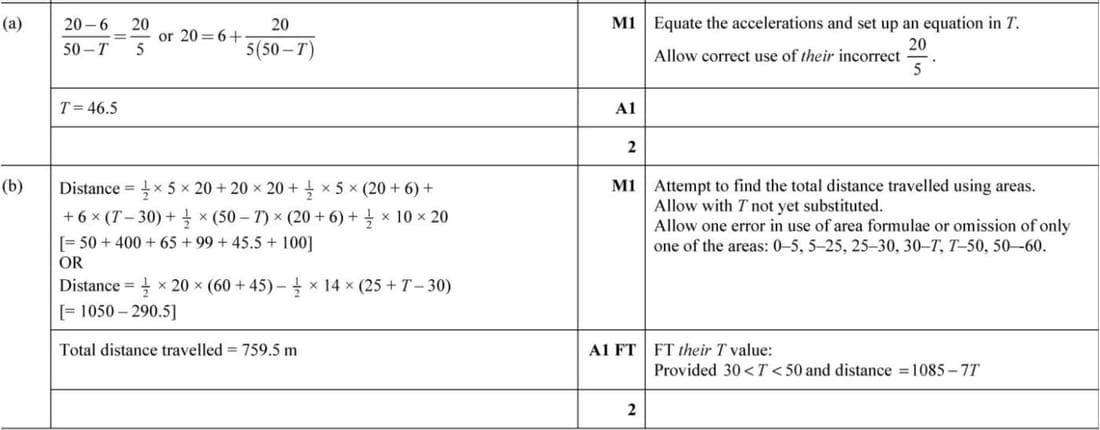
- Given that during the two stages of the motion when the car is accelerating, the accelerations are equal, find the value of T.
- Find the total distance travelled by the car during the motion.
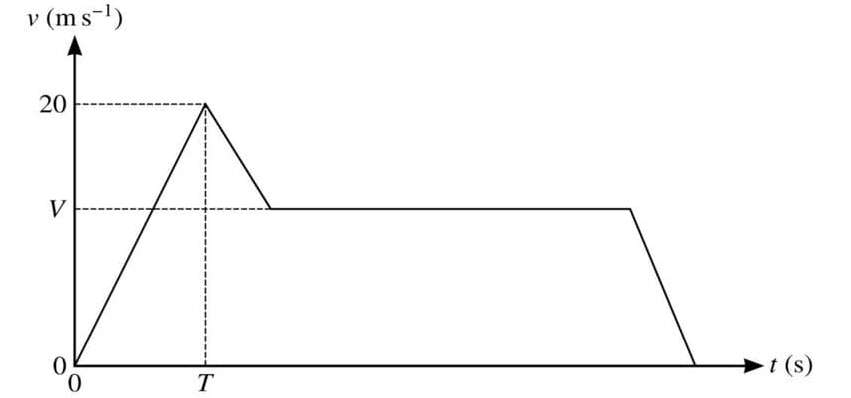
Nov 2020 p42 q4
The diagram shows a velocity-time graph which models the motion of a car. The graph consists of four straight line segments. The car accelerates at a constant rate of 2 m s-2 from rest to a speed of 20 m s-1 over a period of T s. It then decelerates at a constant rate for 5 seconds before travelling at a constant speed of V m s-1 for 27.5 s. The car then decelerates to rest at a constant rate over a period of 5 s.
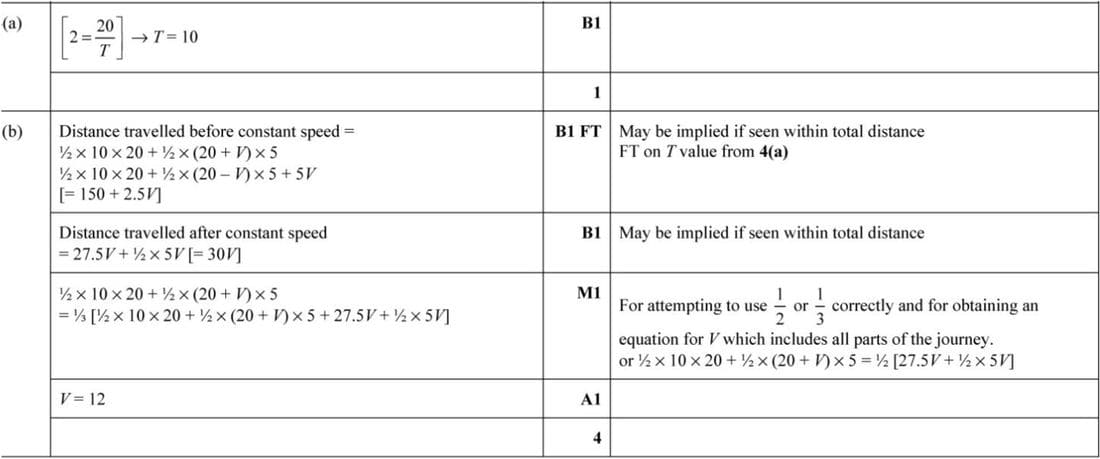
(a) Find T.
(b) Given that the distance travelled up to the point at which the car begins to move with constant speed is one third of the total distance travelled, find V.
Nov 2019 p42 q2
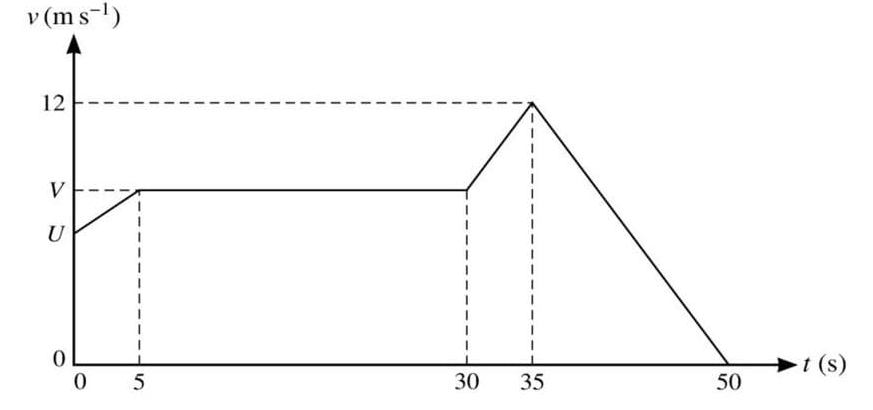
The diagram shows a velocity-time graph which models the motion of a tractor. The graph consists of four straight line segments. The tractor passes a point O at time \(t = 0\) with speed \(U \text{ m s}^{-1}\). The tractor accelerates to a speed of \(V \text{ m s}^{-1}\) over a period of 5 s, and then travels at this speed for a further 25 s. The tractor then accelerates to a speed of 12 \(\text{ m s}^{-1}\) over a period of 5 s. The tractor then decelerates to rest over a period of 15 s.
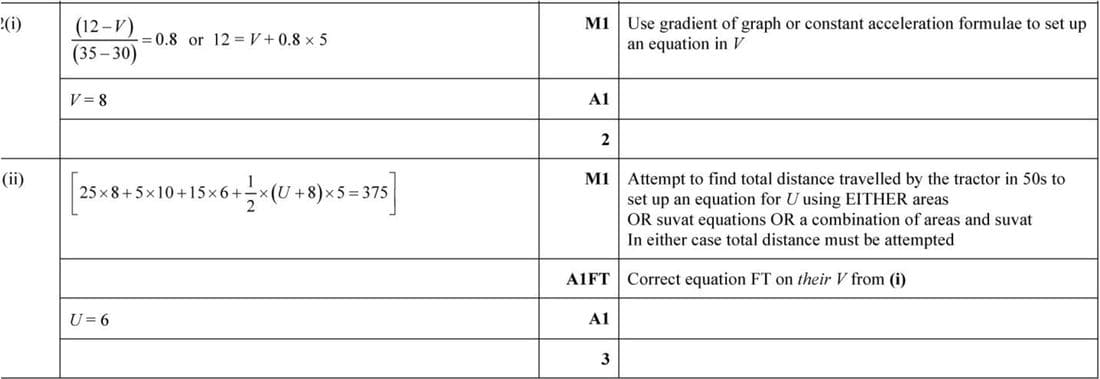
- Given that the acceleration of the tractor between \(t = 30\) and \(t = 35\) is \(0.8 \text{ m s}^{-2}\), find the value of \(V\).
- Given also that the total distance covered by the tractor in the 50 seconds of motion is 375 m, find the value of \(U\).