Exam-Style Problems
⬅ Back to SubchapterNov 2008 p6 q5
The pulse rates, in beats per minute, of a random sample of 15 small animals are shown in the following table.
| 115 | 120 | 158 | 132 | 125 |
| 104 | 142 | 160 | 145 | 104 |
| 162 | 117 | 109 | 124 | 134 |
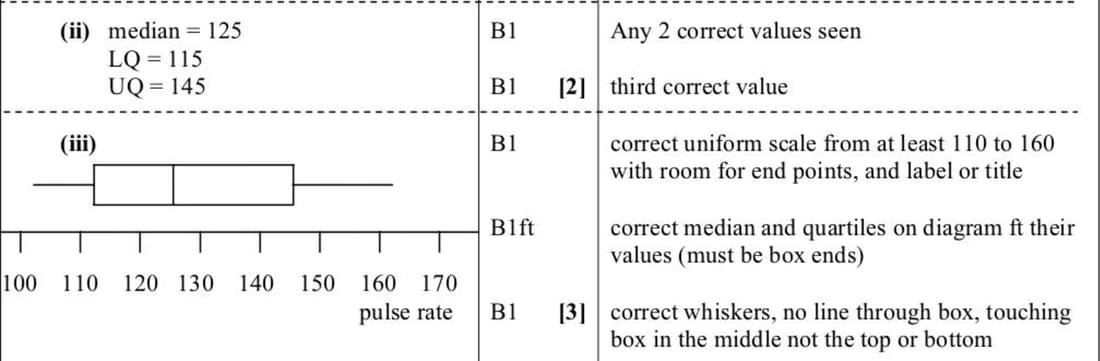
(ii) Find the median and the quartiles.
(iii) On graph paper, using a scale of 2 cm to represent 10 beats per minute, draw a box-and-whisker plot of the data.
June 2022 p52 q3
The back-to-back stem-and-leaf diagram shows the diameters, in cm, of 19 cylindrical pipes produced by each of two companies, A and B.
| Company A | Company B | |
|---|---|---|
| 9 8 3 2 0 | 33 | 1 2 8 |
| 8 7 5 4 1 | 34 | 1 6 8 9 9 |
| 9 6 5 2 | 35 | 1 2 2 3 |
| 4 3 1 | 36 | 5 6 |
| 37 | 0 3 4 | |
| 38 | 2 8 |
Key: 1 | 35 | 3 means the pipe diameter from company A is 0.351 cm and from company B is 0.353 cm.
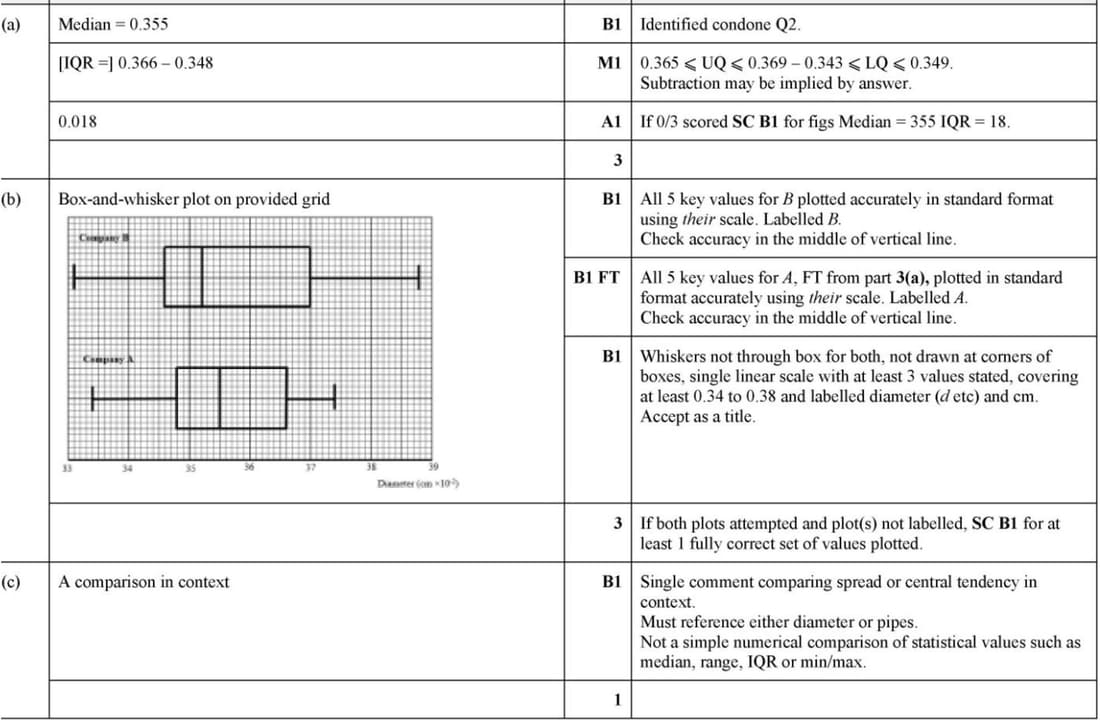
- Find the median and interquartile range of the pipes produced by company A.
- It is given that for the pipes produced by company B the lower quartile, median and upper quartile are 0.346 cm, 0.352 cm and 0.370 cm respectively. Draw box-and-whisker plots for companies A and B on the grid below.
- Make one comparison between the diameters of the pipes produced by companies A and B.
Nov 2006 p6 q3
In a survey, people were asked how long they took to travel to and from work, on average. The median time was 3 hours 36 minutes, the upper quartile was 4 hours 42 minutes and the interquartile range was 3 hours 48 minutes. The longest time taken was 5 hours 12 minutes and the shortest time was 30 minutes.
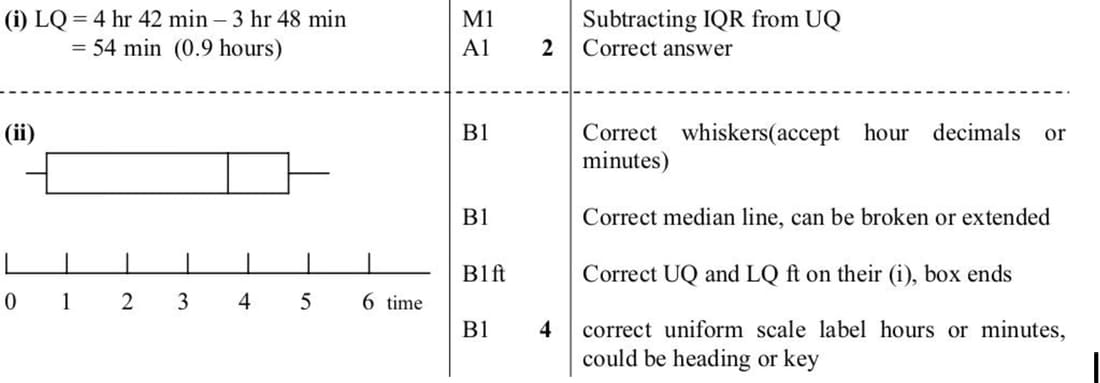
- Find the lower quartile.
- Represent the information by a box-and-whisker plot, using a scale of 2 cm to represent 60 minutes.
June 2005 p6 q4
The following back-to-back stem-and-leaf diagram shows the cholesterol count for a group of 45 people who exercise daily and for another group of 63 who do not exercise. The figures in brackets show the number of people corresponding to each set of leaves.
| People who exercise | People who do not exercise | |||
|---|---|---|---|---|
| (9) | 9 8 7 6 4 3 2 2 1 | 3 | 1 5 7 7 | (4) |
| (12) | 9 8 8 7 6 6 5 3 3 2 2 | 4 | 2 3 4 4 5 8 | (6) |
| (9) | 8 7 7 7 6 5 3 3 1 | 5 | 1 2 2 2 3 4 4 5 6 7 8 8 9 | (13) |
| (7) | 6 6 6 6 4 3 2 | 6 | 1 2 3 3 4 5 5 5 7 7 8 9 9 | (14) |
| (3) | 8 4 1 | 7 | 2 4 5 5 6 7 8 8 | (9) |
| (4) | 9 5 5 2 | 8 | 1 3 3 4 6 7 9 9 9 | (9) |
| (1) | 4 | 9 | 1 4 5 5 8 | (5) |
| (0) | 10 | 3 3 6 | (3) |
Key: \( 2 \mid 8 \mid 1 \) represents a cholesterol count of \( 8.2 \) in the group who exercise and \( 8.1 \) in the group who do not exercise.
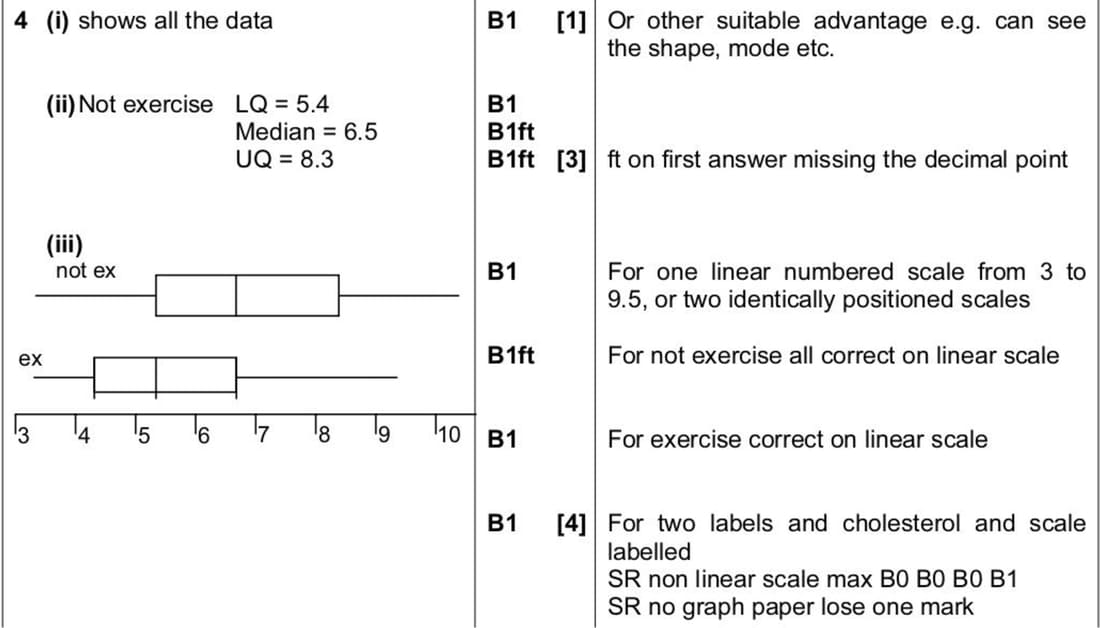
- Give one useful feature of a stem-and-leaf diagram.
- Find the median and the quartiles of the cholesterol count for the group who do not exercise.
- You are given that the lower quartile, median and upper quartile of the cholesterol count for the group who exercise are 4.25, 5.3 and 6.6 respectively.
- On a single diagram on graph paper, draw two box-and-whisker plots to illustrate the data.
Nov 2002 p6 q7
The weights in kilograms of two groups of 17-year-old males from country P and country Q are displayed in the following back-to-back stem-and-leaf diagram. In the third row of the diagram, 4 | 7 | 1 denotes weights of 74 kg for a male in country P and 71 kg for a male in country Q.
| Country P | Country Q | |
|---|---|---|
| 5 | 1 5 | |
| 6 | 2 3 4 8 | |
| 9 8 7 6 4 | 7 | 1 3 4 5 6 7 7 8 8 9 |
| 8 8 6 6 5 3 | 8 | 2 3 6 7 7 8 8 |
| 9 7 7 6 5 5 5 4 2 | 9 | 0 2 2 4 |
| 5 4 4 3 1 | 10 | 4 5 |
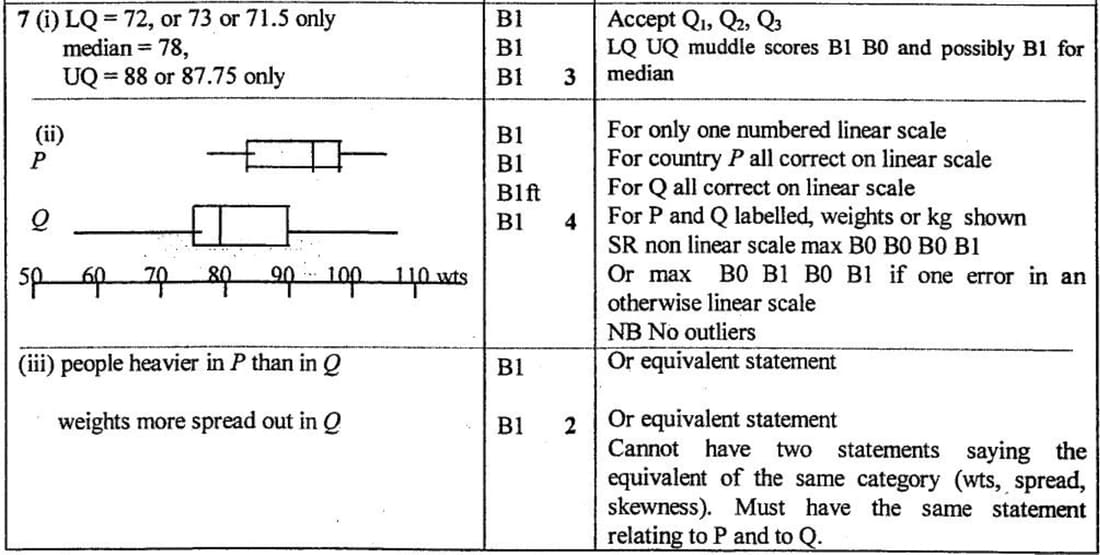
- Find the median and quartile weights for country Q.
- You are given that the lower quartile, median and upper quartile for country P are 84, 94 and 98 kg respectively. On a single diagram on graph paper, draw two box-and-whisker plots of the data.
- Make two comments on the weights of the two groups.